The Best Performing Dividend ETFs over the Last 10 Years
Updated as of: July 2, 2026
Dividend income composes a major part of equity investing over the long run; more than one-third of U.S. stock market total returns since 1930 have been produced by dividends.
The rise of exchange-traded funds (ETFs) in recent decades have enabled exposure to many individual stocks through a single security that trades on the open market. Thanks to ETFs, portfolio managers and clients have been afforded convenient access to a basket of companies packaged together in a single, cost-efficient security focused on a targeted investment objective.
One common investment objective is dividend income, and this article contains the best-performing dividend ETFs from the last year all the way back to the past decade, with data routinely updated by YCharts.
To create this list, we analyzed the entire ETF universe using the YCharts Fund Screener to find the best-performing equity income ETFs on a 1-year, 3-year, 5-year, and 10-year basis. (ETFs with leveraged or inverse attributes as well as those in the alternative currency strategy and options arbitrage strategy peer groups were excluded to focus on long-term investment vehicles that align with broader financial planning goals)
Table of Contents
Looking for similar lists of the best-performing dividend stocks? Check out our Best Performing Dividend Stocks analysis here.
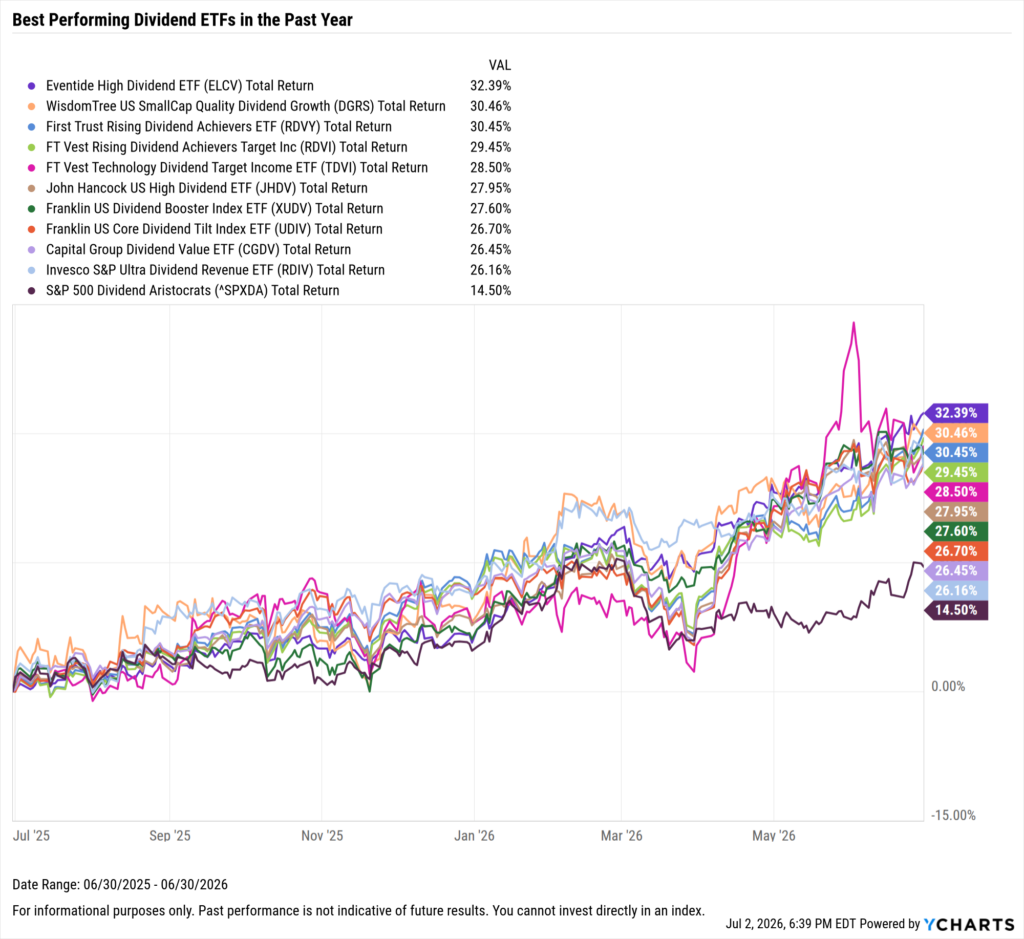
Best Performing Dividend ETFs in the Last Year
These are the top-performing dividend ETFs over the past year, as of June 30, 2026.
| Symbol | Name | 1 Year Total Returns (Monthly) | Total Returns Since Inception (Monthly) | Dividend Yield | Net Expense Ratio | Share Class Assets Under Management |
|---|---|---|---|---|---|---|
| ELCV | Eventide High Dividend ETF | 32.39% | 35.27% | 2.09% | 0.49% | $250,469,102 |
| DGRS | WisdomTree US SmallCap Quality Dividend Growth | 30.46% | 221.53% | 2.04% | 0.38% | $398,087,260 |
| RDVY | First Trust Rising Dividend Achievers ETF | 30.45% | 401.21% | 0.84% | 0.47% | $24,438,269,512 |
| RDVI | FT Vest Rising Dividend Achievers Target Inc | 29.45% | 105.74% | 7.02% | 0.75% | $3,490,512,574 |
| TDVI | FT Vest Technology Dividend Target Income ETF | 28.50% | 102.21% | 7.28% | 0.75% | $495,790,823 |
| JHDV | John Hancock US High Dividend ETF | 27.95% | 103.45% | 2.07% | 0.34% | $12,165,727 |
| XUDV | Franklin US Dividend Booster Index ETF | 27.60% | 30.20% | 3.43% | 0.09% | $74,248,381 |
| UDIV | Franklin US Core Dividend Tilt Index ETF | 26.70% | 210.83% | 1.49% | 0.06% | $137,700,989 |
| CGDV | Capital Group Dividend Value ETF | 26.45% | 114.06% | 1.19% | 0.33% | $36,214,569,789 |
| RDIV | Invesco S&P Ultra Dividend Revenue ETF | 26.16% | 288.98% | 3.71% | 0.39% | $1,275,910,944 |
Start a Free Trial to See Full Rankings | View & Modify in Fund Screener
Download Visual | Modify in YCharts
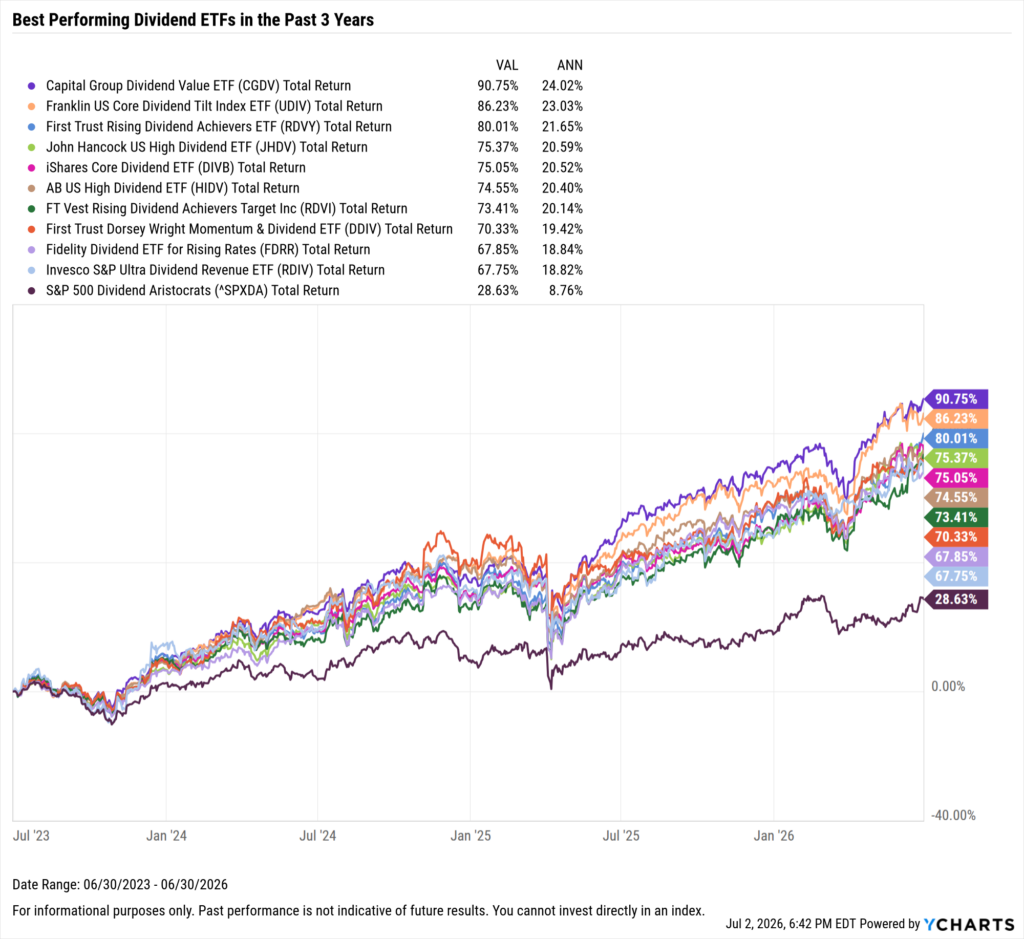
Best Performing Dividend ETFs in the Last 3 Years
These are the top-performing dividend ETFs on an annualized basis between July 1st, 2023 and June 30, 2026.
| Symbol | Name | 3 Year Total Returns (Monthly) | Annualized 3 Year Total Returns (Monthly) | Total Returns Since Inception (Monthly) | Dividend Yield | Net Expense Ratio | Share Class Assets Under Management |
|---|---|---|---|---|---|---|---|
| CGDV | Capital Group Dividend Value ETF | 90.75% | 24.02% | 114.06% | 1.19% | 0.33% | $36,214,569,789 |
| UDIV | Franklin US Core Dividend Tilt Index ETF | 86.23% | 23.03% | 210.83% | 1.49% | 0.06% | $137,700,989 |
| RDVY | First Trust Rising Dividend Achievers ETF | 80.01% | 21.65% | 401.21% | 0.84% | 0.47% | $24,438,269,512 |
| JHDV | John Hancock US High Dividend ETF | 75.37% | 20.59% | 103.45% | 2.07% | 0.34% | $12,165,727 |
| DIVB | iShares Core Dividend ETF | 75.05% | 20.52% | 204.88% | 2.24% | 0.05% | $1,546,747,946 |
| HIDV | AB US High Dividend ETF | 74.55% | 20.40% | 96.29% | 2.34% | 0.35% | $204,564,707 |
| RDVI | FT Vest Rising Dividend Achievers Target Inc | 73.41% | 20.14% | 105.74% | 7.02% | 0.75% | $3,490,512,574 |
| DDIV | First Trust Dorsey Wright Momentum & Dividend ETF | 70.33% | 19.42% | 222.38% | 1.59% | 0.60% | $67,502,948 |
| FDRR | Fidelity Dividend ETF for Rising Rates | 67.85% | 18.84% | 239.96% | 2.15% | 0.15% | $712,171,388 |
| RDIV | Invesco S&P Ultra Dividend Revenue ETF | 67.75% | 18.82% | 288.98% | 3.71% | 0.39% | $1,275,910,944 |
Start a Free Trial to See Full Rankings | View & Modify in Fund Screener
Download Visual | Modify in YCharts
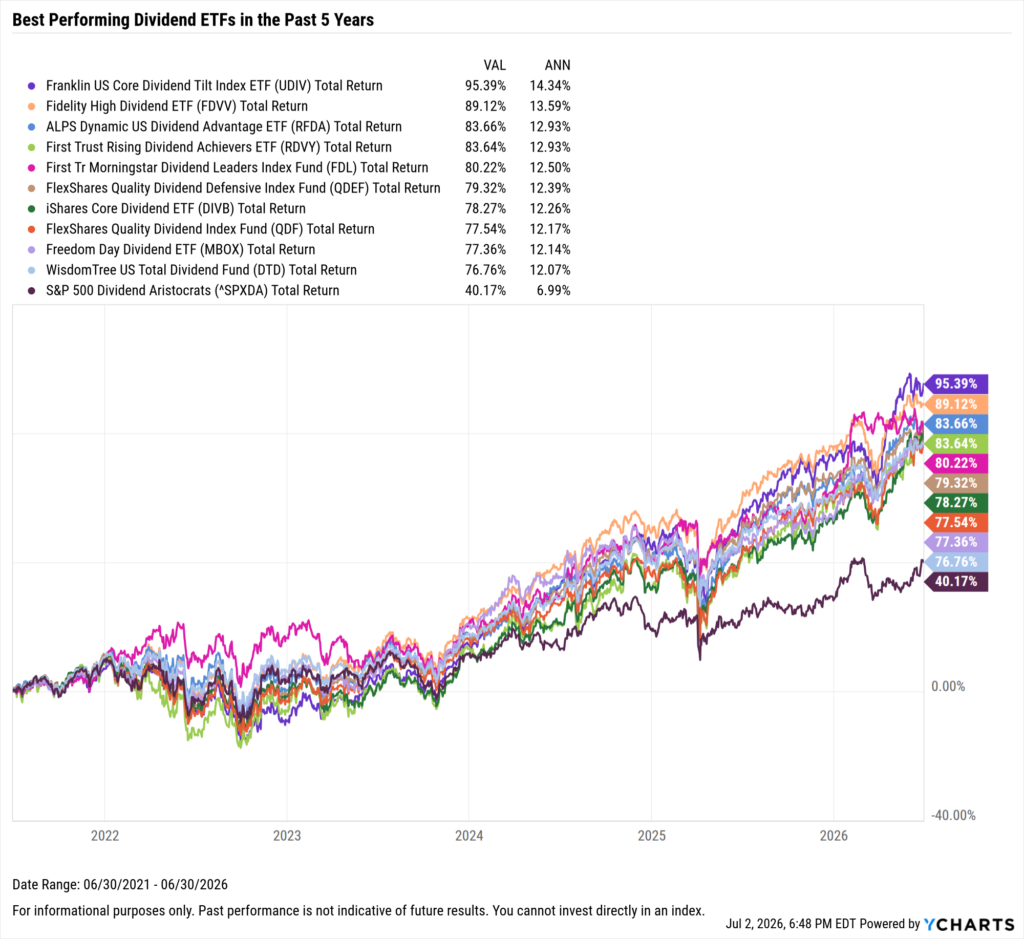
Best Performing Dividend ETFs in the Last 5 Years
These are the top-performing dividend ETFs on an annualized basis between July 1, 2021 and June 30, 2026.
| Symbol | Name | 5 Year Total Returns (Monthly) | Annualized 5 Year Total Returns (Monthly) | Total Returns Since Inception (Monthly) | Dividend Yield | Net Expense Ratio | Share Class Assets Under Management |
|---|---|---|---|---|---|---|---|
| UDIV | Franklin US Core Dividend Tilt Index ETF | 95.39% | 14.34% | 210.83% | 1.49% | 0.06% | $137,700,989 |
| FDVV | Fidelity High Dividend ETF | 89.12% | 13.59% | 240.16% | 2.85% | 0.15% | $9,788,810,463 |
| RFDA | ALPS Dynamic US Dividend Advantage ETF | 83.66% | 12.93% | 249.51% | 1.79% | 0.52% | $86,311,405 |
| RDVY | First Trust Rising Dividend Achievers ETF | 83.64% | 12.93% | 401.21% | 0.84% | 0.47% | $24,438,269,512 |
| FDL | First Tr Morningstar Dividend Leaders Index Fund | 80.22% | 12.50% | 428.80% | 3.78% | 0.43% | $7,325,514,111 |
| QDEF | FlexShares Quality Dividend Defensive Index Fund | 79.32% | 12.39% | 399.30% | 1.62% | 0.39% | $533,952,179 |
| DIVB | iShares Core Dividend ETF | 78.27% | 12.26% | 204.88% | 2.24% | 0.05% | $1,546,747,946 |
| QDF | FlexShares Quality Dividend Index Fund | 77.54% | 12.17% | 402.94% | 1.50% | 0.39% | $2,192,654,330 |
| MBOX | Freedom Day Dividend ETF | 77.36% | 12.14% | 78.04% | 1.92% | 0.39% | $141,876,900 |
| DTD | WisdomTree US Total Dividend Fund | 76.76% | 12.07% | 535.34% | 1.85% | 0.28% | $1,613,586,527 |
Start a Free Trial to See Full Rankings | View & Modify in Fund Screener
Download Visual | Modify in YCharts
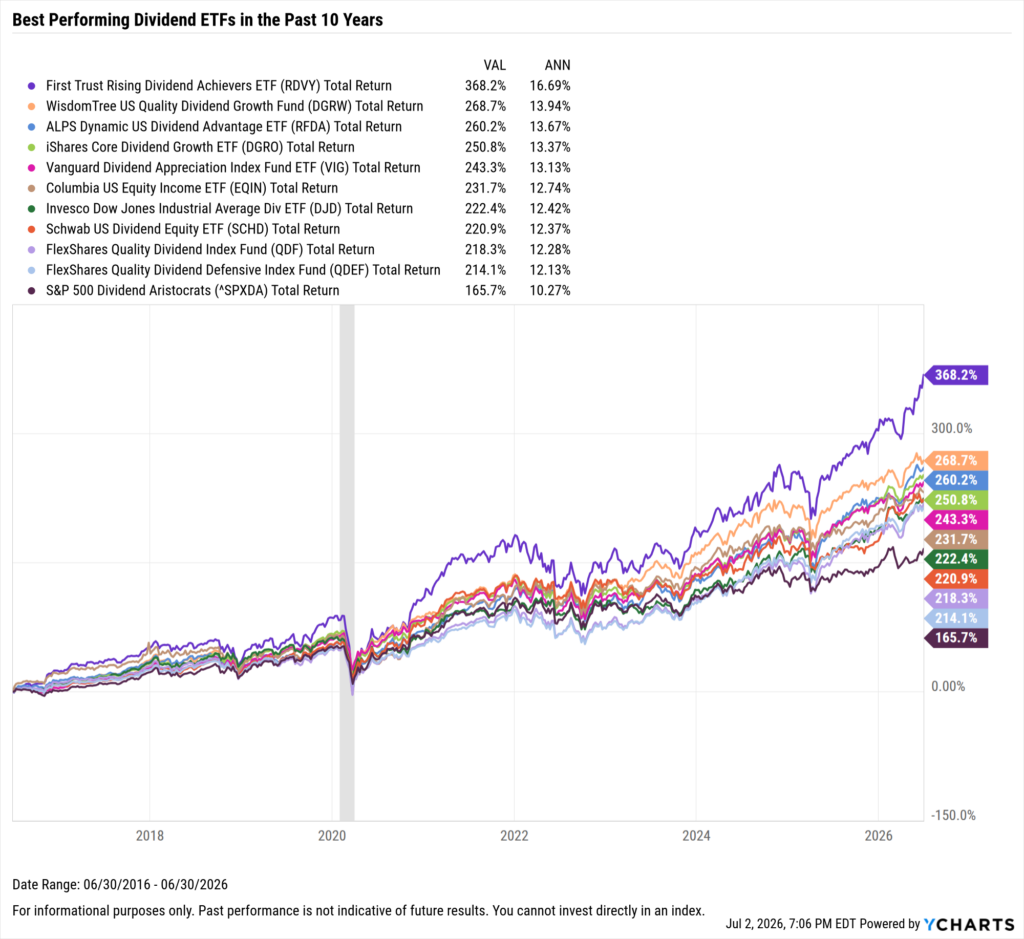
Best Performing Dividend ETFs in the Last 10 Years
These are the top-performing dividend ETFs on an annualized basis between July 1, 2016 and June 30, 2026.
| Symbol | Name | 10 Year Total Returns (Monthly) | Annualized 10 Year Total Returns (Monthly) | Total Returns Since Inception (Monthly) | Dividend Yield | Net Expense Ratio | Share Class Assets Under Management |
|---|---|---|---|---|---|---|---|
| RDVY | First Trust Rising Dividend Achievers ETF | 368.22% | 16.69% | 401.21% | 0.84% | 0.47% | $24,438,269,512 |
| DGRW | WisdomTree US Quality Dividend Growth Fund | 268.69% | 13.94% | 397.54% | 1.27% | 0.28% | $16,587,775,585 |
| RFDA | ALPS Dynamic US Dividend Advantage ETF | 260.23% | 13.67% | 249.51% | 1.79% | 0.52% | $86,311,405 |
| DGRO | iShares Core Dividend Growth ETF | 250.82% | 13.37% | 306.48% | 1.94% | 0.08% | $41,396,301,117 |
| VIG | Vanguard Dividend Appreciation Index Fund ETF | 243.32% | 13.13% | 605.02% | 1.51% | 0.04% | $110,061,965,148 |
| EQIN | Columbia US Equity Income ETF | 231.68% | 12.74% | 217.46% | 1.90% | 0.35% | $289,603,071 |
| DJD | Invesco Dow Jones Industrial Average Div ETF | 222.36% | 12.42% | 240.11% | 2.46% | 0.07% | $463,914,244 |
| SCHD | Schwab US Dividend Equity ETF | 220.91% | 12.37% | 507.74% | 3.29% | 0.06% | $96,249,343,313 |
| QDF | FlexShares Quality Dividend Index Fund | 218.30% | 12.28% | 402.94% | 1.50% | 0.39% | $2,192,654,330 |
| QDEF | FlexShares Quality Dividend Defensive Index Fund | 214.09% | 12.13% | 399.30% | 1.62% | 0.39% | $533,952,179 |
Start a Free Trial to See Full Rankings | View & Modify in Fund Screener
Download Visual | Modify in YCharts
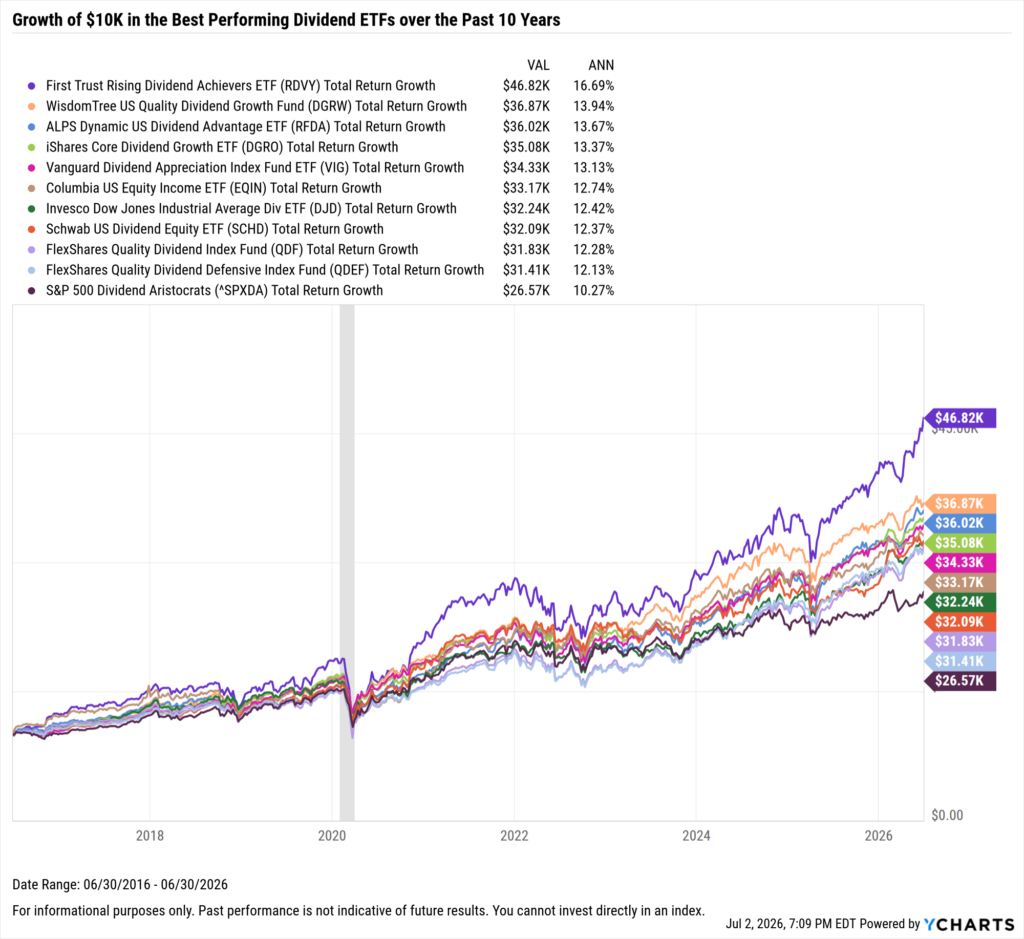
What Was the Growth of $10,000 in the Top Dividend ETFs Over the Last 10 Years?
The best-performing dividend ETF in the last 10 years was the First Trust Rising Dividend Achievers ETF (RDVY). A $10,000 investment into RDVY 10 years ago would be worth $46,820 today. Right behind it was the WisdomTree US Quality Dividend Growth Fund ETF (DGRW); investing $10,000 into DGRW back in 2016 would’ve turned into nearly $37K.
Investing $10,000 into the S&P 500 Dividend Aristocrats index netted a balance of $26,570 on a 10.3% annualized total return over the last ten years, landing it just shy of the ten best-performing dividend ETFs.
Download Visual | Modify in YCharts
Whenever you’re ready, here’s how YCharts can help you:
1. Interested in doing further ETF research with YCharts?
2. Want to test out YCharts for free?
Start a no-risk 7-Day Free Trial.
3. Sign up for a copy of our Fund Flows Report and Visual Deck to stay on top of mutual fund trends:
Sign up to recieve a copy of our monthly Fund Flows Report:Disclaimer
©2026 YCharts, Inc. All Rights Reserved. YCharts, Inc. (“YCharts”) is not registered with the U.S. Securities and Exchange Commission (or with the securities regulatory authority or body of any state or any other jurisdiction) as an investment adviser, broker-dealer or in any other capacity, and does not purport to provide investment advice or make investment recommendations. This report has been generated through application of the analytical tools and data provided through ycharts.com and is intended solely to assist you or your investment or other adviser(s) in conducting investment research. You should not construe this report as an offer to buy or sell, as a solicitation of an offer to buy or sell, or as a recommendation to buy, sell, hold or trade, any security or other financial instrument. For further information regarding your use of this report, please go to: ycharts.com/about/disclosure.
Next Article
10 Best Performing REITs & REIT ETFs over the last 10 YearsRead More →