The Best Performing Stocks of 2024
Earlier this month, we hosted a conversation with Josh Brown on trends shaping 2025 and a year end strategy session with Charlie Bilello, Chief Market Strategist at Creative Planning.
In the spirit of year-end recaps and closing out 2024, this post covers the best-performing stocks of 2024 within each of five major indices:
- Dow Jones Industrial Average
- Nasdaq-100
- S&P 500
- Russell 1000
- Russell 2000
Each section also contains a scatter plot visualizing the “2024 winners and losers” for that index. All data is through December 31st, 2024. (Market cap data is through January 6th, 2024)
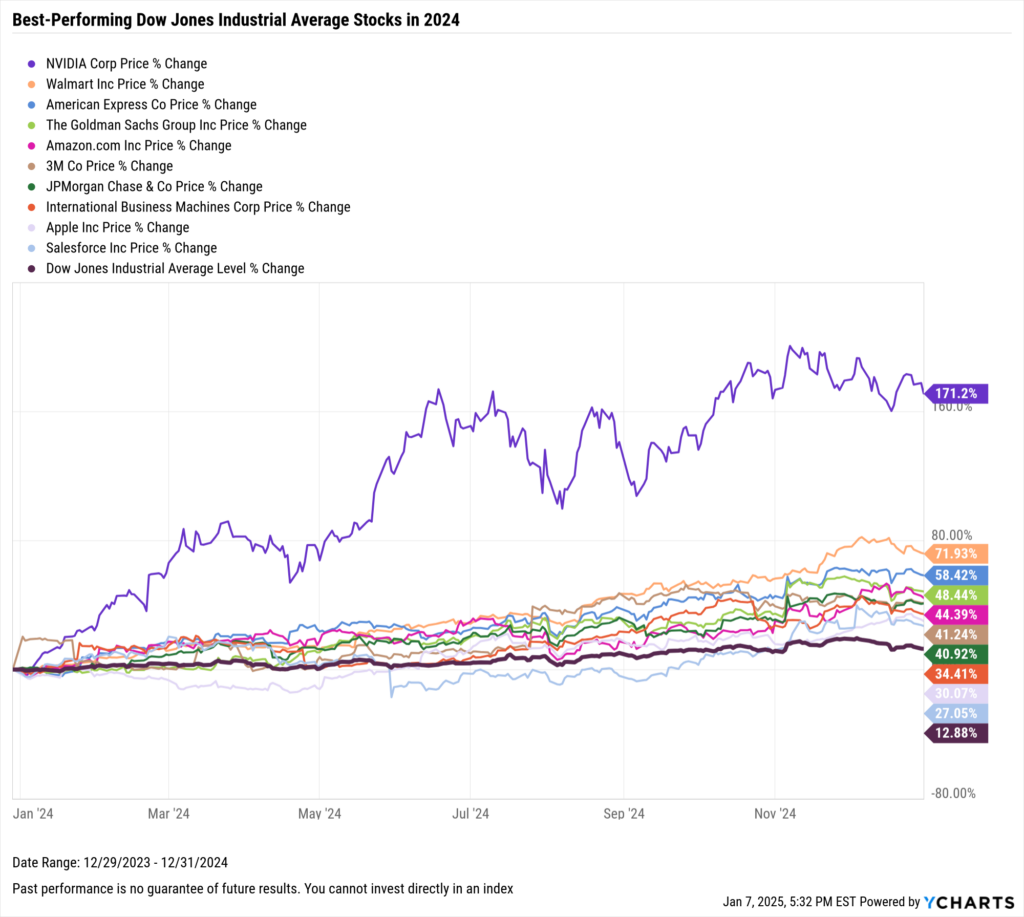
Best-Performing Dow Jones Industrial Average Stocks in 2024
These are the top-performing stocks in 2024 out of the 30 screened companies in the Dow Jones Industrial Average:
| Symbol | Name | YTD Price Returns | Market Cap |
|---|---|---|---|
| NVDA | NVIDIA Corp | 171.20% | $3.433T |
| WMT | Walmart Inc | 71.90% | $729.43B |
| AXP | American Express Co | 58.40% | $212.83B |
| GS | The Goldman Sachs Group Inc | 48.40% | $182.11B |
| AMZN | Amazon.com Inc | 44.40% | $2.336T |
| MMM | 3M Co | 41.20% | $72.29B |
| JPM | JPMorgan Chase & Co | 40.90% | $684.69B |
| IBM | International Business Machines Corp | 34.40% | $207.07B |
| AAPL | Apple Inc | 30.10% | $3.662T |
| CRM | Salesforce Inc | 27.10% | $310.98B |
Download Visual | Modify in YCharts
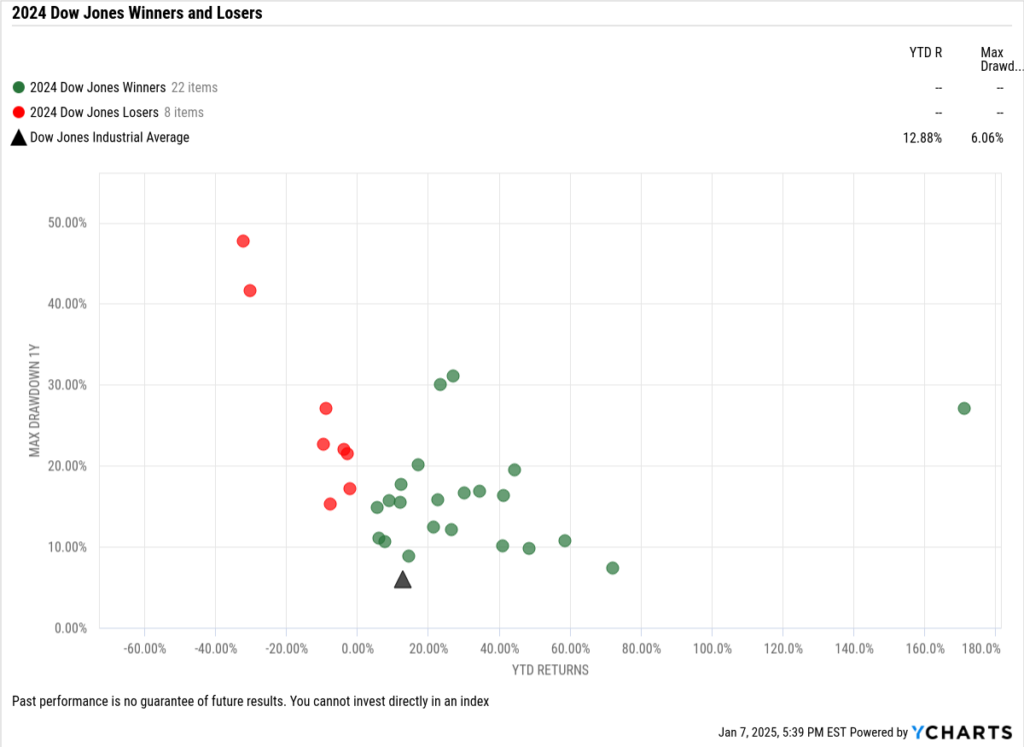
73.3% of the Dow Jones Industrial Average was positive in 2024:
Download Visual | Modify in YCharts
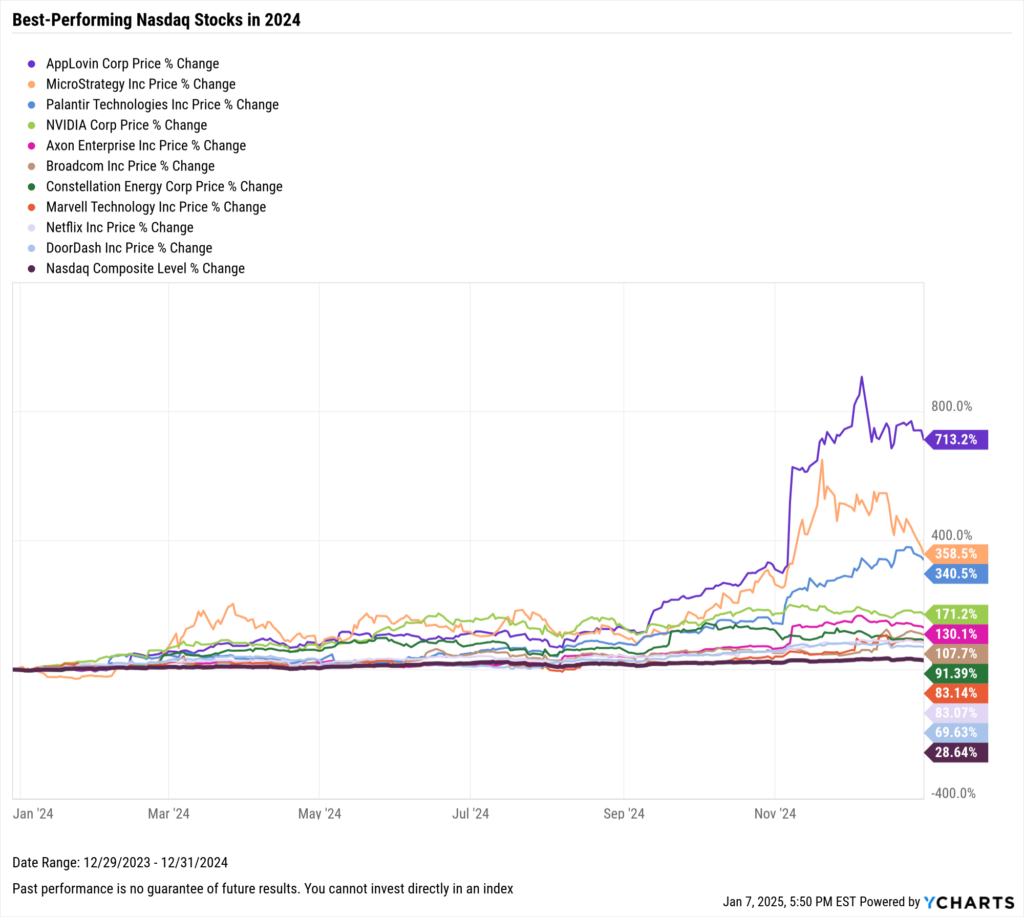
Best-Performing NASDAQ-100 Stocks in 2024
These are the top-performing stocks in 2024 out of the 101 screened companies in the NASDAQ-100:
| Symbol | Name | YTD Price Returns | Market Cap |
|---|---|---|---|
| APP | AppLovin Corp | 713.2% | $110.75B |
| MSTR | MicroStrategy Inc | 358.5% | $76.84B |
| PLTR | Palantir Technologies Inc | 340.5% | $159.48B |
| NVDA | NVIDIA Corp | 171.2% | $3.433T |
| AXON | Axon Enterprise Inc | 130.1% | $42.86B |
| AVGO | Broadcom Inc | 107.7% | $1.071T |
| CEG | Constellation Energy Corp | 91.4% | $79.93B |
| MRVL | Marvell Technology Inc | 83.1% | $100.55B |
| NFLX | Netflix Inc | 83.1% | $375.94B |
| DASH | DoorDash Inc | 69.6% | $70.62B |
Download Visual | Modify in YCharts
61.4% of the NASDAQ was positive in 2024:
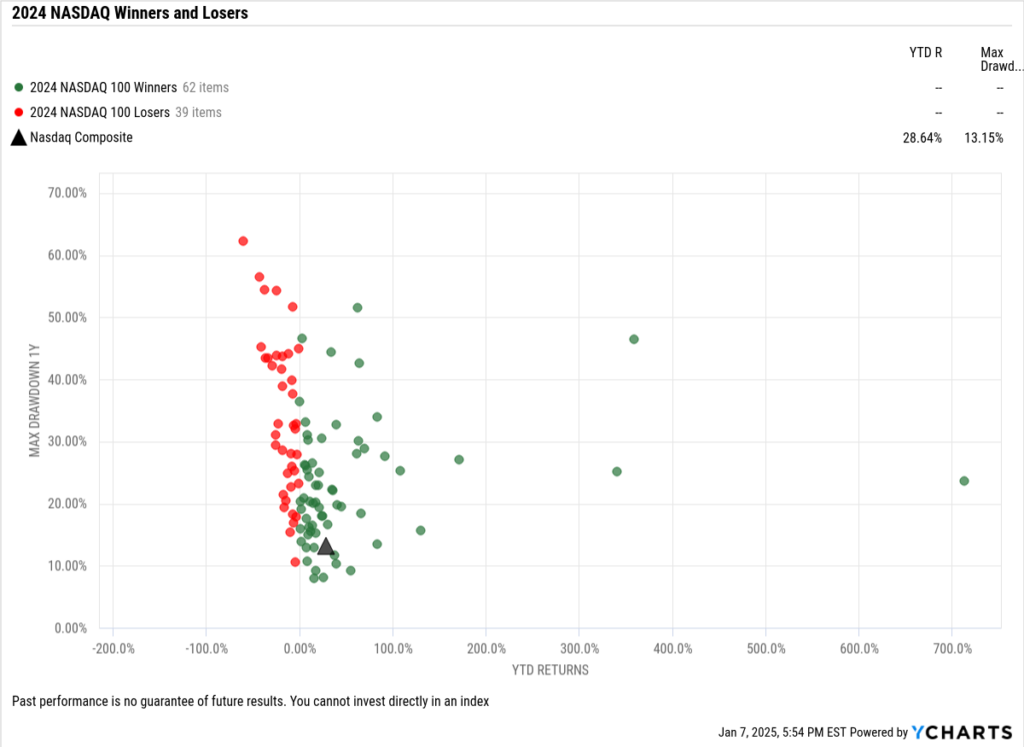
Download Visual | Modify in YCharts
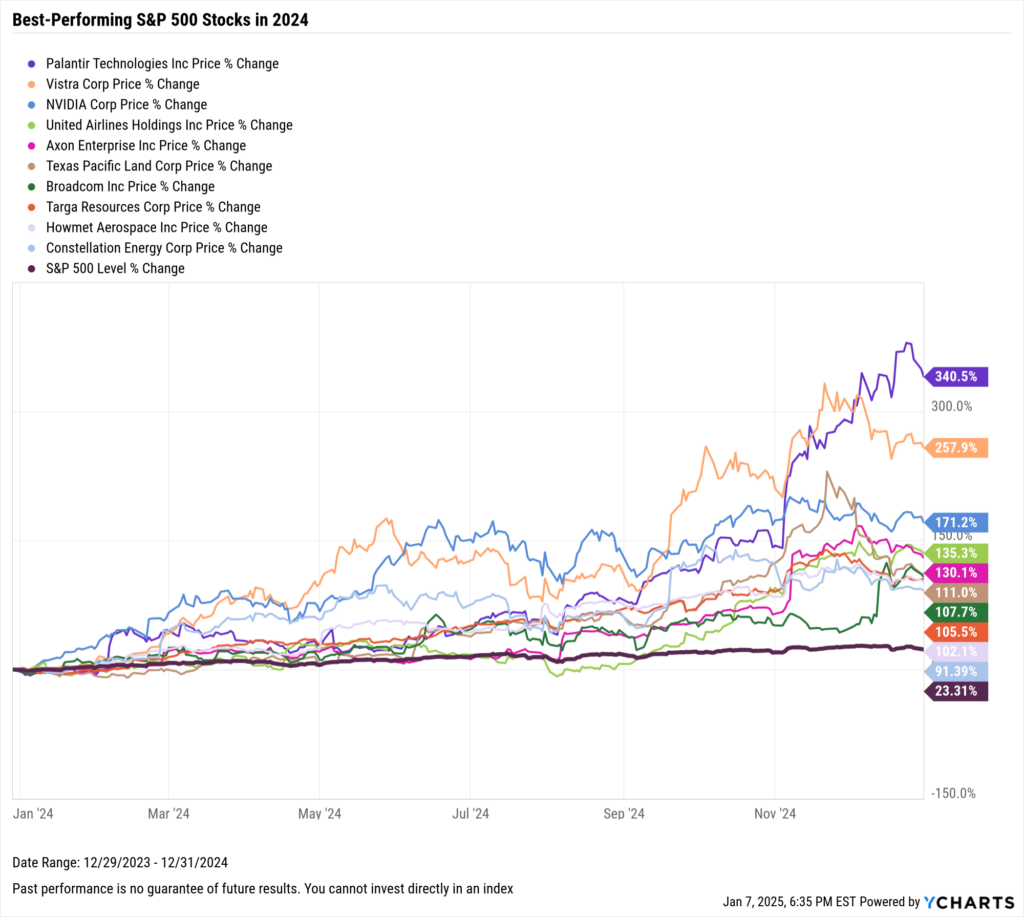
Best-Performing S&P 500 Stocks in 2024
These are the top-performing stocks in 2024 out of the 501 screened companies in the S&P 500:
| Symbol | Name | YTD Price Returns | Market Cap |
|---|---|---|---|
| PLTR | Palantir Technologies Inc | 340.5% | $159.48B |
| VST | Vistra Corp | 257.9% | $55.58B |
| NVDA | NVIDIA Corp | 171.2% | $3.433T |
| UAL | United Airlines Holdings Inc | 135.3% | $33.30B |
| AXON | Axon Enterprise Inc | 130.1% | $42.86B |
| TPL | Texas Pacific Land Corp | 111.0% | $28.90B |
| AVGO | Broadcom Inc | 107.7% | $1.071T |
| TRGP | Targa Resources Corp | 105.5% | $40.95B |
| HWM | Howmet Aerospace Inc | 102.1% | $45.35B |
| CEG | Constellation Energy Corp | 91.4% | $79.93B |
Download Visual | Modify in YCharts
66.3% of the S&P 500 was positive in 2024:
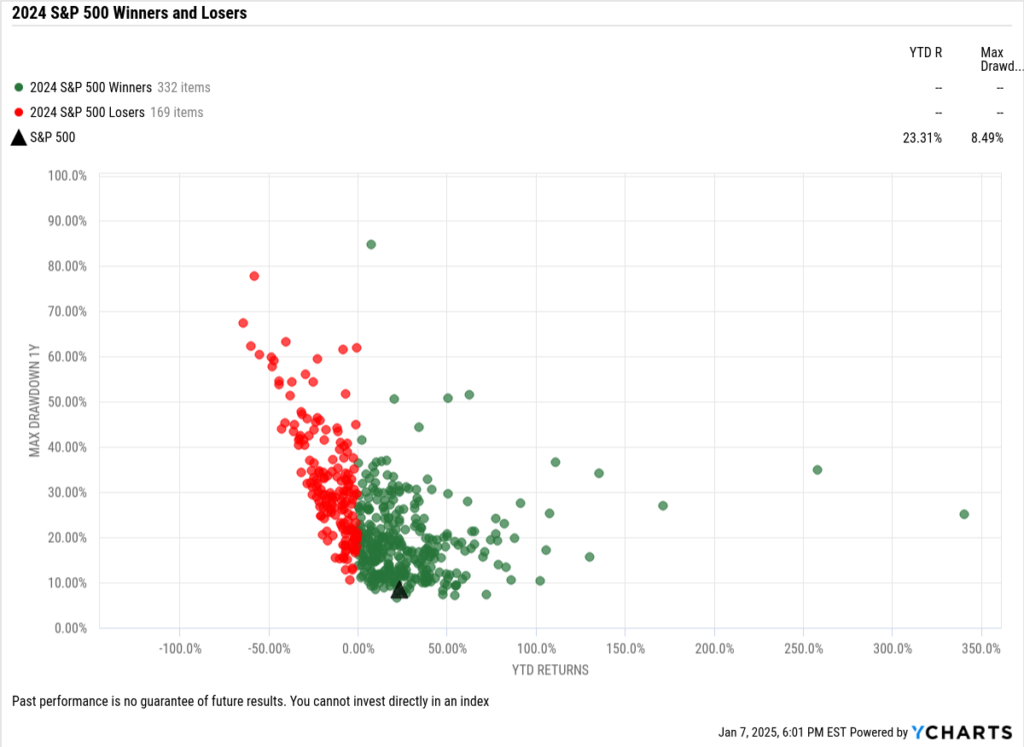
Download Visual | Modify in YCharts
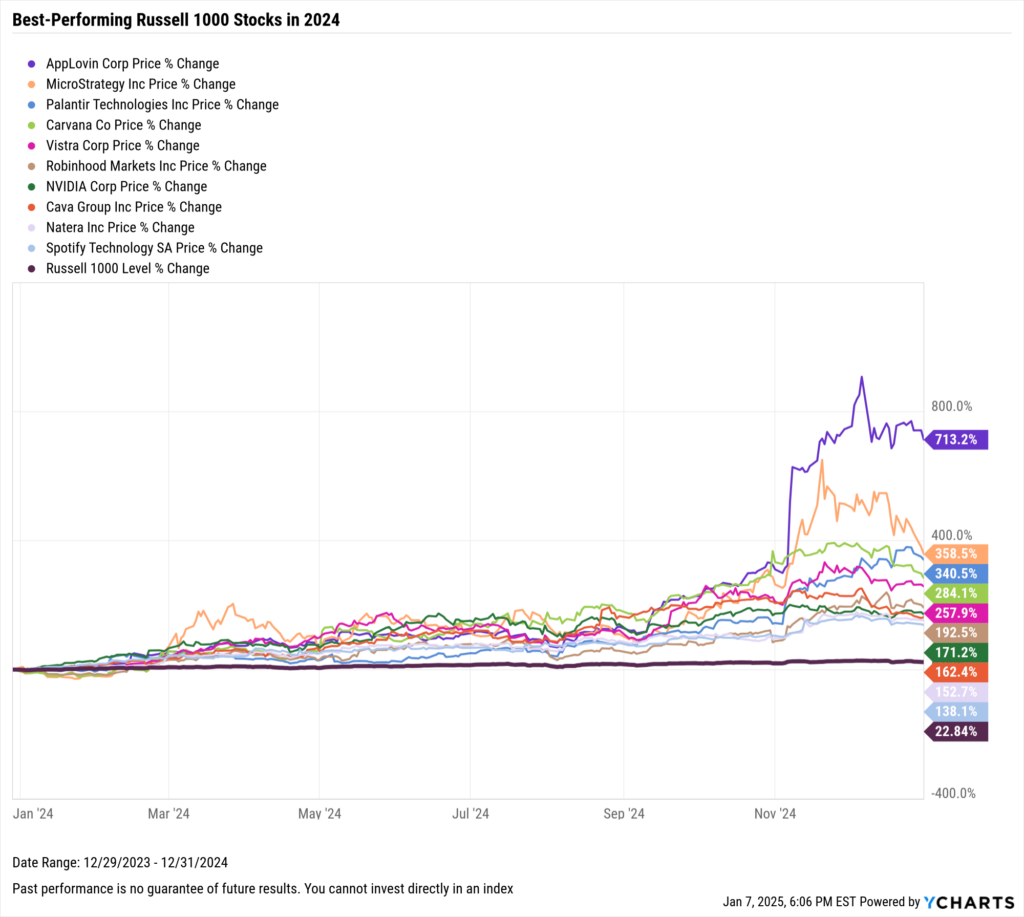
Best-Performing Russell 1000 Stocks in 2024
These are the top-performing stocks in 2024 out of the 994 screened companies in the Russell 1000:
| Symbol | Name | YTD Price Returns | Market Cap |
|---|---|---|---|
| APP | AppLovin Corp | 713.2% | $110.75B |
| MSTR | MicroStrategy Inc | 358.5% | $76.84B |
| PLTR | Palantir Technologies Inc | 340.5% | $159.48B |
| CVNA | Carvana Co | 284.1% | $25.51B |
| VST | Vistra Corp | 257.9% | $55.58B |
| HOOD | Robinhood Markets Inc | 192.5% | $35.86B |
| NVDA | NVIDIA Corp | 171.2% | $3.433T |
| CAVA | Cava Group Inc | 162.4% | $12.93B |
| NTRA | Natera Inc | 152.7% | $22.49B |
| SPOT | Spotify Technology SA | 138.1% | $93.71B |
Download Visual | Modify in YCharts
62.2% of the Russell 1000 was positive in 2024:
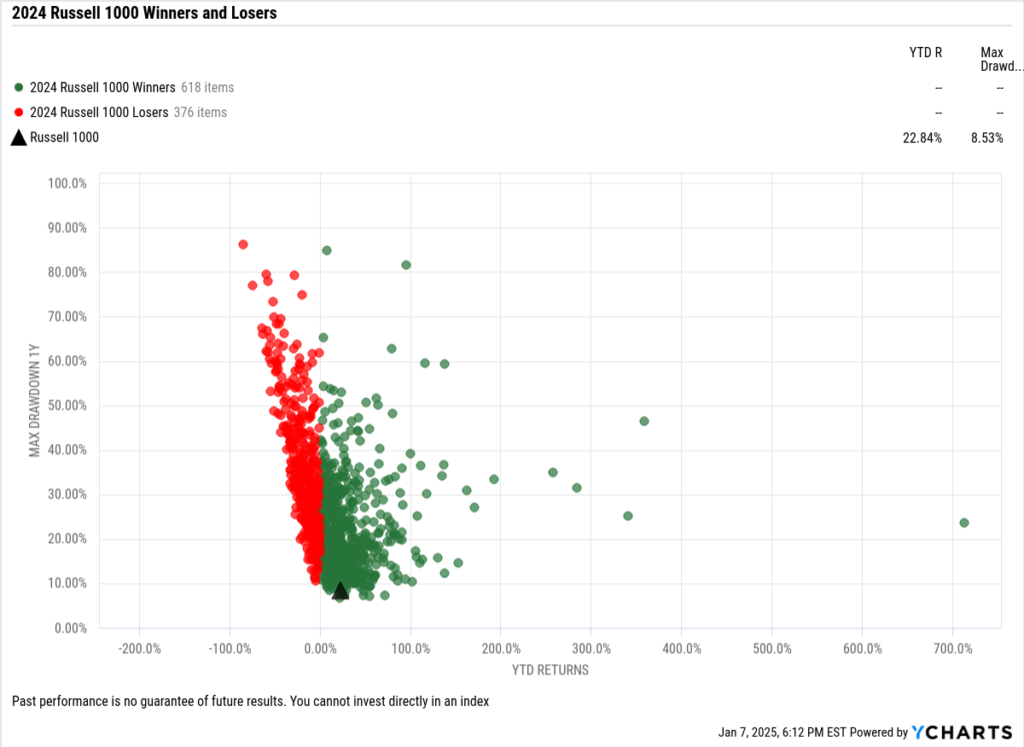
Download Visual | Modify in YCharts
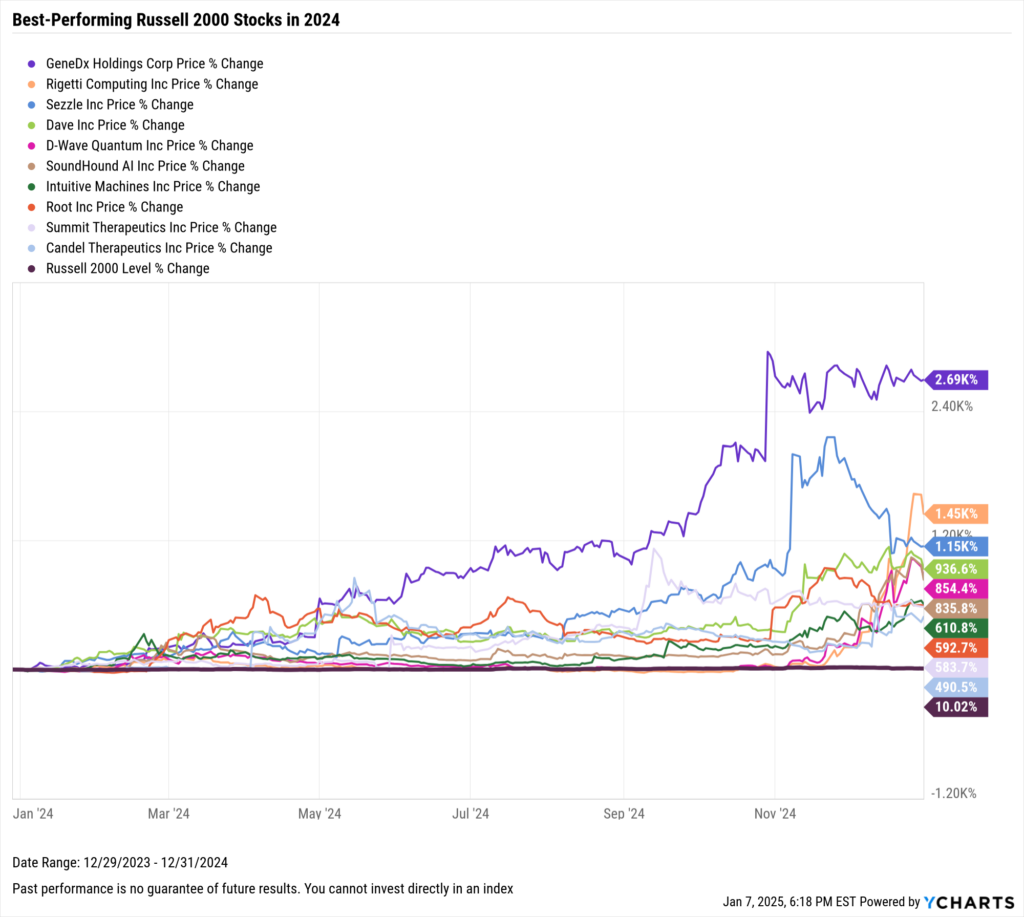
Best-Performing Russell 2000 Stocks in 2024
These are the top-performing stocks in 2024 out of the 1,908 screened companies in the Russell 2000:
| Symbol | Name | YTD Price Returns | Market Cap |
|---|---|---|---|
| WGS | GeneDx Holdings Corp | 2.69K% | $2.661B |
| RGTI | Rigetti Computing Inc | 1.45K% | $3.534B |
| SEZL | Sezzle Inc | 1.15K% | $1.430B |
| DAVE | Dave Inc | 936.6% | $1.092B |
| QBTS | D-Wave Quantum Inc | 854.4% | $2.140B |
| SOUN | SoundHound AI Inc | 835.8% | $6.646B |
| LUNR | Intuitive Machines Inc | 610.8% | $1.606B |
| ROOT | Root Inc | 592.7% | $1.180B |
| SMMT | Summit Therapeutics Inc | 583.7% | $13.38B |
| CADL | Candel Therapeutics Inc | 490.5% | $371.59M |
Download Visual | Modify in YCharts
50.0% of the Russell 2000 was positive in 2024:
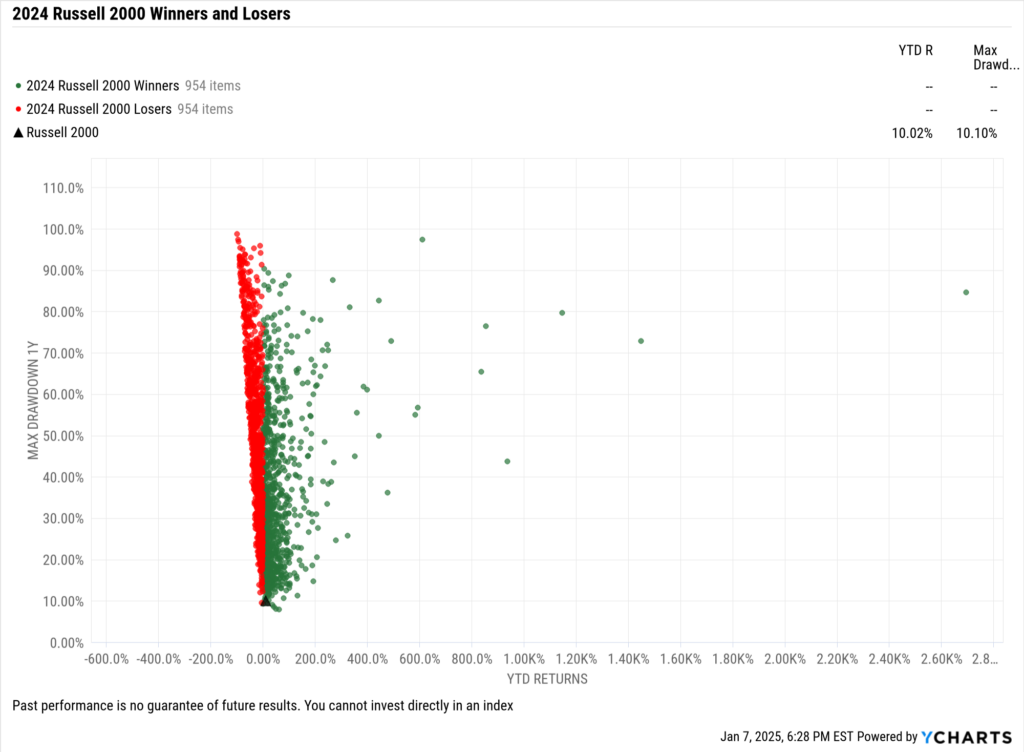
Download Visual | Modify in YCharts
Whenever you’re ready, there are 3 ways YCharts can help you:
1. Looking for a best-in-class data & visualization tool?
Send us an email at hello@ycharts.com or call (866) 965-7552. You’ll be directly in touch with one of our Chicago-based team members.
2. Want to test out YCharts for free?
Start a no-risk 7-Day Free Trial.
3. Download a copy of The Top 10 Visuals for Client and Prospect Meetings slide deck:
Disclaimer
©2025 YCharts, Inc. All Rights Reserved. YCharts, Inc. (“YCharts”) is not registered with the U.S. Securities and Exchange Commission (or with the securities regulatory authority or body of any state or any other jurisdiction) as an investment adviser, broker-dealer or in any other capacity, and does not purport to provide investment advice or make investment recommendations. This report has been generated through application of the analytical tools and data provided through ycharts.com and is intended solely to assist you or your investment or other adviser(s) in conducting investment research. You should not construe this report as an offer to buy or sell, as a solicitation of an offer to buy or sell, or as a recommendation to buy, sell, hold or trade, any security or other financial instrument. For further information regarding your use of this report, please go to: ycharts.com/about/disclosure
Next Article
Monthly Market Wrap: December 2024Read More →