TLT Plunges Despite Fed Rate Cut Expectations: What’s Driving Bond Market Volatility?
Introduction: A Counterintuitive Collapse
On April 7, 2025, the iShares 20+ Year Treasury Bond ETF (TLT) posted its worst single-day performance in over a year, dropping more than 3.02% and marking its second-largest single-day decline in the past three years. The move has left many advisors and institutional investors perplexed—especially amid a macro backdrop dominated by rate cut forecasts and a growing consensus that the U.S. is headed toward recession.
Bond yields surged across the curve, with the 10-Year Treasury yield climbing 18 basis points to 4.49%—even as Fed Funds Futures continue to price in multiple rate cuts before year-end.
This piece breaks down the drivers of the TLT decline, the disconnect between expectations and reality in the bond market, and the implications for portfolio construction and advisor strategy.
Chart Spotlight: TLT’s April 10 Drawdown in Context
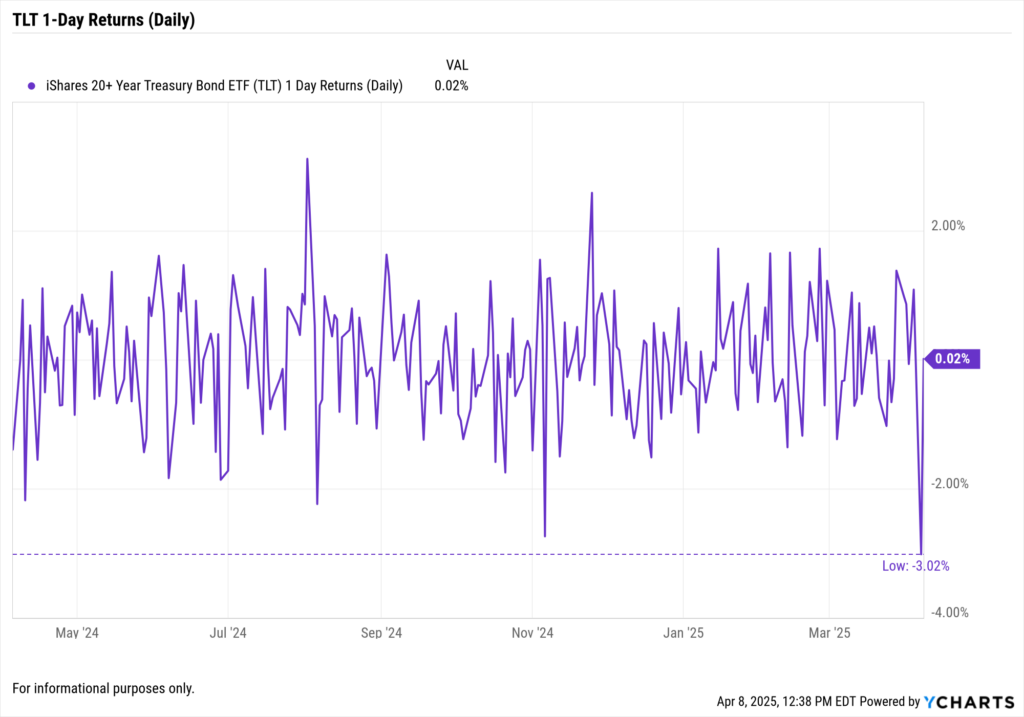
Over the past 12 months, TLT has struggled to find consistent footing. While short-lived rallies emerged during periods of dovish policy expectations, the ETF has ultimately remained in a long-term downtrend—underscoring the bond market’s sensitivity to shifting macro signals, inflation pressures, and rate uncertainty.
The most recent 3%+ single-day drop only deepens the longer-term drawdown narrative, making TLT’s risk profile more pronounced despite its traditionally defensive label.
TLT vs. 10-year Treasury Yield
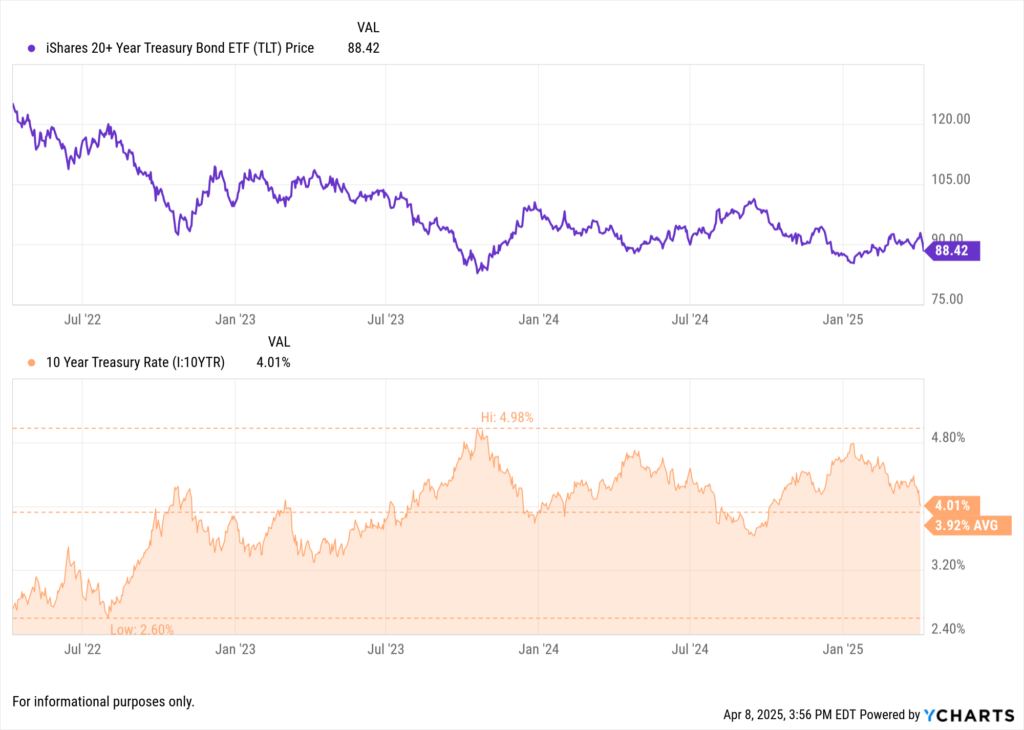
This comparative view illustrates the inverse relationship between long-term Treasury yields and TLT price movements. While yields have surged on rising inflation expectations and global selling pressure, TLT has mirrored the move in reverse.
Despite consensus around future rate cuts, the chart highlights how bond prices—and duration-heavy ETFs—can move counter to conventional rate narratives when structural and geopolitical forces override monetary outlooks.
The Disconnect: Rate Cuts Are Coming, So Why Is TLT Falling?
Traditionally, long-duration Treasury ETFs like TLT rise when interest rates are expected to fall. But on April 10, the bond market bucked that logic.
Key Market Observations:
Fed Expectations Remain Dovish:
The CME FedWatch Tool still shows a 70%+ probability of a rate cut by July, and three cuts by year-end remain priced in.
Recession Probability Climbing:
The New York Fed’s recession probability model now sits at 66.4% for the next 12 months, the highest since 2008.
Yet Yields Rose Sharply:
The 10-year and 30-year Treasury yields both spiked, steepening the yield curve rather than flattening it.
So what’s going on?
4 Factors Behind the TLT Selloff
1. Foreign Selling of Treasuries
Reports from the Treasury Department show elevated foreign outflows from U.S. bonds, particularly from Japan and China, whose central banks may be managing currency volatility and internal capital needs.
This forced selling can overwhelm rate expectations in the short term.
2. Inflation Resilience
While headline inflation has trended downward in recent months, core inflation and services-related pricing pressures remain elevated, contributing to uncertainty around the Fed’s next move. The market is now closely watching the March CPI report, which will be released by the Bureau of Labor Statistics on April 10, 2025.
Economists surveyed by Bloomberg expect:
Headline CPI: 3.2% YoY
Core CPI: 3.7% YoY
Although inflation has eased from its 2022 highs, sticky categories such as shelter, transportation services, and medical care have proven more persistent. This has led some market participants to temper expectations for aggressive rate cuts, even as growth forecasts weaken and recession probabilities rise.
“If core inflation doesn’t continue to decline, the Fed may have less room to maneuver than futures markets are currently pricing in,” said Ethan Harris, former head of global economics at Bank of America.
Until more clarity emerges from the inflation data, the Treasury market may remain vulnerable to sharp repricings—as evidenced by TLT’s recent selloff despite broad consensus around Fed easing later this year.
3. Supply Overhang
The U.S. Treasury has increased long-duration issuance to fund growing deficits. This increased supply of 20- and 30-year bonds puts technical pressure on prices, especially if demand is weak.
4. Positioning & Duration Crowding
TLT has become a crowded trade among investors anticipating rate cuts. When positioning is one-sided, sharp reversals tend to happen—especially if data surprises or global flows shift.
Performance Context: TLT in Historical Perspective
| Period | Return (%) |
|---|---|
| 1-Day (April 7) | -3.05% |
| 1-Week | -5.4% |
| YTD (2025) | -7.2% |
| Since Jan 2022 Peak | -43.6% |
TLT has now lost nearly half its value since January 2022, reflecting the depth of pain in long-duration fixed income since the Fed’s hiking cycle began.
Implications for Advisors and Asset Managers
1. Duration Risk Remains Elevated
Even with rate cuts on the horizon, long-duration bond exposure carries convexity risk—i.e., the sensitivity to yield changes increases with each additional basis point.
Use YCharts Fundamental Charts to visualize portfolio duration across bond holdings and ETFs.
2. Clients Expect Bonds to Be Safe
A 3–5% drawdown in a Treasury ETF can spook conservative clients. Use this moment to re-educate around the trade-offs of duration, yield, and price risk.
Use YCharts Custom Reports to show real-time return vs. risk scenarios for income-focused clients.
3. Reevaluate the Role of TLT
TLT may still play a role as a hedge—but only if paired with offsetting exposure or used tactically.
Use the Holdings Overlap Tool to assess whether clients are overexposed to long-duration via target-date funds, 60/40 models, or bond ETFs.
What to Watch Next
Earnings & Fed Communications
April 17: Fed Beige Book
April 30: Q1 GDP print
May 6-7: Next FOMC meeting
Key Indicators
Breakeven inflation rates
Treasury auction demand and bid-to-cover ratios
Corporate bond spreads
Use a YCharts Dashboard to track yield curves, duration spreads, and ETF flows daily.
Conclusion: Don’t Fight the Curve
The April 7 drawdown in TLT is a clear reminder that rate expectations alone don’t drive bond performance. Positioning, global flows, and inflation data all interact to create surprising outcomes.
For advisors, this moment presents a chance to revisit assumptions around bond safety, use of duration, and the appropriate role of Treasury ETFs in today’s portfolios.
Use YCharts to analyze risks, visualize alternatives, and communicate clearly in a market that’s anything but.
Whenever you’re ready, here’s how YCharts can help you:
1. Looking to Move On From Your Investment Research and Analytics Platform?
2. Want to test out YCharts for free?
Start a no-risk 7-Day Free Trial.
Disclaimer
©2025 YCharts, Inc. All Rights Reserved. YCharts, Inc. (“YCharts”) is not registered with the U.S. Securities and Exchange Commission (or with the securities regulatory authority or body of any state or any other jurisdiction) as an investment adviser, broker-dealer or in any other capacity, and does not purport to provide investment advice or make investment recommendations. This report has been generated through application of the analytical tools and data provided through ycharts.com and is intended solely to assist you or your investment or other adviser(s) in conducting investment research. You should not construe this report as an offer to buy or sell, as a solicitation of an offer to buy or sell, or as a recommendation to buy, sell, hold or trade, any security or other financial instrument. For further information regarding your use of this report, please go to: ycharts.com/about/disclosure
Next Article
Day 1 of Trump Tariffs: Market Reactions and What Advisors Need to WatchRead More →