Transform Portfolio Discussions with YCharts’ Interactive Analysis Tool

The 2022 SEC Marketing Rule reshaped how financial advisors communicate with clients about portfolios, risk, and potential outcomes. As firms navigated the changes, many advisors were left with restricted options when creating proposals and reports that included hypothetical performance.
However, there’s a key carveout that provides a compliant way for advisors to share performance insights in one-on-one meetings: Interactive Analysis Tools.
These tools allow advisors to present hypothetical performance data in compliance with the rule, making them a potential game-changer for personalized client interactions.
The Power of Interactive Analysis Tools
Interactive Analysis Tools are explicitly excluded from the SEC’s definition of ‘hypothetical performance’ which means they can be used while remaining compliant with SEC regulations. These tools offer a dynamic, tailored experience, allowing advisors to compare potential investment strategies with a client’s existing portfolio. By presenting performance data in an interactive and engaging way, advisors can help clients better understand and visualize the potential outcomes of different investment choices.

YCharts’ Interactive Analysis Tool: A Compliance-Friendly Solution
YCharts’ Interactive Analysis Tool is designed with compliance to the SEC Marketing Rule in mind. It enables advisors to offer personalized insights based on various asset allocations and risk profiles, helping clients make more informed decisions. This compliance-friendly tool ensures that advisors can deliver an interactive experience while adhering to regulatory requirements.

Boosting Client Engagement and Collaboration
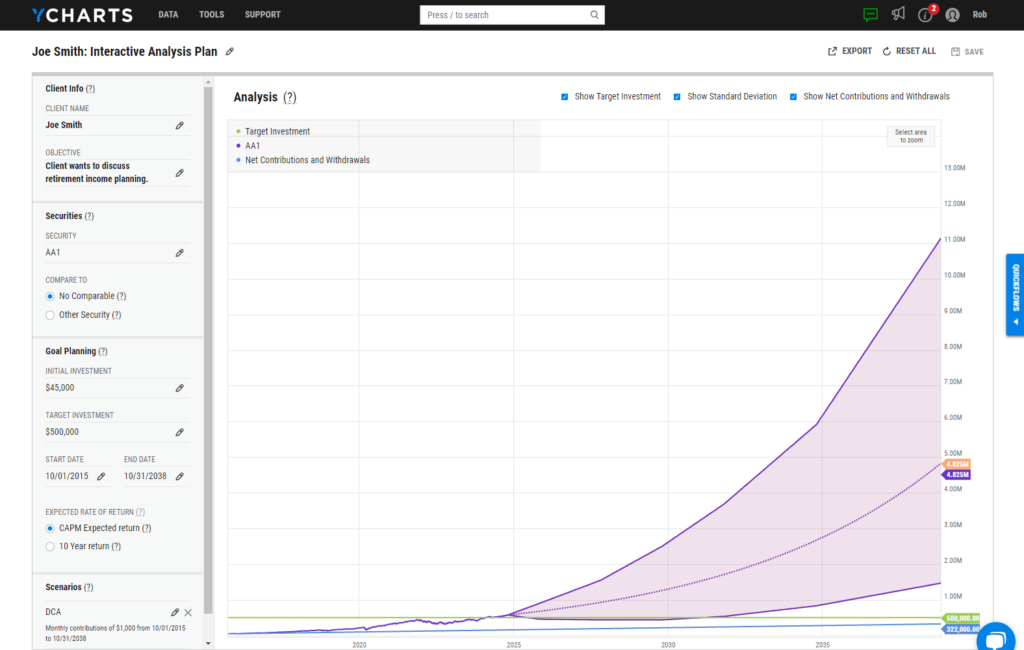
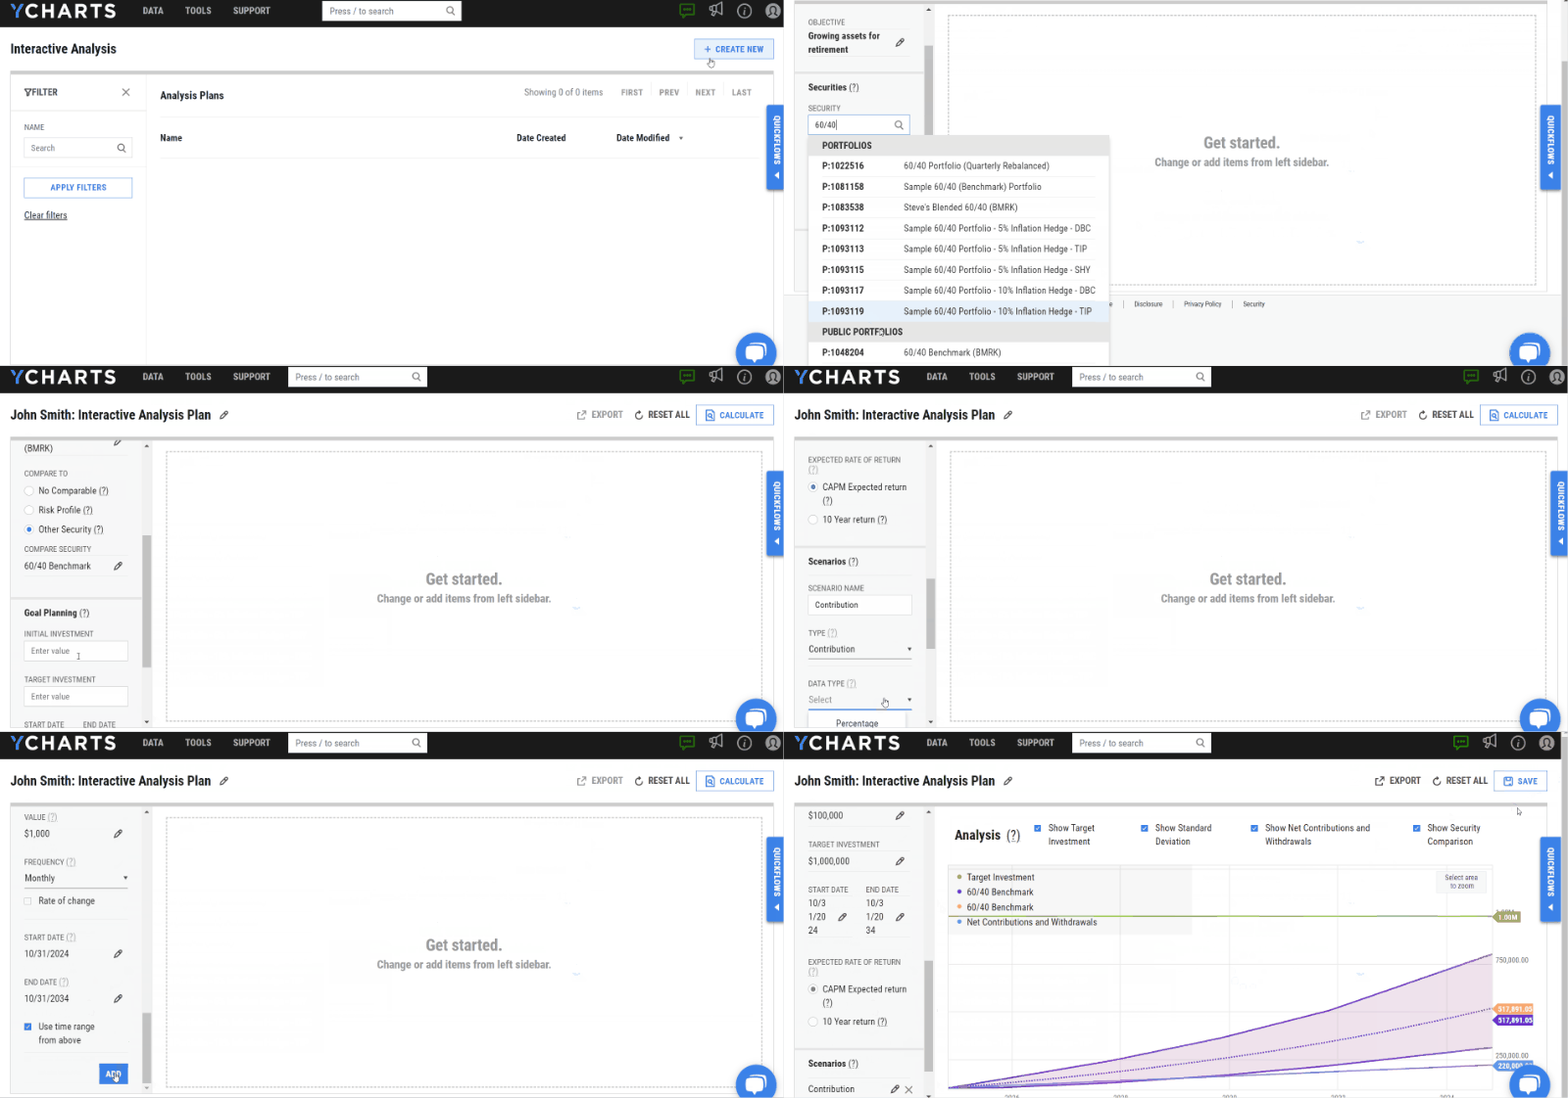
With YCharts’ Interactive Analysis Tool, advisors can actively engage with clients and prospects by incorporating hypothetical performance data into real-time discussions. Using a client’s unique information—such as financial goals, time horizon, and risk tolerance—advisors can model different scenarios and show how market changes or asset allocation adjustments could impact outcomes.
Whether adjusting for market volatility or exploring alternative strategies, this tool helps clients see the bigger picture and make more confident decisions, all while staying within regulatory boundaries.
Moving Forward with Confidence
Navigating complex regulatory requirements adds an additional layer of challenge beyond dealing with rapidly moving markets and addressing clients’ evolving needs. YCharts’ Interactive Analysis Tool provides a powerful, compliant solution.
Advisors can compare existing portfolios with potential strategies, discuss risk and performance outcomes, and generate compliant reports that include hypothetical performance data. This process seeks to create more informed investors who are better aligned with their portfolio’s approach.
For advisors seeking to stay compliant while delivering personalized, impactful insights, YCharts’ Interactive Analysis Tool is a seamless way to engage clients and demonstrate potential investment outcomes.
Whenever you’re ready, there are 3 ways YCharts can help you:
1. Looking to develop more engaged, informed clients and prospects?
Send us an email at hello@ycharts.com or call (866) 965-7552. You’ll be directly in touch with one of our Chicago-based team members.
2. Want to test out YCharts for free?
Start a no-risk 7-Day Free Trial.
3. Already a YCharts customer?
Schedule time with your support representative to walk you through this new feature and how to use it in your day-to-day.
Disclaimer
©2024 YCharts, Inc. All Rights Reserved. YCharts, Inc. (“YCharts”) is not registered with the U.S. Securities and Exchange Commission (or with the securities regulatory authority or body of any state or any other jurisdiction) as an investment adviser, broker-dealer or in any other capacity, and does not purport to provide investment advice or make investment recommendations. This report has been generated through application of the analytical tools and data provided through ycharts.com and is intended solely to assist you or your investment or other adviser(s) in conducting investment research. You should not construe this report as an offer to buy or sell, as a solicitation of an offer to buy or sell, or as a recommendation
Next Article
The 10 Best Performing Emerging Market ETFs over the Last 10 YearsRead More →
