Trump Tariffs 2025: One Week In and a 90-Day Pause – What Advisors Should Know
Data as of April 9th, 2025 @ 4PM CST
Introduction: From Escalation to Temporary Relief
It’s been just over a week since President Trump’s reciprocal tariffs went into effect on April 2, 2025—aimed at balancing trade terms with U.S. partners. The move triggered immediate volatility across equities, fixed income, and global currencies. But just as markets were bracing for further escalation, the administration announced a 90-day tariff pause on upcoming phases. However, this pause does not apply to tariffs already in effect, including those on automobiles and auto parts, steel and aluminum imports, and a wide range of general consumer goods implemented on April 2.
This combined update recaps Week 1 market responses, incorporates the most recent policy shift, and outlines what asset managers and advisors should monitor going forward.
This post serves as a companion to our Day 1 Tariff Analysis, expanding on early data and outlining what advisors and asset managers should focus on next.
>> Read our Day 1 Tariff Analysis
Week 1 Recap: Defensive Tilt, Sector Shakeouts
From April 2–9, 2025, the S&P 500 fell –3.85%, while the Nasdaq declined –2.74%, and Dow dropped –3.9%, dragged by tech, healthcare, and consumer discretionary names with broad international exposure. In contrast, small- and mid-cap indexes declined less sharply, supported by domestic-oriented sectors like utilities and energy.
Updated Sector Performance (April 2–9, 2025):
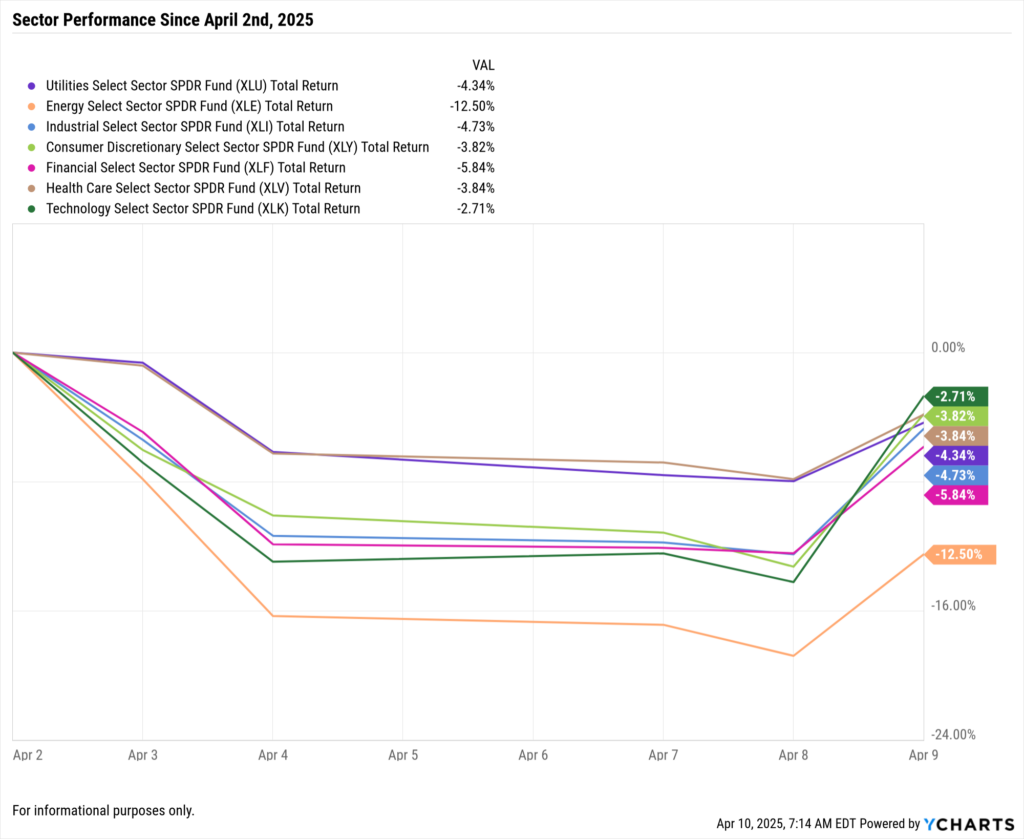

Markets react in real time—but great investment decisions often depend on stepping back. This visual deck explores the historical, cyclical, and strategic impacts of tariffs on asset classes, sectors, and economic growth.
April 9 Update: A 90-Day Tariff Pause
On April 9, the White House announced a 90-day pause on additional tariffs planned for Q2. While tariffs imposed on April 2 remain, the suspension includes:
Auto and auto part tariffs from Japan, Germany, and South Korea
Proposed duties on pharmaceutical APIs and green energy components
Retaliatory response delays from China and the EU
Markets responded with cautious optimism. Futures rebounded modestly overnight, and sectors most impacted by future tariff risk—automotive and green tech—led early gains.
What Economists Are Saying (Post-Pause)
Following the Trump administration’s 90-day tariff pause announced on April 9, 2025, economists have weighed in with a range of insights—from cautious optimism to continued skepticism.
Warnings from Leading Economists
Chris Brigati, Chief Investment Officer at SWBC, noted that while the pause reduces immediate recession fears, “the likelihood has diminished from where it was early this morning before the 90-day pause was announced.”
Diane Swonk, Chief Economist at Grant Thornton, cautioned that despite the pause, effective tariff rates have risen due to increased duties on Chinese imports, potentially peaking at 30.5%.
Nouriel Roubini, Professor of Economics at NYU, suggested that market pressures, including a sharp stock market drop and surging bond yields, forced the administration to reconsider its stance, characterizing it as a strategic retreat.
Support From Pro-Tariff Economists
While most economists remain critical, a small but vocal group of trade policy advocates and administration-aligned economists support the approach:
Bill Ackman, CEO of Pershing Square Capital Management, praised the administration’s approach, stating that the immediate implementation of tariffs allowed global stakeholders to experience the economic impact, thereby motivating international trade partners to renegotiate deals.
David Sacks, venture capitalist, expressed strong support, proclaiming that the tariff strategy vindicated the administration and successfully isolated China in trade negotiations.
These insights reflect the diverse economic opinions following the tariff pause announcement, highlighting both concerns and endorsements of the administration’s trade policies.
Currencies & Commodities: Early Shifts in Flight
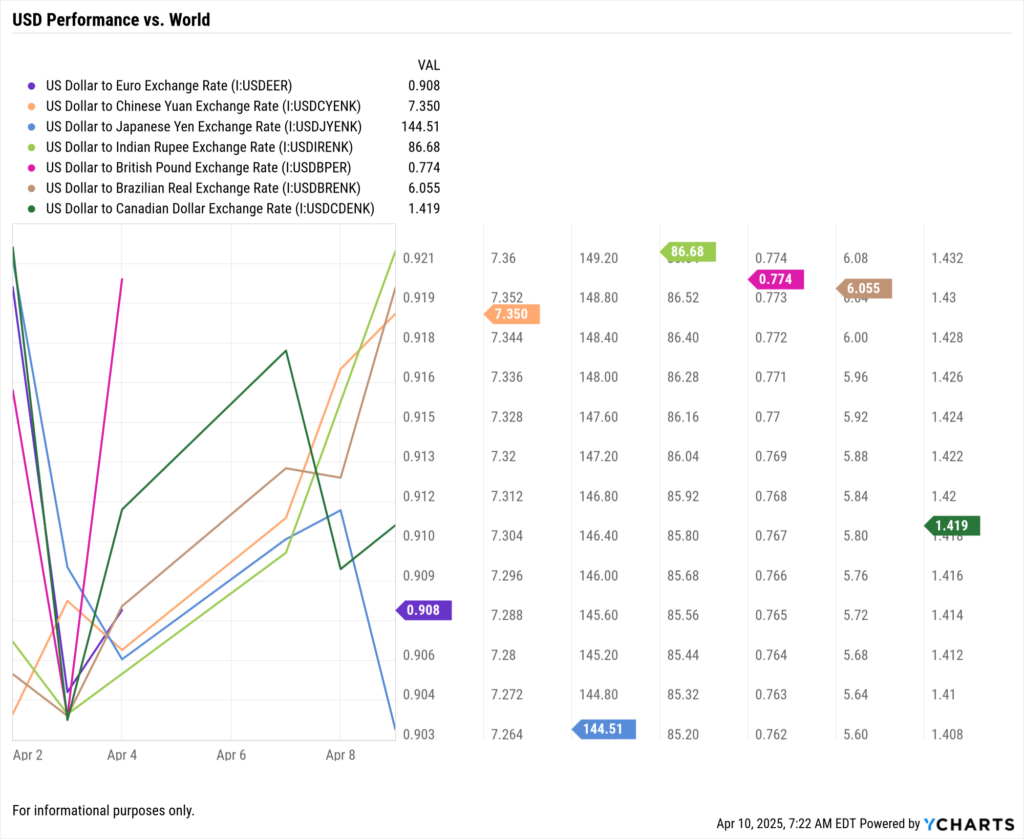
USD Performance (April 2–9, 2025):
Commodity Futures Moves (April 2-9, 2025):
Advisor Takeaways: Key Strategic Themes Emerging
1. Use This Window for Rebalancing
The pause offers a moment to reassess exposure to trade-sensitive assets and sectors.
Use YCharts’ Holdings Overlap Tool to detect over-concentration in semis, auto, and luxury consumer segments.
2. Stay Ahead of Earnings Adjustments
Guidance revisions for Q2 may reflect supply cost recalibrations.
Use Scenario & Stress Testing to simulate 20–30% COGS increases or FX-driven earnings headwinds.
3. Plan for Binary Policy Outcomes
The 90-day pause may resolve or re-escalate—advisors need client-ready action plans for both.
Use Custom Reports to outline best/worst-case scenarios and recommended sector positioning.
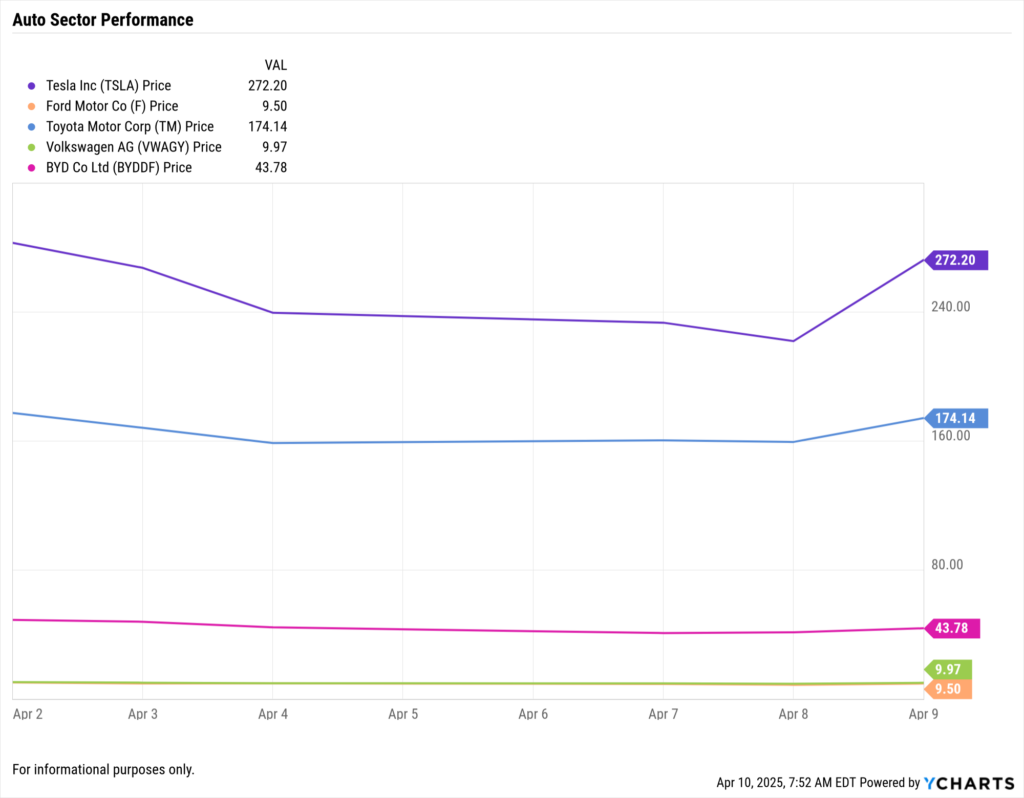
Case Study: Auto Sector as a Bellwether
As of April 3, a 25% tariff now applies to imported autos and components from Germany, Japan, and South Korea. Since then:
Toyota (TM) is down -1.8%
Ford (F) is down -6.62%
BYD (BYDDF) is down -8.63%
Tesla (TSLA) is down -1.9%
Volkswagen (VWAGY) is down -4.32%
How YCharts Helps You Navigate Uncertainty
Custom Reports: Build client-ready summaries highlighting international risk, sector positioning, and exposure adjustments.
Fundamental Charts: Visualize margin impact, supply chain costs, and revenue by region.
Economic Indicators: Stay ahead of global shifts—watch exports, PMI trends, FX volatility, and commodity indexes.
Looking Ahead: Key Dates for Advisors
April 15: Q1 earnings season begins
July 10: End of the 90-day tariff pause
Anytime: Possible retaliatory tariffs from China, EU, or Mexico
Conclusion: Week 1 Confirms the Stakes
The 90-day tariff pause has reset short-term market risk, but the underlying trade dynamics remain unresolved. For advisors, this is a window to assess exposure, reinforce positioning, and lead clients through uncertainty with confidence.
Whenever you’re ready, here’s how YCharts can help you:
1. Looking to Move On From Your Investment Research and Analytics Platform?
2. Want to test out YCharts for free?
Start a no-risk 7-Day Free Trial.
Disclaimer
©2025 YCharts, Inc. All Rights Reserved. YCharts, Inc. (“YCharts”) is not registered with the U.S. Securities and Exchange Commission (or with the securities regulatory authority or body of any state or any other jurisdiction) as an investment adviser, broker-dealer or in any other capacity, and does not purport to provide investment advice or make investment recommendations. This report has been generated through application of the analytical tools and data provided through ycharts.com and is intended solely to assist you or your investment or other adviser(s) in conducting investment research. You should not construe this report as an offer to buy or sell, as a solicitation of an offer to buy or sell, or as a recommendation to buy, sell, hold or trade, any security or other financial instrument. For further information regarding your use of this report, please go to: ycharts.com/about/disclosure
Next Article
TLT Plunges Despite Fed Rate Cut Expectations: What’s Driving Bond Market Volatility?Read More →