U.S.–China 90-Day Tariff Pause: Market Relief or Temporary Truce?
Introduction: A Surprising Pause in a Global Trade Standoff
Over the weekend, U.S. and Chinese negotiators reached a surprising yet cautiously welcomed agreement in Geneva: a 90-day tariff pause. This move—marked by substantial reciprocal reductions in punitive tariffs—offers a brief reprieve in an escalating trade conflict that’s shaken global markets.
For financial professionals, this temporary truce is not just a headline—it’s a critical opportunity to reexamine exposure to impacted sectors and realign portfolio strategy accordingly.
Read here for a deeper dive into the US Tariff Countdown and how Copper and USD to JPY are reacting to the deadline on July 9, 2025.
Stocks Benefiting from the US-China Tariff Pause
The announcement of a 90-day tariff pause between the US and China has had an immediate positive impact on the stock market. Key sectors such as technology, retail, and shipping have seen significant gains as investors anticipate reduced costs and improved trade flows.
Top Gainers Since Market Open:
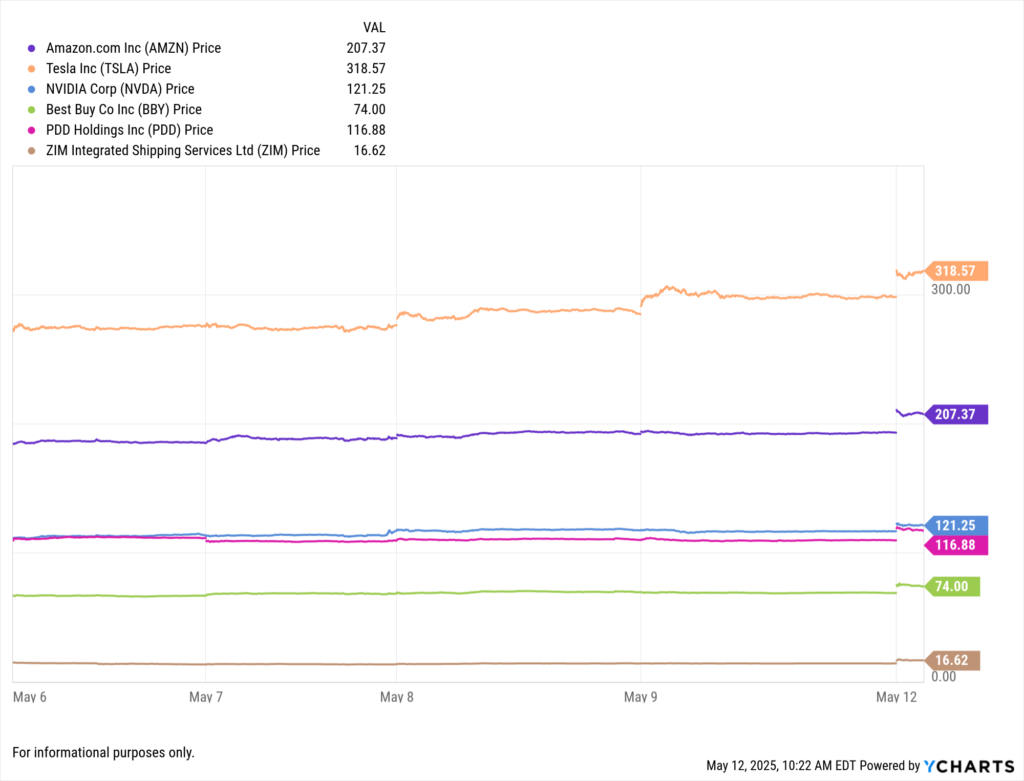
- Amazon (AMZN): Shares surged by 8.2%, reflecting optimism about reduced import costs and improved consumer sentiment.
- Tesla (TSLA): Stock rose 7.6%, benefiting from eased tariffs on Chinese components critical to its supply chain.
- Nvidia (NVDA): Experienced a 4.6% increase, as the semiconductor sector anticipates smoother trade relations.
- Best Buy (BBY): Shares climbed 9.1%, likely due to expectations of lower costs for electronics sourced from China.
- PDD Holdings (PDD): The Chinese e-commerce company saw an 8.5% rise, indicating investor confidence in cross-border trade stability.
- ZIM Integrated Shipping Services Ltd (ZIM): Stock jumped 15%, as shipping companies are poised to benefit from increased trade volumes.
These movements underscore the market’s sensitivity to international trade policies and highlight sectors that are directly influenced by tariff changes.
Data-Driven Market Reaction: Temporary Relief, But Not Resolution
As news of the agreement spread, markets responded swiftly:
• U.S. Tariffs on Chinese Goods: Temporarily reduced from 145% to 30%
• Chinese Tariffs on U.S. Goods: Rolled back from 125% to 10%
These 115-point rollbacks on both sides provided near-immediate relief to several equity sectors:
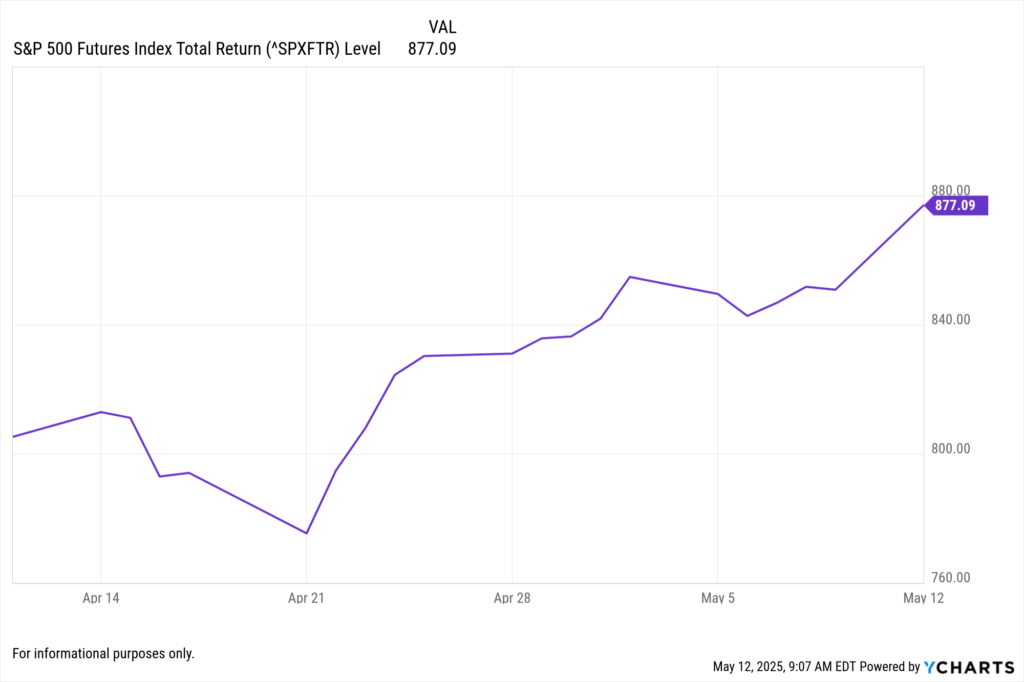
• S&P 500 Futures: Rose as much as 3.5%
• WTI Crude Oil: Rebounded to $62.68/barrel
• USD Index (DXY): Strengthened amid renewed trade optimism
The rebound reflects investor expectations of lower import costs, supply chain normalization, and a shift in consumer and corporate sentiment, albeit temporarily.
Sector Impact Overview: Who Gains from the 90-Day Pause?
This temporary truce has implications across multiple sectors. Using YCharts, financial professionals can analyze the relative performance of affected industries using sector ETFs, revenue breakdowns, and supply chain exposure.
Technology & Electronics (XLK)
• High tariffs on Chinese electronics previously elevated costs for U.S. tech firms.
• The pause may reduce component costs and margin pressures.
• Use YCharts: Compare gross margins and import reliance of top semiconductor and electronics firms.
Agriculture (MOO)
• China’s tariffs on soybeans and pork heavily impacted U.S. agriculture exports.
• With tariffs lowered, export volume may rebound.
• Use YCharts: Track commodity price trends and monitor USDA export volume indicators.
Industrials & Manufacturing (XLI)
• Tariff-related disruptions in component imports and finished goods exports squeezed industrial margins.
• The pause offers potential breathing room for OEMs and multinational manufacturers.
• Use YCharts: Evaluate revenue growth trends and exposure to Chinese trade across industrial firms.
Consumer Goods & Retail (XRT, XLY)
• High tariffs raised input costs on apparel, toys, and home goods.
• Lowered tariffs may ease price pressures—a potential tailwind for retailers.
• Use YCharts: Monitor earnings revisions and forward P/E ratios for major consumer discretionary companies.
Use Cases for Advisors & Asset Managers
1. Portfolio Realignment During Volatility Windows
• Use the tariff pause to revisit exposure to sectors directly tied to U.S.–China trade flows.
• Consider rotating into companies that benefit from lower input costs or expanded export opportunities.
2. Client Communication & Behavioral Finance
• Explain the temporary nature of this policy window to avoid overreaction.
• Use YCharts visuals (e.g., historical tariff-related volatility) in client meetings.
3. Short-Term vs Long-Term Trade Positioning
• While short-term relief is evident, structural uncertainty persists.
• Position clients for both upside participation and downside protection with scenario testing.
How YCharts Can Help
YCharts empowers financial professionals with tools to visualize, quantify, and communicate the potential impacts of this 90-day tariff suspension:
Fundamental Charts: Compare margin recovery, revenue trends, and sector rebounds following tariff rollbacks
➝ Explore Fundamental Charts
Economic Indicators: Track U.S.–China export volumes, PMI trends, and agricultural trade data
➝ View Economic Indicators
Scenario & Stress Testing: Model the impact of re-escalation or permanent rollback scenarios across portfolios
➝ View Scenarios
Custom Reports: Visualize sector or company-level shifts tied to trade policy changes in client-ready formats
➝ Build a Custom Report
Conclusion: A Pause, Not a Pivot
The U.S.–China 90-day tariff pause is not a resolution—but it is a window of opportunity. Markets are pricing in optimism, sectors are reacting, and investors are repositioning. For financial advisors and asset managers, this moment underscores the importance of data-driven insights and strategic flexibility.
With YCharts, professionals can analyze the sectors, quantify the risks, and guide clients through this ever-shifting trade environment—armed with the clarity that only deep, actionable data provides.
Whenever you’re ready, here’s how YCharts can help you:
1. Looking to Move On From Your Investment Research and Analytics Platform?
2. Want to test out YCharts for free?
Start a no-risk 7-Day Free Trial.
Disclaimer
©2025 YCharts, Inc. All Rights Reserved. YCharts, Inc. (“YCharts”) is not registered with the U.S. Securities and Exchange Commission (or with the securities regulatory authority or body of any state or any other jurisdiction) as an investment adviser, broker-dealer or in any other capacity, and does not purport to provide investment advice or make investment recommendations. This report has been generated through application of the analytical tools and data provided through ycharts.com and is intended solely to assist you or your investment or other adviser(s) in conducting investment research. You should not construe this report as an offer to buy or sell, as a solicitation of an offer to buy or sell, or as a recommendation to buy, sell, hold or trade, any security or other financial instrument. For further information regarding your use of this report, please go to: ycharts.com/about/disclosure
Next Article
Trump’s US-UK Trade Deal: Sector Impacts, Key Companies, and Portfolio StrategyRead More →