Upcoming U.S. Labor Market Report: Preparing Client Portfolios

After years of resilience, the U.S. labor market is beginning to show measurable signs of cooling—prompting many advisors to rethink portfolio strategies for the remainder of 2025. From softer ADP payroll data to increasing jobless claims, the narrative around economic resilience is shifting. Meanwhile, trade-related uncertainties, including renewed tariffs discussions, may complicate the path forward for both domestic and international equities. As the Federal Reserve watches these labor indicators closely, advisors must position portfolios to withstand both volatility and opportunity.
This blog will cover:
- • Recent labor market indicators and how they’ve shifted in the last 12–24 hours
- • The implications of labor cooling on Fed policy and rates
- • Strategic moves for portfolios as wage growth and employment soften
- • The effect of tariffs and trade policy uncertainty on asset allocation
- • How to use YCharts tools to analyze labor data and sector performance
U.S. Labor Market: The Latest Signs of Cooling
In the last 12 hours, multiple data points have signaled that the red-hot labor market may be losing steam. Most notably, yesterday’s ADP private payroll report showed a gain of just 152,000 jobs in May—well below expectations of 175,000. US Initial Claims for Unemployment Insurance (I:USICUI) also rose slightly to 247,000, marking the third week of increases. While still relatively healthy by historical standards, these trends hint at softening demand for labor.
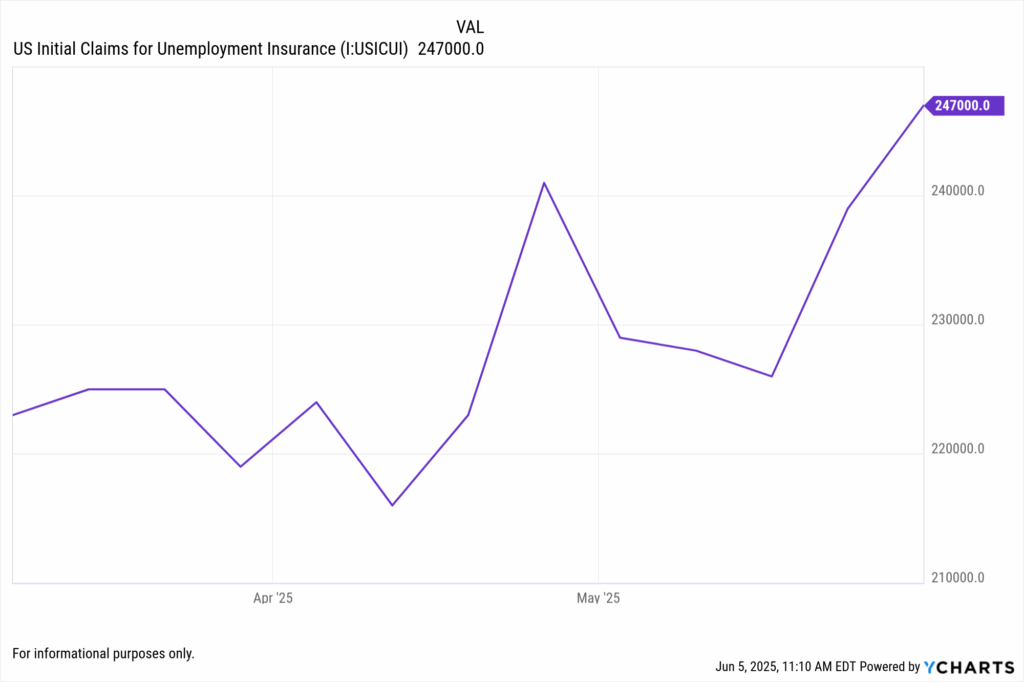
Further, several large employers including Amazon and Morgan Stanley have recently announced targeted hiring slowdowns or job cuts, signaling shifting corporate sentiment. If this continues, it could pressure consumer spending and potentially increase recession risks in Q3 or Q4.
Market Reaction: Gold Holds Firm, Yen Weakens on Dollar Strength
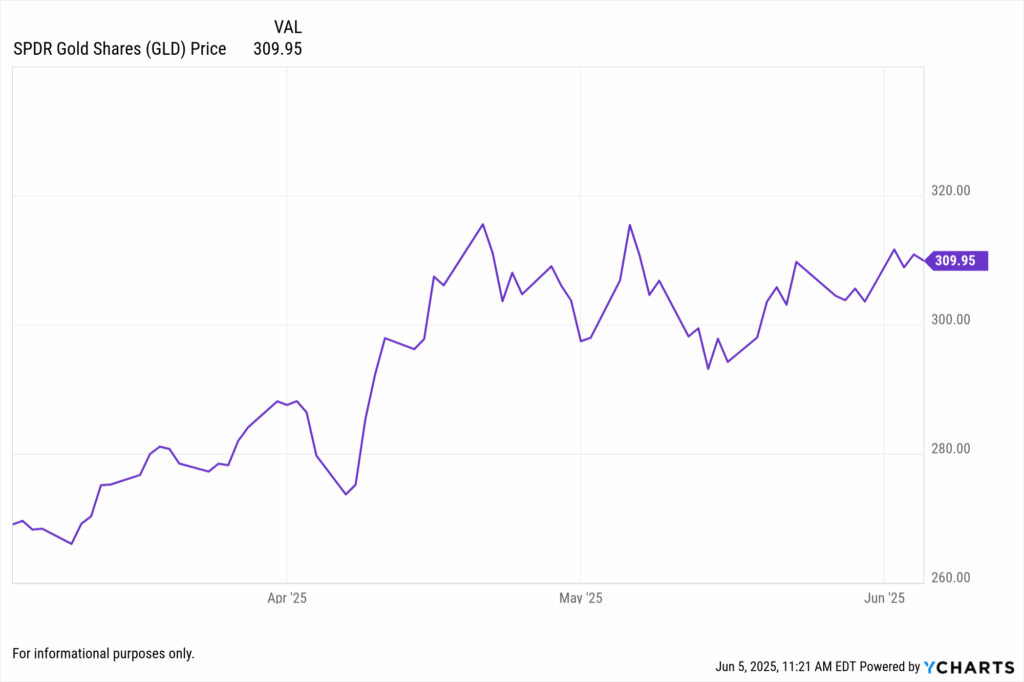
As labor data trends weaker, asset classes are responding accordingly. SPDR Gold Shares (GLD) have remained relatively stable, hovering near $310 as of this morning. The yellow metal continues to serve as a hedge against uncertainty—especially as markets grow cautious about growth prospects and rate volatility.
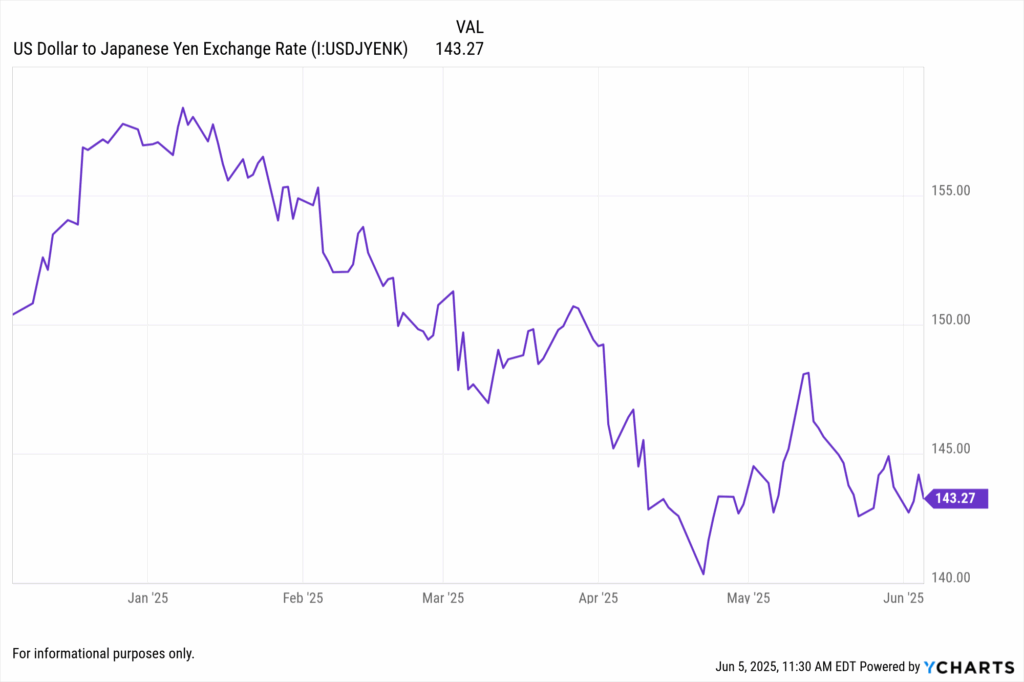
Meanwhile, the Japanese yen has strengthened notably in recent months, with the USD/JPY exchange rate falling to around 143.27 as of June 5, 2025. This decline reflects a weaker U.S. dollar, despite persistent rate volatility and mixed macro signals. The move suggests investors may be seeking relative safety in the yen, particularly as uncertainty around U.S. labor data and potential Fed rate cuts grows. While the Bank of Japan maintains its policy stance, currency markets remain tightly linked to global rate expectations and economic data surprises.
These cross-asset signals further reinforce the idea that advisors need to monitor macro trends closely—and adjust allocations in real time as the economic picture evolves.
Portfolio Strategy: What Advisors Should Consider Now
For financial advisors managing client portfolios, a cooling labor market isn’t inherently bad—but it does change the calculus. Here are several tactical and strategic considerations:
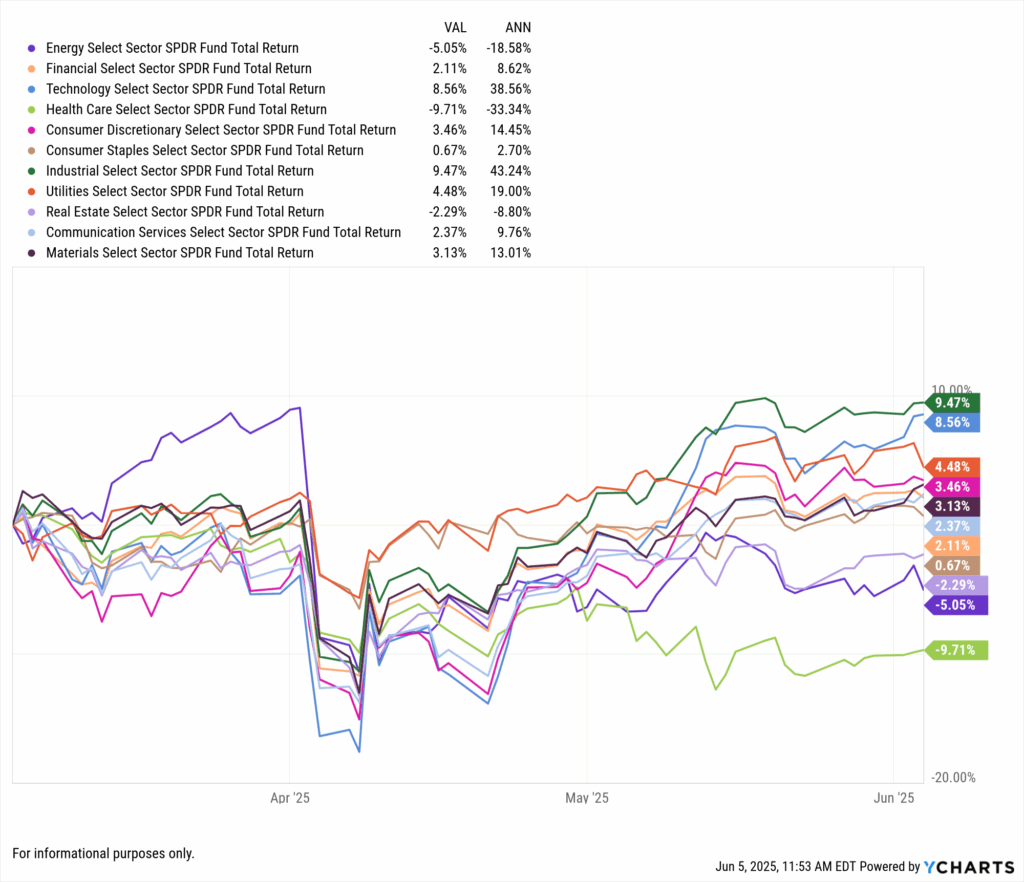
- Review interest-rate sensitive sectors: Sectors like financials, real estate, and utilities tend to respond to changing rate expectations. YCharts’ Sector ETF Performance Chart uses liquid ETFs as proxies and lets you compare sector returns over year-to-date, 1-year, or custom timeframes across all major GICS sectors.
- Monitor consumer discretionary vs. staples: As job growth slows, consumer behavior may shift. Defensive sectors often perform better in softer labor environments.
- Evaluate exposure to small caps: Smaller firms tend to be more sensitive to wage and employment shifts. Rising unemployment or wage compression could increase volatility.
- Reassess equity positioning under a rising tariff environment: Election-season rhetoric around trade and tariffs—particularly related to China and EVs—has returned. These could affect multinational exposure or manufacturing-heavy funds.
- Use real-time labor indicators: YCharts offers dozens of economic indicators including job openings, quit rates, and unemployment by demographic. Use these to layer in macro context for client reviews or model adjustments.
Using YCharts to Track Labor Trends and Adjust Allocations
YCharts equips advisors with a range of data visualizations and tools to stay ahead of macro shifts:
1. Unemployment Rate Time Series Chart
- Use case: Track the national unemployment trend and overlay with recession markers or Fed rate decisions.
3. Sector Performance Comparison
- Use case: View which sectors are outperforming as labor data cools—especially utilities, staples, and health care.
4. Inflation + Labor Composite Dashboard
- Use case: A one-page view of CPI, PCE, wage growth, and unemployment—ideal for client presentations.
5. Tariff Impact Tracker (Custom Watchlist)
- Use case: Build a watchlist of ETFs or companies most affected by U.S.–China trade tensions.
Why This Matters for Advisors Right Now
The convergence of weakening labor metrics, persistent inflation, and revived tariff debates creates a more complex environment than we’ve seen since 2021. Advisors should consider:
- • Reposition portfolios for late-cycle dynamics
- • Communicate economic shifts to clients proactively
- • Prepare for potential volatility triggered by Fed policy or geopolitical headlines
Fortunately, with YCharts’ visual tools, economic dashboards, and screening capabilities, advisors can stay ahead of the curve.
For more macro guidance, you may also want to read:
• Safe Haven Surge Amid Tariff Turmoil: Gold (GLD) and Yen as Portfolio Shields
• Trade War Escalation in 2025: Portfolio Moves Amid Trump’s Tariff Threats
• How Treasury Yields Are Influencing Crypto and What Advisors Need to Know
Conclusion: Navigating Labor Shifts with Confidence
The recent softening in labor market data presents both challenges and opportunities for advisors guiding clients through a late-cycle economy. Slower job growth, rising unemployment claims, and the re-emergence of tariff concerns add complexity to asset allocation decisions in 2025. But with volatility comes the chance to differentiate: by staying attuned to macro trends and positioning portfolios accordingly, advisors can help clients remain resilient.
YCharts provides the tools to visualize economic changes in real time, screen for defensive sectors, and evaluate the portfolio impact of evolving policy risks like tariffs and interest rates. With a proactive approach and data-backed insights, advisors are well-equipped to make informed decisions in a cooling labor environment.
Whenever you’re ready, here’s how YCharts can help you:
1. Looking to Move On From Your Investment Research and Analytics Platform?
2. Want to test out YCharts for free?
Start a no-risk 7-Day Free Trial.
Disclaimer
©2025 YCharts, Inc. All Rights Reserved. YCharts, Inc. (“YCharts”) is not registered with the U.S. Securities and Exchange Commission (or with the securities regulatory authority or body of any state or any other jurisdiction) as an investment adviser, broker-dealer or in any other capacity, and does not purport to provide investment advice or make investment recommendations. This report has been generated through application of the analytical tools and data provided through ycharts.com and is intended solely to assist you or your investment or other adviser(s) in conducting investment research. You should not construe this report as an offer to buy or sell, as a solicitation of an offer to buy or sell, or as a recommendation to buy, sell, hold or trade, any security or other financial instrument. For further information regarding your use of this report, please go to: ycharts.com/about/disclosure
Next Article
Safe Haven Surge Amid Tariff Turmoil: Gold (GLD) and Yen as Portfolio ShieldsRead More →