Understanding the US Unemployment Rate: Current Trends and Implications | YCharts Report
The US Unemployment Rate is a critical economic indicator, reflecting the percentage of the labor force that is jobless and actively seeking employment. This statistic not only highlights the health of the labor market but also serves as a barometer for the broader economy, influencing policy decisions, business strategies, and investment plans. Understanding the dynamics of the unemployment rate is essential for stakeholders across various sectors.
The U.S. Bureau of Labor Statistics releases this information monthly as part of the Current Employment Statistics (CES) program, which provides estimates of nonfarm employment, hours, and earnings of workers on payrolls for all 50 states, the District of Columbia, and other US territories and divisions.
Latest Data Release
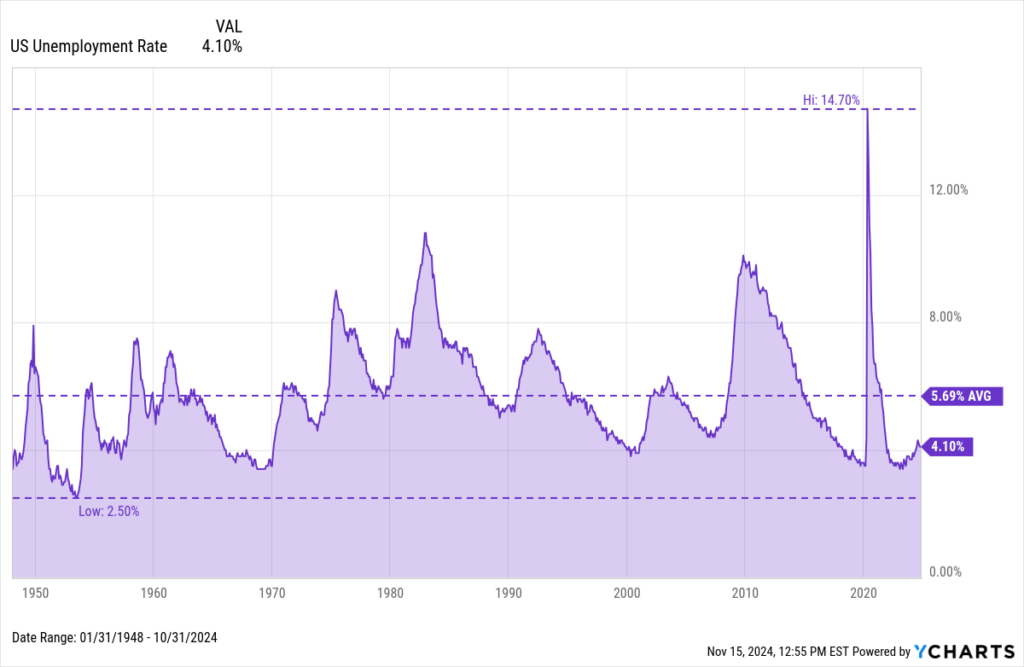
The latest data on the US Unemployment Rate provides a snapshot of the current economic impact of unemployment. As of Friday, November 1st, 2024, the unemployment rate stands at 4.10%, unchanged from the previous month.
Download Visual | Modify in YCharts
Analysis and Insights
Over the past year, the unemployment rate has increased from 3.7% to 4.1%, reflecting the impact of the Federal Reserve’s decision to maintain high interest rates in an effort to control inflation, amongst other factors. For instance, the impact of the COVID-19 pandemic initially led to a significant spike in unemployment, reaching 14.7%, but subsequent recovery efforts and the reopening of businesses have contributed to a gradual decline. Economists have noted that the current unemployment rate is influenced by various factors, including shifts in consumer behavior, technological advancements, and global supply chain disruptions.
Access long-term US Unemployment Data on YCharts by following these simple steps:
1. Log on to YCharts.com.
2. Type “US Unemployment Rate” into the search bar from anywhere on the platform and click on the result.
3. Once on the indicator page, users can toggle the navigation bar to browse historical data on a month-by-month basis or view data in an interactive chart.
Clicking “View Full Chart” will open data in an interactive Fundamental Chart to compare against other economic indicators, such as the target Federal Funds Rate. Additionally, users can export historical data to a CSV file for offline analysis by clicking the “Export” button.
Related Financial Indicators
YCharts’ Employment Situation report contains several additional related indicators to the US Unemployment Rate and presents statistics from two major surveys, the Current Population Survey and the Current Employment Statistics Survey. In addition to the US Unemployment Rate, other indicators that may aid in performing an employment rate analysis include:
– US Average Hourly Earnings Month-over-Month
– US Average Hourly Earnings Year-over-Year
– US Labor Force Participation Rate
– US Nonfarm Payrolls Month-over-Month
– US Total Private Average Weekly Hours
– US Unemployed Looking for Full-time Work: For Less than 5 Weeks
– US Unemployment as Percent of the Labor Force & Marginally Attached
– US Unemployment Rate of the Full-time Labor Force: Men
– US Unemployment Rate of the Full-time Labor Force: Women
– US Unemployment Rate: Black or African American
– US Unemployment Rate: Hispanic or Latino
Implications for Businesses and Investors
Changes in the unemployment rate and associated labor market trends have far-reaching implications for businesses and investors:
Business Strategies: A lower unemployment rate often leads to a tighter labor market, prompting companies to enhance their business recruitment strategies and offer competitive wages to attract talent. For instance, businesses in the tech sector may increase their investment in employee training programs to bridge skill gaps.
Sectoral Impact of Unemployment: Different sectors respond uniquely to shifts in the unemployment rate. For example, retail and hospitality industries may experience increased demand for labor as consumer spending rises during economic recovery phases.
Investment Decisions: Investors closely monitor the unemployment rate to gauge economic stability and to aid in their decision-making for investment planning. A declining unemployment rate may boost investor confidence, leading to higher stock market valuations. Conversely, a rising rate could signal economic troubles, prompting a shift towards more conservative investment options.
Historical examples illustrate these dynamics. During the 2008 financial crisis, the unemployment rate surged, leading businesses to cut costs and investors to seek safe havens. In contrast, the post-2010 recovery saw declining unemployment rates, stimulating economic growth and market optimism.
YCharts Feature Highlights
Fundamental Charts
Visualize the US Unemployment Rate over time by building a Fundamental Chart. Additional economic indicators, securities, funds, and indices can be added for an enhanced visual comparison. Emphasize critical junctures with interactive annotations, static Min, Max, and Average annotation lines, as well as aesthetic additions such as custom colors or an Area Chart.
Timeseries Analysis
Import the long-term US Unemployment Rate indicator into Timeseries Analysis to conduct a thorough historical lookback across custom frequency periods. Data can be exported into CSV format for analysis in YCharts’ Excel Add-in or as a standalone file.
Dashboard
Keep a close eye on key securities or economic indicators, including the US Unemployment Rate, with YCharts’ personalized Dashboard, where users can easily track the information that matters most to them. If you’re short on time, choose from YCharts’ ready-made templates, such as the “US Economy” template, which showcases data on Employment, Consumerism, Housing, and other major US indicators.
Alerts
Users can also set Custom Alerts for the US Unemployment Rate (or other economic recovery indicators), triggered by criteria they define (e.g., % Change from Previous >= 1%). These alerts can be configured for any other security, watchlist, saved model portfolio, index, or indicator, ensuring users stay informed about significant fluctuations.
Conclusion
The latest US Unemployment Rate report offers crucial insights into the state of the labor market and the broader economy. Key takeaways include the current rate has remained unchanged at 4.1%.
Staying informed about the unemployment rate and related financial indicators is vital for making strategic decisions. Utilizing tools like YCharts can provide in-depth analysis and real-time updates, helping advisors, investors, and other wealth management professionals navigate the complexities of the economic landscape.
By regularly monitoring these metrics, businesses and investors can better anticipate financial market trends and adjust their strategies accordingly, ensuring resilience and growth in an ever-evolving economic environment.
Whenever you’re ready, there are 3 ways YCharts can help you:
1. Looking to better communicate the importance of economic events to clients?
Send us an email at hello@ycharts.com or call (866) 965-7552. You’ll be directly in touch with one of our Chicago-based team members.
2. Want to test out YCharts for free?
Start a no-risk 7-Day Free Trial.
3. Sign up to receive a copy of our latest research, “Which Asset Classes Perform Best As Inflation is Driven Lower.”
Disclaimer
©2024 YCharts, Inc. All Rights Reserved. YCharts, Inc. (“YCharts”) is not registered with the U.S. Securities and Exchange Commission (or with the securities regulatory authority or body of any state or any other jurisdiction) as an investment adviser, broker-dealer or in any other capacity, and does not purport to provide investment advice or make investment recommendations. This report has been generated through application of the analytical tools and data provided through ycharts.com and is intended solely to assist you or your investment or other adviser(s) in conducting investment research. You should not construe this report as an offer to buy or sell, as a solicitation of an offer to buy or sell, or as a recommendation
Next Article
How to Use YCharts for Portfolio Management: Step-by-Step GuideRead More →