Unlock Insights Faster with AI Chat
Financial professionals must sift through vast amounts of data to uncover meaningful insights, often juggling multiple tools, dense reports, and a constant stream of market news. According to the YCharts 2024 user feedback survey, 80% of advisors expressed interest in using AI to enhance their workflow—whether for analyzing financial data, extracting insights from SEC filings, or comparing investment products. These time-consuming tasks delay decision-making and shift focus away from high-value activities—identifying opportunities, advising clients, and refining investment strategies. As one advisor put it, “Time is our biggest commodity, so anything that gives time back to me is beneficial.”
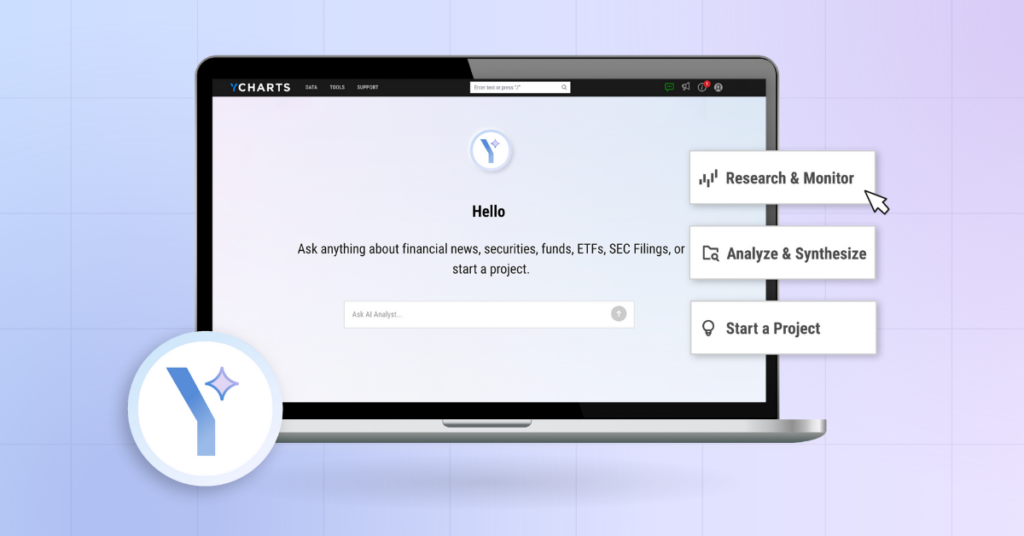
AI Chat solves this challenge by delivering instant insights from YCharts data, SEC filings, and financial news. A simple prompt returns clear, data-driven answers, helping financial professionals work more efficiently.
Recognized as a top performer in the T3/Inside Information Software Survey for “Investment Data/Analytics Tools” and “Economic Analysis & Stress Testing Tools,” YCharts continues to develop solutions that improve advisor efficiency and streamline investment research.
Smarter Investment Research, Powered by AI
AI Chat streamlines research by delivering real-time access to key financial data. By instantly retrieving historical trends, market updates, and company fundamentals, AI Chat reduces the need to manually search multiple sources. AI Chat generates tables, charts, and stock screens in seconds, freeing up time for financial professionals to focus on analysis and strategy. From there, AI Chat links directly to other tools, allowing for seamless refinement and deeper analysis. You can adjust chart settings, apply additional filters in screens, or explore a security’s historical performance in greater detail.
Enhance Research & Market Analysis
Seamlessly integrated with YCharts data, AI Chat helps advisors and asset managers analyze securities, compare investments, and track market trends. Instead of manually compiling financial data, financial professionals can generate key insights with a simple query.
For example, ask:
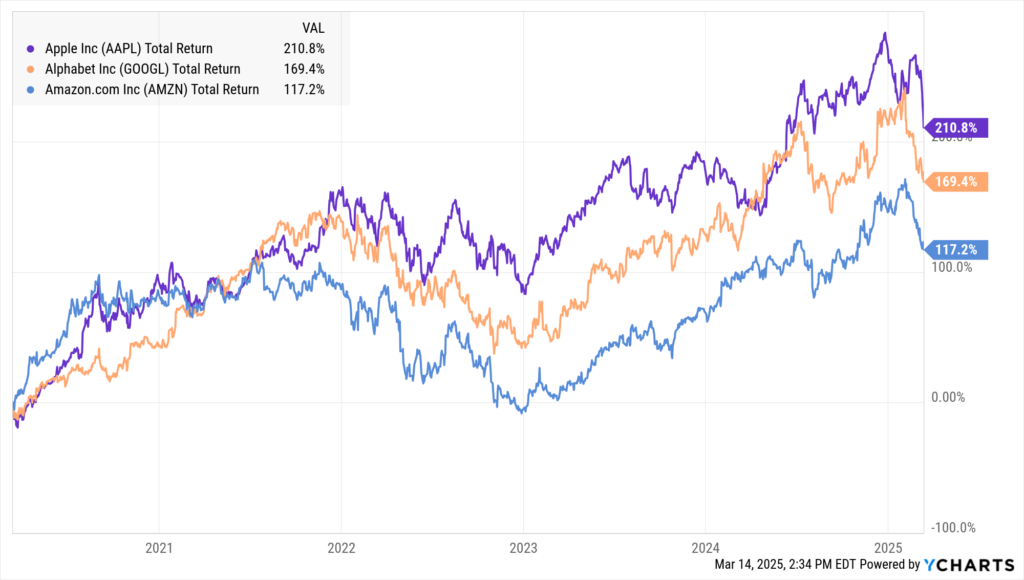
“Build a chart comparing Apple (AAPL), Google (GOOGL), and Amazon (AMZN)’s performance over the last five years.”
A linked Fundamental Chart is generated, making it easy to analyze trends and adjust settings directly in YCharts for deeper evaluation.
Looking to compare fund metrics? Quickly surface key differences:
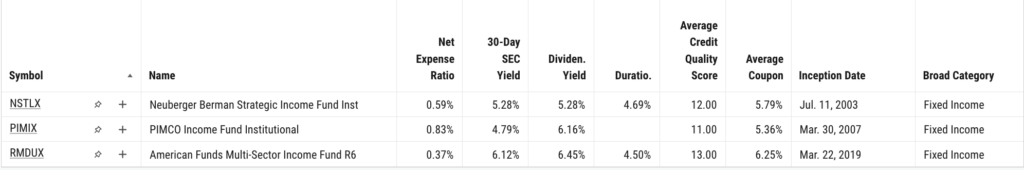
“Compare key metrics for RMDUX, NSTLX, and PIMIX.”
AI Chat provides a structured breakdown of key metrics—Net Expense Ratio, 30-Day SEC Yield, Dividend Yield, and Credit Quality—helping professionals compare funds at a glance. For further analysis, view the Comparison Table.
For screening, quickly identify securities that meet specific criteria:
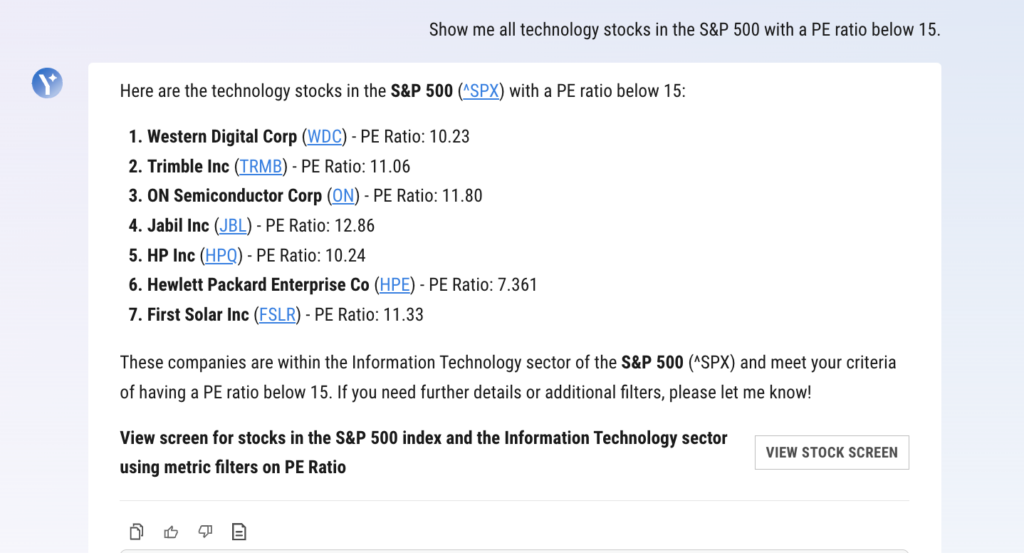
“Show me all technology stocks in the S&P 500 with a PE ratio below 15.”
AI Chat delivers a pre-filtered list, which you can open directly in Stock Screener to refine further, add filters, or compare securities more effectively.
Stay Informed with Market Updates
Keeping up with market news and regulatory filings such as quarterly reports and proxy statements is essential but often time-consuming. AI Chat pulls the latest updates directly from financial news sources and SEC filings, allowing financial professionals to ask targeted questions and receive relevant summaries.
Quickly surface the latest market developments with a simple question:
“What is going on with Starbucks (SBUX)?”
Get a concise news summary without scanning multiple sources.
Extract key takeaways from SEC filings without digging through lengthy reports by asking:
“How have AAPL’s business risks changed from 2023 to 2024?”
Instantly receive a clear summary of relevant updates, eliminating the need to manually parse through pages of regulatory disclosures.
For deeper financial analysis, AI Chat retrieves company-specific metrics with prompts like:
“How much revenue did Disney (DIS) generate in 2023 for each of its business segments?”
AI Chat delivers structured financial data, ensuring professionals have quick access to critical company insights.
Built for Financial Professionals
AI Chat is purpose-built for advisors, analysts, and asset managers who need fast, reliable insights. Unlike generic AI tools, it seamlessly integrates with YCharts, pulling from structured financial datasets rather than general web-based sources. This ensures that insights are accurate, relevant, and actionable.
By delivering instant access to financial data, automated charting, and research-backed insights, AI Chat allows professionals to spend less time searching and more time making informed decisions. Whether it’s generating investment comparisons, summarizing SEC filings, or responding to client inquiries with real-time data, AI Chat transforms workflows and enhances productivity.
Whenever you’re ready, here’s how YCharts can help you:
1. Looking to Move On From Your Investment Research and Analytics Platform?
2. Want to test out YCharts for free?
Start a no-risk 7-Day Free Trial.
Disclaimer
©2025 YCharts, Inc. All Rights Reserved. YCharts, Inc. (“YCharts”) is not registered with the U.S. Securities and Exchange Commission (or with the securities regulatory authority or body of any state or any other jurisdiction) as an investment adviser, broker-dealer or in any other capacity, and does not purport to provide investment advice or make investment recommendations. This report has been generated through application of the analytical tools and data provided through ycharts.com and is intended solely to assist you or your investment or other adviser(s) in conducting investment research. You should not construe this report as an offer to buy or sell, as a solicitation of an offer to buy or sell, or as a recommendation to buy, sell, hold or trade, any security or other financial instrument. For further information regarding your use of this report, please go to: ycharts.com/about/disclosure
Next Article
Sector Rotation Strategy: Where to Allocate Capital in a Volatile MarketRead More →