US Housing Starts Monthly Update

The U.S. Housing Starts report is a critical indicator of the health of the housing market and broader economy. Tracking the number of new residential construction projects each month, this data offers insights into the direction of the real estate market, construction industry, and economic growth. For detailed information, visit the U.S. Census Bureau Housing Starts page.
Latest Data Release
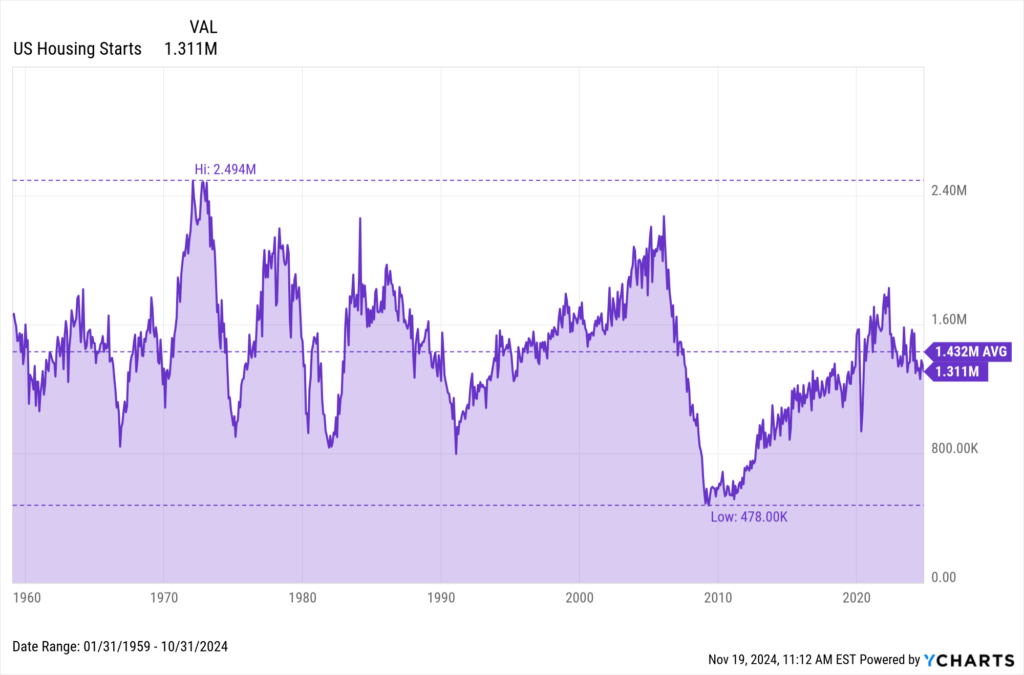
The latest report was released on November 19, 2024, covering housing starts data for October 2024. The total number of single family houses that started construction in October 2024 were 1,311,000, reflecting a -3.1% decrease from September 2024 and a -3.96% decrease from October 2023.
Download Visual | Modify in YCharts
Analysis and Insights
October’s housing starts data resembles a continued downward trend in monthly home builds since a peak of 1.828 million in April 2022, reflecting broader economic pressures and cautious sentiment in the housing market as builders respond to these ongoing challenges. Housing starts drifted further below the long-term average of 1.432 million per month.
Access long-term US Housing Starts Data on YCharts by following these simple steps:
1. Log on to YCharts.com.
2. Type “US Housing Starts” into the search bar from anywhere on the platform and click on the result.
3. Once on the indicator page, users can toggle the navigation bar to browse historical data on a month-by-month basis or view data in an interactive chart.
Clicking “View Full Chart” will open data in an interactive Fundamental Chart to compare against other economic indicators, such as the target Federal Funds Rate. Additionally, users can export historical data to a CSV file for offline analysis by clicking the “Export” button.
Related Financial Indicators
YCharts’ New Residential Construction Report contains several additional related indicators to the US Housing Starts. The U.S. Census Bureau puts together the Monthly New Residential Construction Report, which contains the first available preliminary monthly estimates of the number of housing units started, authorized but not started, under construction, and completed. Other indicators from this survey include:
- US Building Permits
- US Housing Completed
- US Housing Completed: 1 Unit
- US Housing Completed: 5 Units or More
- US Housing Starts: 1 Unit
- US Housing Starts: 5 Units or More
- US New Housing Permits: 5 Units or More
- Midwestern US New Housing Permits
- Northeastern US New Housing Permits
- Southern US New Housing Permits
- Western US New Housing Permits
Implications for Businesses and Investors
Changes in US Housing Starts can significantly impact various stakeholders, including businesses and investors.
Businesses
The decline in housing starts suggests that construction companies and material suppliers should prepare for a more challenging environment. With single-family starts decreasing significantly, businesses may need to focus on efficiency and cost management to maintain profitability. Diversifying into multi-family projects or renovations could offer more stability. Additionally, companies should monitor trends in housing completions, as a rise could signal increased demand for finishing materials and home improvement services.
Investors
For investors, the slowdown in housing starts, particularly in the single-family segment, may indicate a period of tighter supply and potential price stability or increases in existing home markets. This environment could favor investments in rental properties, especially as multi-family housing starts remain relatively stable. Additionally, investors might consider sectors that benefit from housing completions, such as home furnishings and construction materials, as these areas may see increased demand despite the overall slowdown in new starts.
YCharts Feature Highlights
YCharts offers powerful tools that enhance financial analysis and decision-making. Here’s a look at how you can leverage YCharts features for monitoring and analyzing economic data, including the New Residential Construction Report.
Model Portfolios
YCharts’ Model Portfolios allow you to build, backtest, and compare investment strategies. This feature enables advisors to simulate different economic scenarios and automate comprehensive portfolio performance reports.
Fundamental Charts
Fundamental Charts in YCharts help visualize and analyze data. Create and customize charts to compare multiple metrics and identify trends and correlations.
Dashboards
YCharts Dashboards consolidate various charts and data points into one view. Monitor performance, track key indicators in real-time, and easily share insights with clients or colleagues.
By utilizing these YCharts features, financial advisors can make data-driven decisions, stay ahead of market trends, and provide greater value to their clients.
Custom Alerts
Stay updated with YCharts’ Custom Alerts. Set alerts for specific economic indicators or portfolio changes, and receive notifications to ensure you never miss critical updates.
Economic Indicators Library
This library provides access to a wide range of economic data. Users can track key indicators, create customizable dashboards, and analyze historical data to identify trends and make informed forecasts.
Conclusion
Tracking U.S. Housing Starts is essential for understanding the health of the economy and the housing market. As a leading indicator, it reflects broader economic conditions, including consumer confidence, interest rates, and supply chain dynamics. Fluctuations in housing starts can influence a wide range of industries, from construction and materials to real estate and finance. For businesses and investors, staying informed about these trends is crucial for making strategic decisions, anticipating market shifts, and capitalizing on opportunities in the evolving economic landscape.
YCharts empowers you with the data and tools necessary to navigate these trends effectively. Regularly checking updates and utilizing YCharts for in-depth analysis can provide a competitive edge in a dynamic economic environment. To arm yourself with YCharts’ extensive library of economic indicators, charting software, and analysis tools, get in touch for a personalized information session or start a free trial.
Whenever you’re ready, there are 3 ways YCharts can help you:
1. Looking to better communicate the importance of economic events to clients?
Send us an email at hello@ycharts.com or call (866) 965-7552. You’ll be directly in touch with one of our Chicago-based team members.
2. Want to test out YCharts for free?
Start a no-risk 7-Day Free Trial.
3. Download a copy of the Quarterly Economic Update slide deck:
Disclaimer
©2024 YCharts, Inc. All Rights Reserved. YCharts, Inc. (“YCharts”) is not registered with the U.S. Securities and Exchange Commission (or with the securities regulatory authority or body of any state or any other jurisdiction) as an investment adviser, broker-dealer or in any other capacity, and does not purport to provide investment advice or make investment recommendations. This report has been generated through application of the analytical tools and data provided through ycharts.com and is intended solely to assist you or your investment or other adviser(s) in conducting investment research. You should not construe this report as an offer to buy or sell, as a solicitation of an offer to buy or sell, or as a recommendation
Next Article
Understanding Economic Indicators with YCharts: A Beginner’s GuideRead More →