US Initial Claims for Unemployment Insurance Monthly Update

The US Initial Claims for Unemployment is a critical economic indicator that reflects the number of individuals filing for state unemployment benefits for the first time. This data is reported weekly by the Department of Labor and serves as a timely measure of the health of the labor market.
High levels of initial claims suggest a weakening job market and potential economic slowdown, while low levels indicate a robust job market and economic stability. Analysts, policymakers, and investors closely monitor this data to gauge economic trends, inform policy decisions, and predict future economic activity. Understanding initial claims is essential for assessing the broader economic landscape and making informed financial and policy decisions.
The Department of Labor’s weekly Unemployment Insurance Weekly Claims news release is the source of jobless claims data.
Latest Data Release
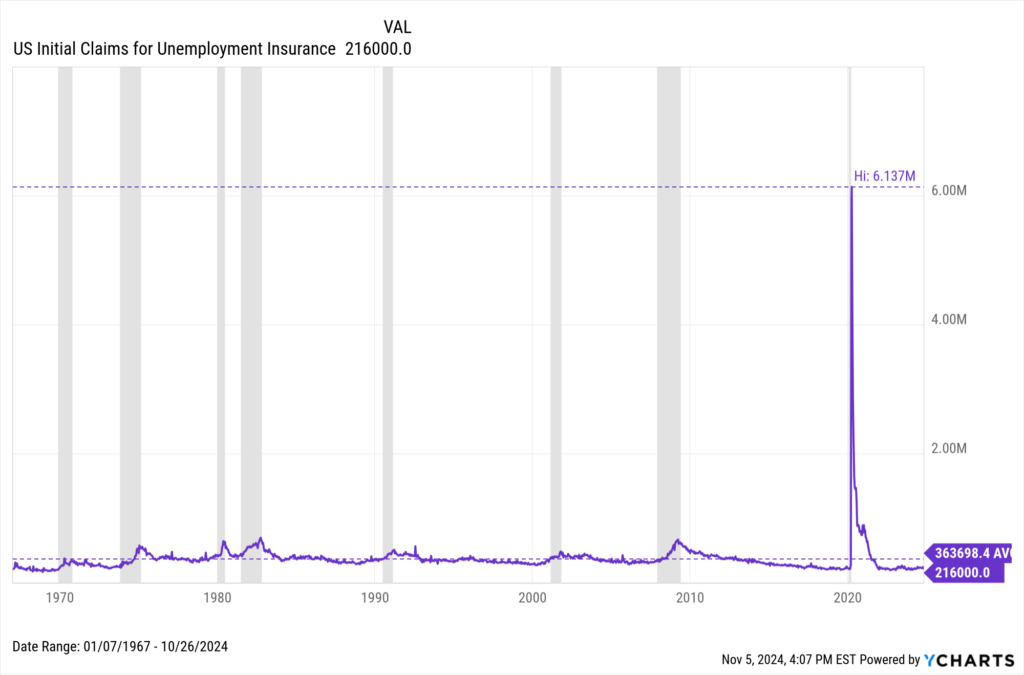
The Labor Department released its latest weekly US Initial Claims for Unemployment Insurance data on Thursday, October 31st, 2024. Unemployment claims are at a current level of 216,000 for the week ending October 26th, 2024, down from 228,000 last month and up from 213,000 one year ago. This is a change of -5.26% from last week and 1.41% from one year ago. The following chart shows how unemployment claims have risen and fallen over time.
Download Visual | Modify in YCharts
Analysis and Insights
US Initial Claims for Unemployment Insurance are well below their long-term average of 363,698. However, unemployment claims have been steadily rising in 2024. Though the week of January 6 saw 198,000 unemployment claims filed, claims reached a YTD peak of 260,000 for the week ending October 5th, representing over a 31.3% increase since the start of the year. The current level of unemployment claims as of October 26th is down an even 10% from that high.
Also referred to as “weekly jobless claims”, US Initial Claims for Unemployment Insurance is a vital economic indicator tracked on YCharts. It provides real-time insights into the health of the labor market by recording the number of individuals filing for unemployment benefits for the first time. This data is released weekly by the Department of Labor, making it a timely and responsive measure of economic conditions.
Initial claims data is closely watched by economists, investors, and policymakers because it serves as an early warning signal for shifts in the labor market. High levels of initial claims suggest rising unemployment and potential economic distress, while low levels indicate a robust job market and economic stability.
Key Metrics:
- Weekly Claims: The absolute number of claims filed each week.
- Four-Week Moving Average: A smoothed measure that reduces volatility and provides a clearer trend over time.
- Year-over-Year Change: The percentage change compared to the same week in the previous year, offering context on how the current labor market compares to historical conditions.
Historical weekly jobless claims data on YCharts dates back to 1967. Users can create interactive charts to visualize trends and correlate them with other economic indicators. By examining this data, users can identify patterns, such as periods of sustained growth or contraction, and correlate them with broader economic events.
Access unemployment claims data on YCharts by following these simple steps:
- Log on to YCharts.com.
- From anywhere on the platform, type any of the following keywords: “US Initial Claims for Unemployment Insurance” into the search bar and click on the result.
- Once on the indicator page, users can toggle the navigation bar to browse historical data on a month-by-month basis or view data in an interactive chart.
Clicking “View Full Chart” will open data in an interactive Fundamental Chart to compare against other economic indicators, such as US Initial Claims for Unemployment Insurance. Recession periods can also be added to the backdrop on any chart. Additionally, users can export historical data to a CSV file for offline analysis by clicking the “Export” button.
Related Financial Indicators
YCharts’ aggregated report, Unemployment Insurance Weekly Claims, contains several additional indicators related to US Initial Claims for Unemployment Insurance. Many of the indicators on YCharts are sourced directly from ISM’s reports. The indicators on YCharts’ report include:
- US 4-Week Moving Average of Continued Claims for Unemployment Insurance
- US 4-Week Moving Average of Initial Claims for Unemployment Insurance
- US Continuing Claims for Unemployment Insurance
- US Insured Unemployment Rate
- California Initial Claims for Unemployment Insurance WoW
- New York Initial Claims for Unemployment Insurance WoW
- Florida Initial Claims for Unemployment Insurance WoW
- Massachusetts Initial Claims for Unemployment Insurance WoW
- Michigan Initial Claims for Unemployment Insurance WoW
- Pennsylvania Initial Claims for Unemployment Insurance WoW
Implications for Investors and Policymakers
For Investors:
- Market Sentiment: A sudden increase in initial claims can signal economic trouble, leading to market volatility as investors anticipate lower consumer spending and corporate earnings. Conversely, a decrease may boost market confidence, indicating economic stability and potential growth.
- Interest Rates and Bond Yields: Rising unemployment claims can lead to expectations of lower interest rates as the Federal Reserve may cut rates to stimulate the economy. This typically results in lower bond yields. Conversely, decreasing claims may lead to expectations of rate hikes to prevent an overheated economy, driving bond yields higher.
- Stock Market Sectors:
- Consumer Goods and Services: High initial claims can negatively impact consumer-driven sectors as job losses lead to reduced disposable income and spending.
- Technology: May be less affected in the short term but can face long-term impacts if consumer and business spending decline.
- Financials: Banks and financial institutions may see increased loan defaults and reduced borrowing during high unemployment periods.
- Industrials: Sectors dependent on economic cycles, such as manufacturing and construction, can experience significant impacts.
For the Economy:
- Consumer Spending: Initial claims are inversely related to consumer spending. As unemployment rises, disposable income decreases, leading to reduced consumer spending and slower economic growth.
- Business Investment: High unemployment can lead to lower business confidence and reduced capital expenditure. Conversely, low claims often encourage investment in expansion and hiring.
- Inflation: Persistent low claims can lead to a tighter labor market, potentially increasing wages and inflationary pressures. This dynamic influences Federal Reserve policies on interest rates.
For Policymakers:
- Economic Policy: An uptick in initial claims can prompt policymakers to implement or extend economic stimulus measures, such as unemployment benefits, tax relief, or infrastructure spending to boost employment.
- Monetary Policy: The Federal Reserve monitors jobless claims to adjust monetary policies. Rising claims may lead to lower interest rates and quantitative easing, while falling claims may result in tightening measures to control inflation.
- Fiscal Policy: High unemployment claims can lead to increased government spending on social safety nets, impacting budget allocations and potentially leading to higher deficits or reallocation of funds from other areas.
Impact on Business Strategies and Sectors:
- Human Resources: Companies may adjust hiring and workforce management strategies. During high claims periods, they might freeze hiring, reduce workforce, or offer more flexible work arrangements.
- Consumer-Focused Businesses: Businesses in retail, hospitality, and travel may revise their marketing and sales strategies, offering promotions and discounts to attract cost-conscious consumers.
- Real Estate: Real estate developers and investors might slow down new projects or focus on more affordable housing options if high unemployment claims suggest a weakening economy.
- Tech Sector: Tech companies may focus on automation and efficiency improvements to reduce reliance on human labor, investing more in research and development to innovate their way through economic downturns.
- Financial Planning: Companies may prioritize liquidity and risk management, ensuring they have sufficient cash flow to weather periods of economic uncertainty.
- Government Contracts: Businesses relying on government contracts might see opportunities for growth if stimulus measures include public sector spending, particularly in infrastructure and public works.
Understanding the implications of initial claims for unemployment helps investors, policymakers, and businesses anticipate economic trends and adjust their strategies to navigate through different economic cycles effectively.
YCharts Feature Highlights
Interactive Charts
Visualize jobless claims over time by building a Fundamental Chart. Users can visualize the data over various time frames, compare it with other economic indicators, and overlay it with market indices, securities, and funds for an enhanced visual comparison. Emphasize critical junctures with interactive annotations, static Min, Max, and Average annotation lines, as well as aesthetic modifications such as custom colors or an Area Chart.
All charts are equipped with a recession overlay feature, which provides shaded gray boxes during periods of U.S. recessions. This is especially useful for showing correlations between recessions and rising jobless claims during recessions.
Timeseries Analysis
Import one or several unemployment indicators into Timeseries Analysis to conduct a thorough historical lookback across custom frequency periods. Data can be exported into CSV format for analysis in YCharts’ Excel Add-in or as a standalone file.
Comp Tables
Pull unemployment indicators in Comp Tables along with additional data points to compare movements over time, spot trends, and make informed investment decisions. Results can be exported to a CSV file or even a printable PDF for convenient, single-page analysis.
Custom Reports
Investors and analysts can create custom reports combining initial claims data with other metrics, such as GDP growth, consumer confidence, and inflation rates.
Alerts and Dashboards
Set up alerts to monitor significant changes in initial claims and integrate this data into personalized dashboards for real-time analysis.
Conclusion
Weekly jobless claims data on YCharts is a crucial indicator for gauging economic health and labor market conditions. Its implications for consumer behavior, business investment, inflation, and financial markets make it indispensable for informed decision-making. By leveraging YCharts’ analytical tools, users can gain deep insights into the trends and impacts of initial claims, helping them navigate economic cycles and make strategic investment choices.
Available on YCharts.com, the US Initial Claims for Unemployment Insurance indicator offers valuable insights into the health of the U.S. employment picture.
To arm yourself with YCharts’ extensive library of economic indicators, charting software, and analysis tools, get in touch for a personalized information session or start a free trial.
Whenever you’re ready, there are 3 ways YCharts can help you:
1. Looking to better communicate the importance of economic events to clients?
Send us an email at hello@ycharts.com or call (866) 965-7552. You’ll be directly in touch with one of our Chicago-based team members.
2. Want to test out YCharts for free?
Start a no-risk 7-Day Free Trial.
3. Download a copy of the Quarterly Economic Update slide deck:
Disclaimer
©2024 YCharts, Inc. All Rights Reserved. YCharts, Inc. (“YCharts”) is not registered with the U.S. Securities and Exchange Commission (or with the securities regulatory authority or body of any state or any other jurisdiction) as an investment adviser, broker-dealer or in any other capacity, and does not purport to provide investment advice or make investment recommendations. This report has been generated through application of the analytical tools and data provided through ycharts.com and is intended solely to assist you or your investment or other adviser(s) in conducting investment research. You should not construe this report as an offer to buy or sell, as a solicitation of an offer to buy or sell, or as a recommendation to buy, sell, hold or trade, any security or other financial instrument. For further information regarding your use of this report, please go to: ycharts.com/about/disclosure
Next Article
The 10 Best Performing Growth ETFs in the Last 10 YearsRead More →