US ISM Services PMI Monthly Update
The ISM Services PMI (Purchasing Managers’ Index) is a crucial economic indicator that measures the activity level of the services sector in the United States each month. Published by the Institute for Supply Management (ISM), it provides insights into the health and direction of industries such as finance, healthcare, retail, and transportation, among others.
A PMI above 50 indicates expansion in the services sector, while a reading below 50 suggests contraction. Persistent readings above 50 suggest robust economic growth, prompting potential policy adjustments by the Federal Reserve to manage inflation and interest rates. Conversely, readings below 50 could signal an economic downturn, leading to more accommodative policies. Analysts and policymakers use this data to gauge economic trends, anticipate changes in business conditions, and formulate strategies accordingly.
The Institute for Supply Management’s Report On Business® is the source of Services PMI data.
Latest Data Release
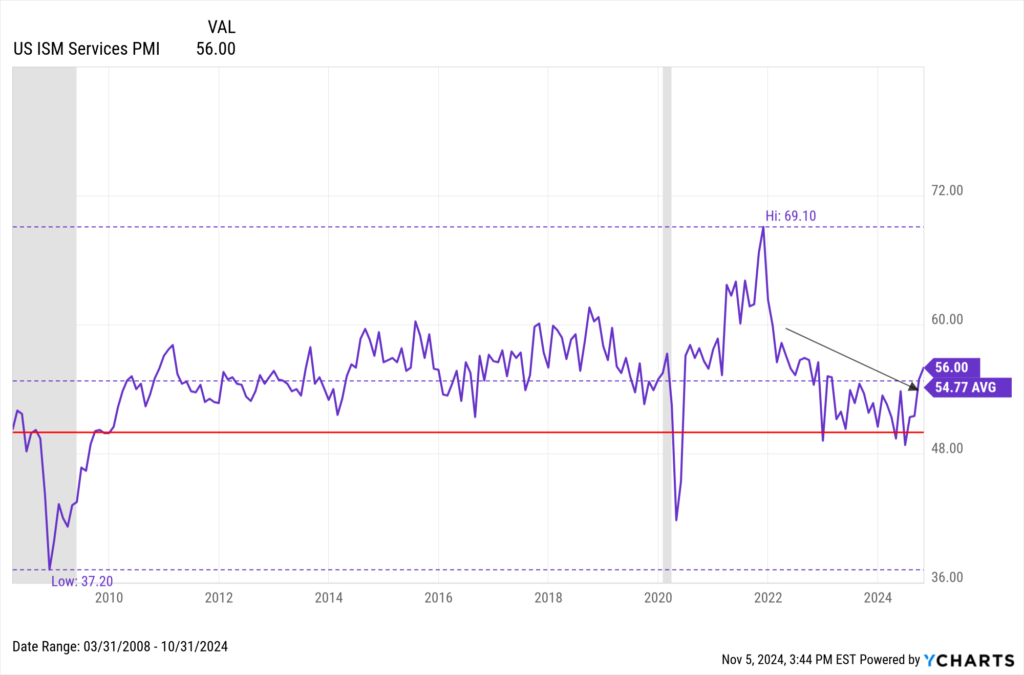
ISM released its latest weekly non-manufacturing services PMI data on Thursday, November 5th, 2024. The ISM Services PMI is at a current level of 56.00, up from 54.90 last month and up from 51.80 one year ago. The following chart shows the PMI’s trend over time, with the red line serving as the demarcation line between expansion (over 50) and contraction (under 50) territory.
Download Visual | Modify in YCharts
Analysis and Insights
The ISM Services PMI rose 1.1 points between September and October, and has been above 50 in 50 of the last 53 months. This means the U.S. services sector has been mostly expanding since June 2020. October’s services PMI reading of 56 is the highest since February 2023, indicating a strong push further into expansion territory after briefly falling below 50 in June.
As indicated by the downward arrow on the interactive chart above, the PMI has also been steadily trending lower from its peak of 69.10 in November 2021. However, October’s move to the upside could be considered a technical breakthrough and a sign that the downtrend has paused.
While readings below 50 don’t necessarily indicate the immediate presence of a recession, recessions have historically occurred when the PMI stays below 50 for prolonged periods of time.
Also known as the Non-Manufacturing PMI, ISM’s Services PMI is compiled from monthly surveys of over 400 purchasing and supply executives across the U.S. It covers sectors such as finance, insurance, real estate, communications, and healthcare. The index measures various aspects of business activity, including new orders, employment, supplier deliveries, and inventories.
Key Components and Their Interpretation
- Business Activity: This component assesses the current level of business activities compared to the previous month. An increase indicates growing demand and economic strength.
- New Orders: Reflects new demand for services. Rising new orders suggest future business growth.
- Employment: Measures employment levels within the sector. Higher employment indicates confidence among businesses to expand their workforce.
- Supplier Deliveries: Tracks the speed at which suppliers deliver inputs to businesses. Slower deliveries can signify higher demand and potential supply chain constraints.
- Inventories: Monitors the level of goods held by businesses. Changes in inventories can indicate adjustments in response to market conditions.
Historical ISM Services PMI data on YCharts dates back to 2008. Users can create interactive charts to visualize trends and correlate them with other economic indicators. By examining this data, users can identify patterns, such as periods of sustained growth or contraction, and correlate them with broader economic events.
Access ISM Services PMI data on YCharts by following these simple steps:
- Log on to YCharts.com.
- From anywhere on the platform, type any of the following keywords: “US ISM Services PMI” into the search bar and click on the result.
- Once on the indicator page, users can toggle the navigation bar to browse historical data on a month-by-month basis or view data in an interactive chart.
Clicking “View Full Chart” will open data in an interactive Fundamental Chart to compare against other economic indicators, such as the ISM Manufacturing PMI. Recession periods can also be added to the backdrop on any chart. Additionally, users can export historical data to a CSV file for offline analysis by clicking the “Export” button.
Related Financial Indicators
YCharts’ aggregated report, ISM Services Report On Business, contains several additional indicators related to the Services PMI. Many of the indicators on YCharts are sourced directly from ISM’s reports. The indicators on YCharts’ report include:
- US ISM Manufacturing PMI
- US ISM Services Backlog Index
- US ISM Services Business Activity Index
- US ISM Services Employment Index
- US ISM Services Exports Index
- US ISM Services Imports Index
- US ISM Services Inventories Index
- US ISM Services Inventory Sentiment Index
- US ISM Services New Orders Index
- US ISM Services Prices Paid Index
- US ISM Services Supplier Deliveries Index
Implications for Investors and Policymakers
The ISM Services PMI has significant implications for both investors and policymakers, as well as for the strategic decisions made by businesses across various sectors. Here are the key points to consider:
Implications for Investors
- Market Sentiment: A higher-than-expected Services PMI can boost investor confidence, leading to higher stock prices, especially in the services sector. Conversely, a lower-than-expected PMI may trigger concerns about economic slowdown, causing stock prices to drop.
- Sector Performance: Investors can use PMI data to identify which sectors within the services industry are expanding or contracting, guiding their investment choices.
- Interest Rates: A strong PMI reading can influence expectations of interest rate hikes by the Federal Reserve, affecting bond markets and interest-sensitive investments like utilities and real estate.
Utilization in Investment Strategies
Investors can leverage the ISM Services PMI data on YCharts to inform their investment strategies. For example:
- Equity Markets: Positive PMI readings can boost investor confidence in service-oriented stocks, leading to potential price increases.
- Bond Markets: Strong PMI data might influence expectations of interest rate hikes, impacting bond yields.
- Sector Rotation: Investors might rotate their portfolios towards or away from the services sector based on PMI trends.
Implications for Policymakers
- Economic Policy: Policymakers use the Services PMI as a barometer of economic health. Persistent expansion in the services sector may prompt tightening of monetary policy to prevent overheating, while contraction could lead to more accommodative policies.
- Labor Market: Given the significant employment in the services sector, PMI readings can influence labor market policies, including job creation initiatives and unemployment benefits.
- Inflation Control: Strong growth in the services sector can lead to inflationary pressures. Policymakers might adjust fiscal and monetary policies to manage inflation.
Impact on Business Strategies
- Resource Allocation: Companies in the services sector can use PMI data to adjust their resource allocation, such as hiring, inventory management, and capital expenditure.
- Market Expansion: Businesses may identify opportunities for market expansion or contraction based on the PMI trends, helping them decide where to focus their growth efforts.
- Pricing Strategies: A robust services sector often leads to increased demand, allowing businesses to adjust pricing strategies to optimize profitability.
- Supply Chain Management: Companies might adjust their supply chain strategies to mitigate risks related to potential slowdowns indicated by declining PMI figures.
Sector-Specific Effects
- Finance: Strong PMI data suggests economic growth, leading to increased lending and investment activities.
- Healthcare: Expansion in services indicates higher demand for healthcare services, prompting investments in infrastructure and technology.
- Retail: A positive PMI reading can signal increased consumer spending, leading retailers to stock more inventory and expand their offerings.
- Transportation: Growth in services implies higher demand for transportation and logistics services, influencing fleet expansion and logistics optimization.
Overall, the ISM Services PMI is a vital tool for investors, policymakers, and business leaders. Its readings provide a snapshot of economic activity and trends in the services sector, guiding strategic decisions and policy formulations to foster growth and stability.
YCharts Feature Highlights
Fundamental Charts
Visualize PMI movement over time by building a Fundamental Chart. Additional economic indicators, securities, funds, and indices can be added for an enhanced visual comparison. Emphasize critical junctures with interactive annotations, static Min, Max, and Average annotation lines, as well as aesthetic modifications such as custom colors or an Area Chart.
All charts are equipped with a recession overlay feature, which provides shaded gray boxes during periods of U.S. recessions. This is especially useful for showing correlations between falling asset performance and PMI contractions during recessions.
Timeseries Analysis
Import one or several PMI indicators into Timeseries Analysis to conduct a thorough historical lookback across custom frequency periods. Data can be exported into CSV format for analysis in YCharts’ Excel Add-in or as a standalone file.
Comp Tables
Pull the Services PMI indicator in Comp Tables along with additional data points to compare movements over time, spot trends, and make informed investment decisions. Results can be exported to a CSV file or even a printable PDF for convenient, single-page analysis.
Alerts
YCharts provides real-time updates and customizable alerts for the ISM Services PMI, ensuring users stay informed of any significant changes. This feature is particularly valuable for active traders and portfolio managers who need to react swiftly to new economic data.
Conclusion
The ISM Services PMI on YCharts is an essential tool for understanding the health and direction of the U.S. services sector. Its comprehensive data and analytical capabilities allow users to make informed decisions, whether they are policymakers, investors, or business leaders. By tracking this indicator, users can gain valuable insights into economic trends, market conditions, and potential investment opportunities, ultimately supporting more effective strategic planning and decision-making.
Available on YCharts.com, the Services PMI indicator offers valuable insights into the health of the vibrant services-based sector that composes a large piece of the U.S. economy.
To arm yourself with YCharts’ extensive library of economic indicators, charting software, and analysis tools, get in touch for a personalized information session or start a free trial.
Whenever you’re ready, there are 3 ways YCharts can help you:
1. Looking to better communicate the importance of economic events to clients?
Send us an email at hello@ycharts.com or call (866) 965-7552. You’ll be directly in touch with one of our Chicago-based team members.
2. Want to test out YCharts for free?
Start a no-risk 7-Day Free Trial.
3. Download a copy of the Quarterly Economic Update slide deck:
Disclaimer
©2024 YCharts, Inc. All Rights Reserved. YCharts, Inc. (“YCharts”) is not registered with the U.S. Securities and Exchange Commission (or with the securities regulatory authority or body of any state or any other jurisdiction) as an investment adviser, broker-dealer or in any other capacity, and does not purport to provide investment advice or make investment recommendations. This report has been generated through application of the analytical tools and data provided through ycharts.com and is intended solely to assist you or your investment or other adviser(s) in conducting investment research. You should not construe this report as an offer to buy or sell, as a solicitation of an offer to buy or sell, or as a recommendation to buy, sell, hold or trade, any security or other financial instrument. For further information regarding your use of this report, please go to: ycharts.com/about/disclosure
Next Article
US Nonfarm Payrolls Monthly Update | YCharts ReportRead More →