Using Capital Gains Insights to Strengthen Advisor Partnerships
After three straight years of market gains, several mutual funds are carrying massive embedded appreciation. Add in the renewed role of fixed income and global equities, and the result is clear: advisors and their clients could be staring down some of the largest year-end capital gains distributions in years.
What an opening if you have the right products, dataset, and talking points. Advisors don’t want to explain surprise tax bills to clients. And you can show up with the solution.
With CapGainsValet in YCharts, you can pinpoint which funds will saddle advisors with heavy distributions and position your strategy as the tax-efficient alternative. Instead of waiting for advisors to ask the question, you can lead with the answer: “Here’s the tax bill coming from your current holdings, and here’s how my strategy avoids it.”
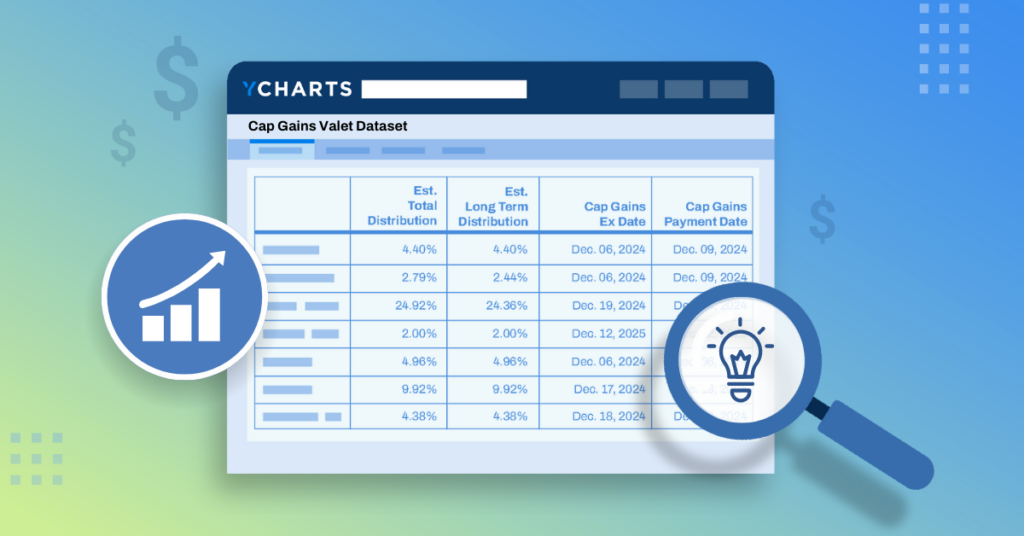
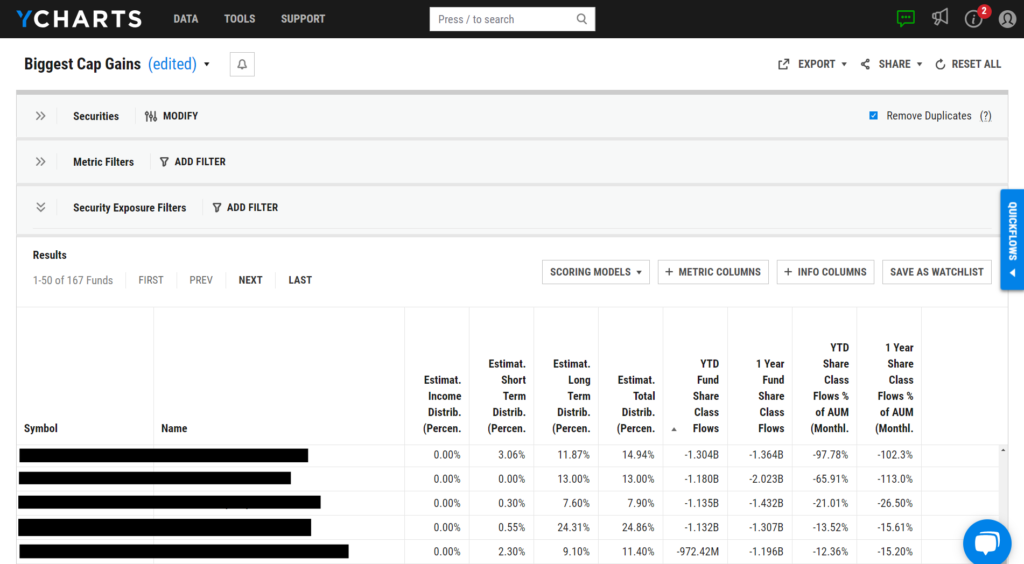
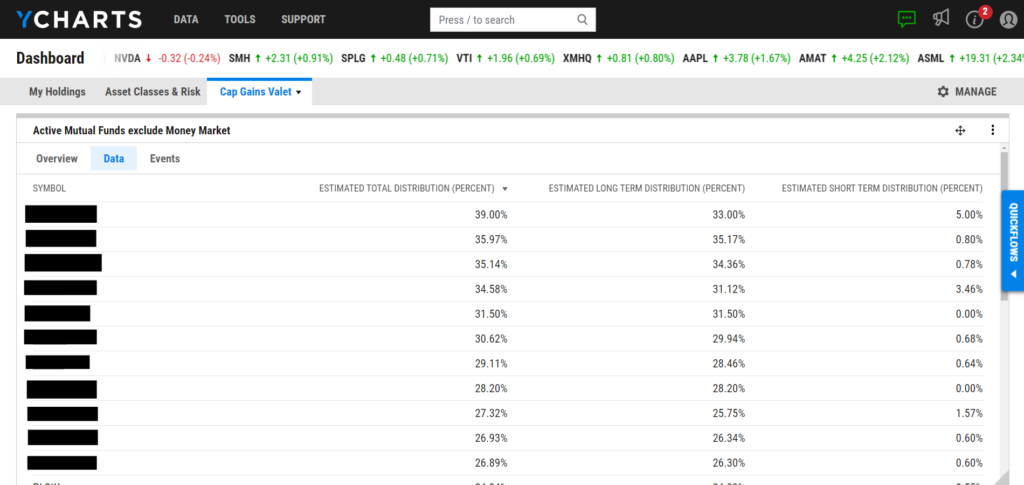
View a Sample CapGainsValet Screen
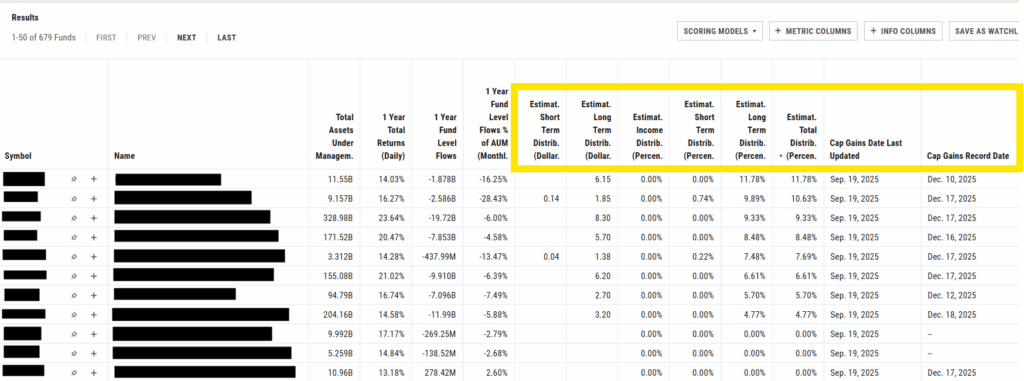
Reach Out to Add CapGainsValet Metrics to Your AccountThe CapGainsValet dataset lets you break distributions down by source, income, short-term, or long-term capital gains, and quantify them in dollars or as a percentage of NAV.
And the story only gets stronger with the rest of the YCharts toolkit.
Smart Compare gives you instant, AI-powered talking points across up to nine competing strategies.
Holdings Overlap reveals exactly where your product reduces duplication and adds diversification.
If minimizing tax drag wasn’t urgent enough, the SEC just raised the stakes. On September 29, 2025, regulators approved Dimensional Fund Advisors’ application to launch ETF and mutual fund share classes side-by-side.
With CapGainsValet, Smart Compare, Holdings Overlap, and Quick Extract, combined with the latest regulation, your distribution team has a full quiver to make this capital gains season one of the best opportunities for asset growth.
Strategies for Replacing High-Cost Funds in an Advisor’s Model
Most distribution teams find the most success using YCharts as a point-of-sale tool, and the Cap Gains Valet dataset further enhances that use.
If you offer the capital gains consultation to engage with an advisor early, or if you’re deeper in the sales cycle and an advisor has entrusted you to analyze their models, YCharts’ Quick Extract tool eliminates one of the most time-consuming tasks in asset management: importing model data prior to analyzing them for opportunities.
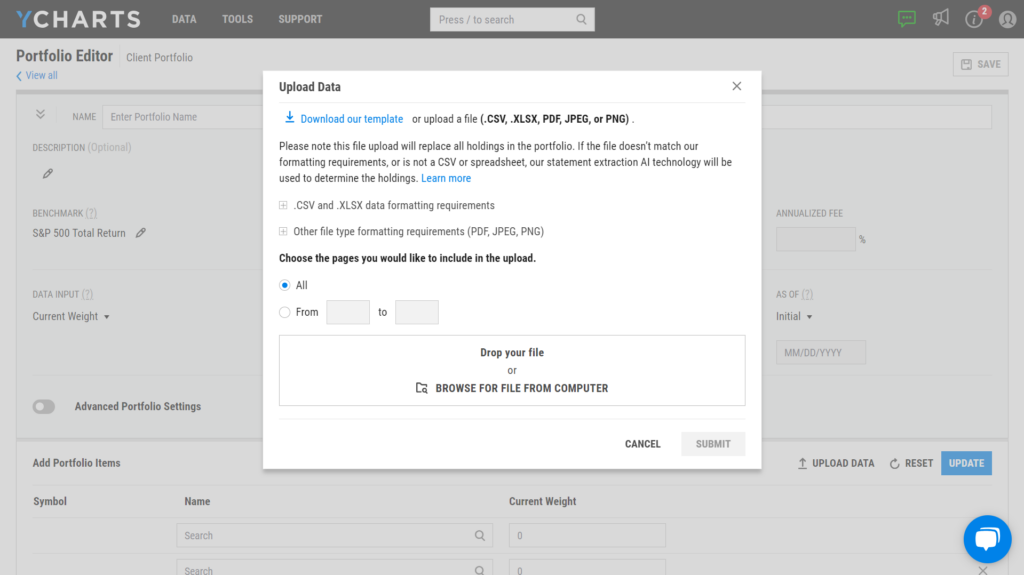
Learn More About Quick Extract
Whether you Quick Extract an advisor’s model portfolio or manually upload the holdings, you can employ the “Holdings Cap Gains” quickflow from the portfolio page to pinpoint which funds are likely to distribute substantial capital gains and begin positioning against those strategies.
The next step involves duplicating the advisor’s model and substituting your strategy for the competitor’s fund you’re targeting. With this setup, you can then deploy Fundamental Charts and other point-of-sale tools within YCharts to illustrate your strategy’s relative strengths.
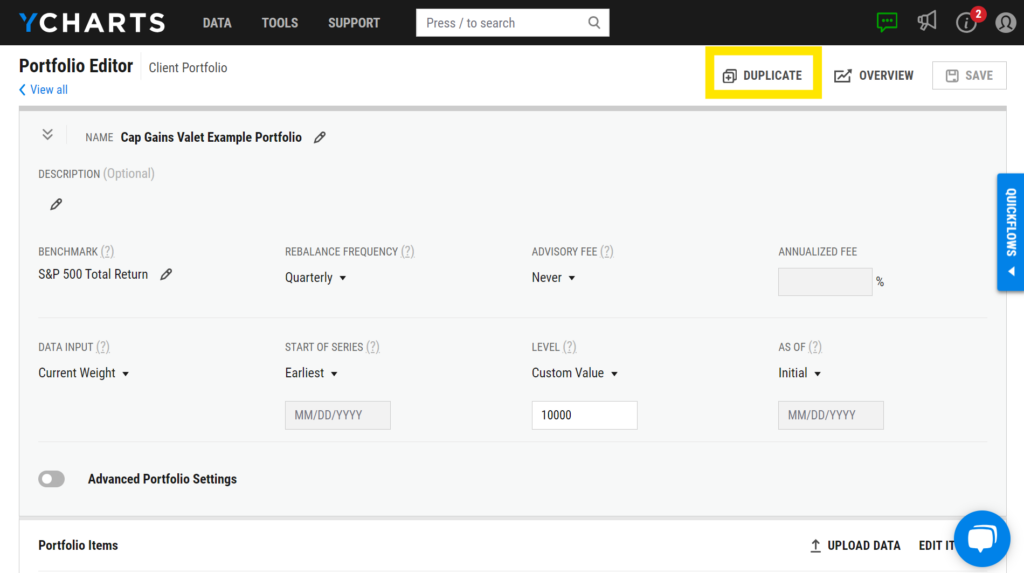
Add Your Fund to an Advisor’s Model Portfolio
This workflow benefits all asset managers, but particularly those issuing ETFs or preparing to under the new share class framework. With the SEC’s approval of Dimensional Fund Advisors’ application, mutual funds can launch ETF share classes side-by-side. Even more, the ruling allows for a Mutual fund–to–ETF exchange Privilege, allowing investors to move into the ETF class without triggering a taxable event.
That backdrop makes capital gains season an even greater opportunity to remind or educate advisors on the tax efficiency of ETFs compared to mutual funds.
Under the Investment Company Act of 1940 (“the 40 Act”), both vehicles must record all portfolio manager transactions. However, only mutual funds are required to distribute net gains to shareholders each year, which often saddles clients with tax bills at exactly the wrong time.
ETFs, on the other hand, rely on in-kind creation and redemption with market makers. This process means that shareholder trading has little direct effect on realized gains. Mutual funds, by contrast, may need to sell securities to meet redemptions, creating taxable events for all shareholders.
With CapGainsValet, you can highlight this structural advantage and identify which mutual funds are about to deliver large distributions. With fund flow and performance metrics, you can spot competitors facing the “double” or even “triple whammy” of redemptions, poor performance, and capital gains payouts, then position your strategy as the cleaner, more tax-efficient alternative.
Illustrate Your Fund’s Tax Efficiency and Competitive Edge
After using the CapGainsValet dataset to identify which funds you want to position your strategy against, the next step is leveraging YCharts’ robust suite of point-of-sale features, which are instrumental in winning AUM.
In evaluating the tech stack for a distribution team, it’s important not to underestimate the quote page, a common feature across many platforms. But YCharts’ quote page goes far beyond the basics; it’s built to help wholesalers win meetings in real time. In seconds, you can pull up visuals that illustrate your strategy’s strengths and spark advisor engagement. A prime example is Holdings Overlap, which clearly shows where your fund reduces duplication and adds diversification compared to a competitor’s.
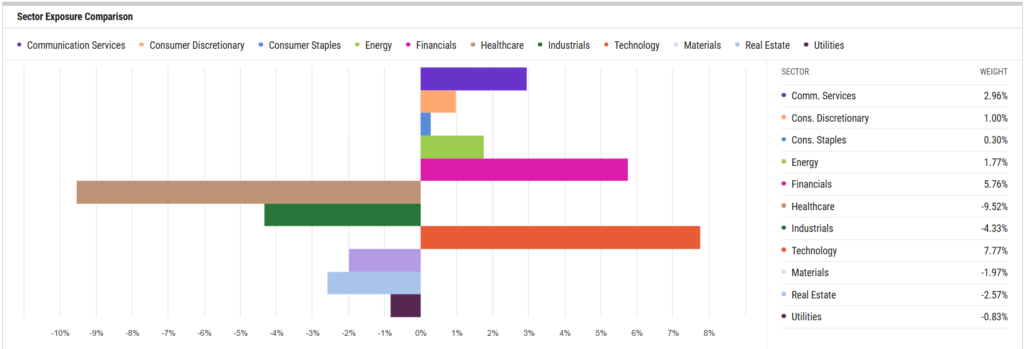
Learn More About Holdings Overlap
Another example is the Correlation Matrix, which can show an advisor how your strategy enhances diversification or complements existing positions within their portfolio. Edited comparable securities will stay saved in the tool to jumpstart future comparisons and discussions.
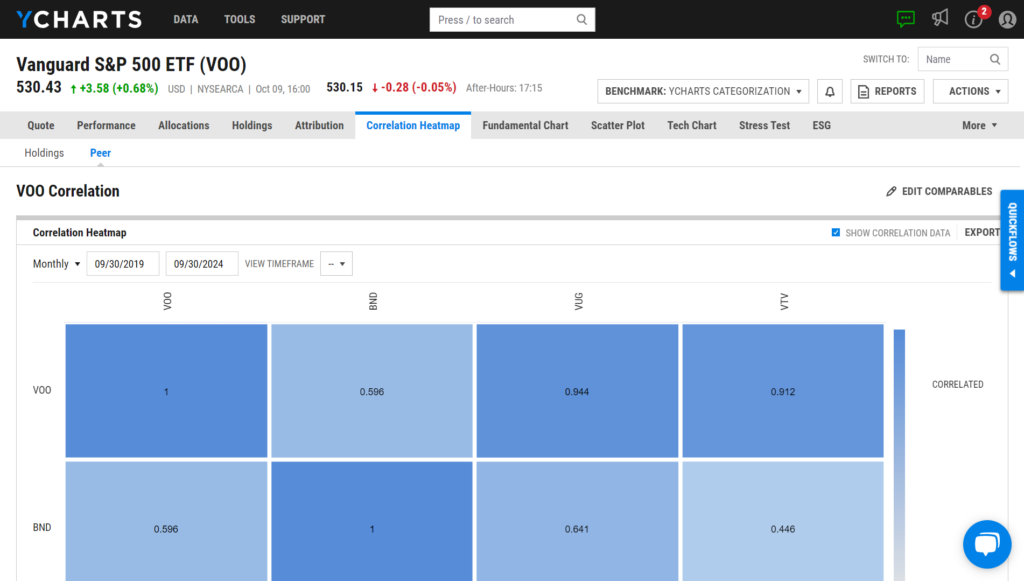
Moreover, from a fund’s quote page, you can use one of our many comparison quickflows, like the “Performance Chart” or “Risk/Reward Scatter Plot,” to illustrate the positive impact adding your strategy to a portfolio can have.
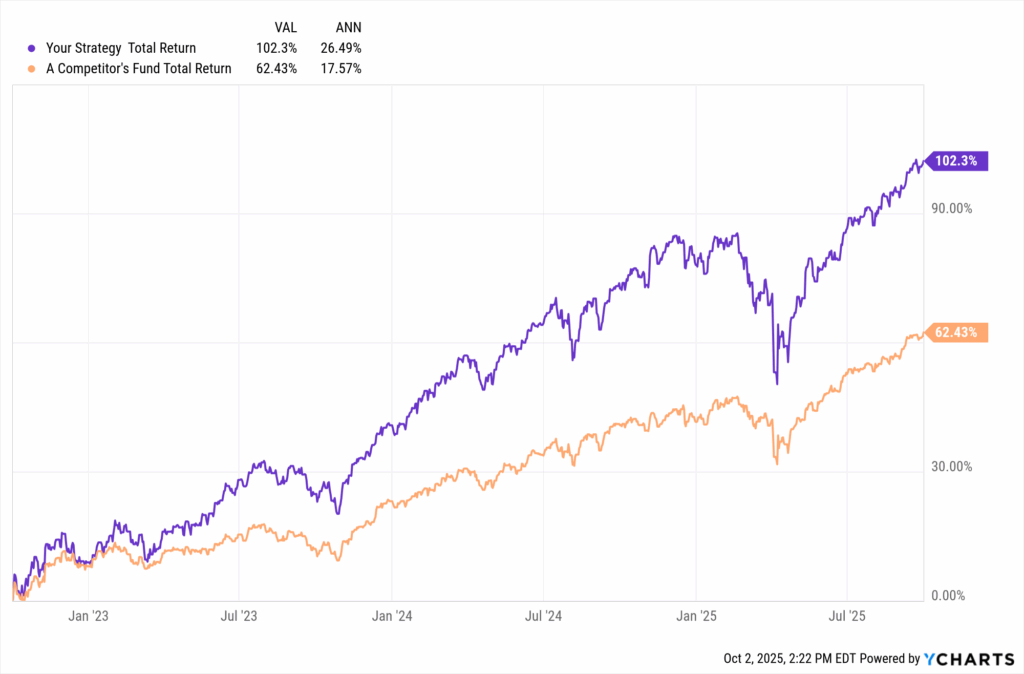
Compare Your Strategy to a Competitor
Aligning Sales Teams on Your Strategy’s Tax Efficiency
After building a visual or completing a capital gains analysis, use our shareable dashboards to align the distribution team on sales stories, organize competitor funds with high tax liabilities, and have fund comparisons against those strategies saved to minimize losing momentum in conversations with advisors.
Divisional and regional directors find dashboards incredibly valuable because they facilitate alignment among their teams. These dashboards can be shared following team or home-office meetings and can include comprehensive notes on high-tax cost funds, targeted firms, or links to internal lists detailing which product offerings are available at a specific firm. This ensures everyone is aligned on the strategy’s story and how to implement it in the field.
Directors and managers will appreciate the simplicity with which they can oversee their target addressable markets and analyze competitors. The capability to immediately review estimated capital gains distributions from competitors upon logging in enables leaders to quickly identify which competitors might soon face uncomfortable conversations with advisors and determine if you have a lower-cost or better-performing alternative.
By leveraging the CapGainsValet dataset in YCharts, you can proactively address potential capital gains tax liabilities and strategically position your offerings to attract or retain AUM. As the end of the year approaches, the ability to preemptively engage in capital gains conversations and educate advisors on the comparative tax advantages of your strategies can significantly impact advisor engagement and, ultimately, drive AUM growth.
Whenever you’re ready, there are 3 ways YCharts can help you:
1. Want to test out YCharts for free?
Start a no-risk 7-Day Free Trial.
2. Get the Cap Gains Valet dataset added to your YCharts account:
Reach Out to Add CapGainsValet Metrics to Your Account3. Sign up for a copy of our Fund Flows Report: to keep tabs on flows into ETFs and Mutual Funds:
Sign up for our free monthly Fund Flow Report:Disclaimer
©2025 YCharts, Inc. All Rights Reserved. YCharts, Inc. (“YCharts”) is not registered with the U.S. Securities and Exchange Commission (or with the securities regulatory authority or body of any state or any other jurisdiction) as an investment adviser, broker-dealer or in any other capacity, and does not purport to provide investment advice or make investment recommendations. This report has been generated through application of the analytical tools and data provided through ycharts.com and is intended solely to assist you or your investment or other adviser(s) in conducting investment research. You should not construe this report as an offer to buy or sell, as a solicitation of an offer to buy or sell, or as a recommendation to buy, sell, hold or trade, any security or other financial instrument. For further information regarding your use of this report, please go to: ycharts.com/about/disclosure
Next Article
Government Shutdown October 2025: Analyzing Market Impact and Sector PerformanceRead More →