Using Dashboards as a Centralized Sales Center
Several features in YCharts can help asset managers attract AUM, but none may be as powerful as the first page everyone sees after they log in—the Dashboard.
For asset managers, this tool allows you to align the sales force on your strategies’ stories, organize funds by firm availability, and have your most relevant fund comparisons saved so there is minimal momentum lost in conversations with advisors.
Connect with an Asset Management Specialist to Build Your Dashboard
With those capabilities, salespeople can be empowered to have powerful conversations with advisors in their vertical or territory. Additionally, because dashboards can be shared at the firm or team level, they prove even more valuable to organizations by helping them deliver consistent, relevant stories to advisory firms and BDs.
Below, we’ll walk through several use cases for the dashboard and illustrate why the most common tool in YCharts can also be the most powerful.
Wholesalers Can Use Dashboards in Advisor Meetings
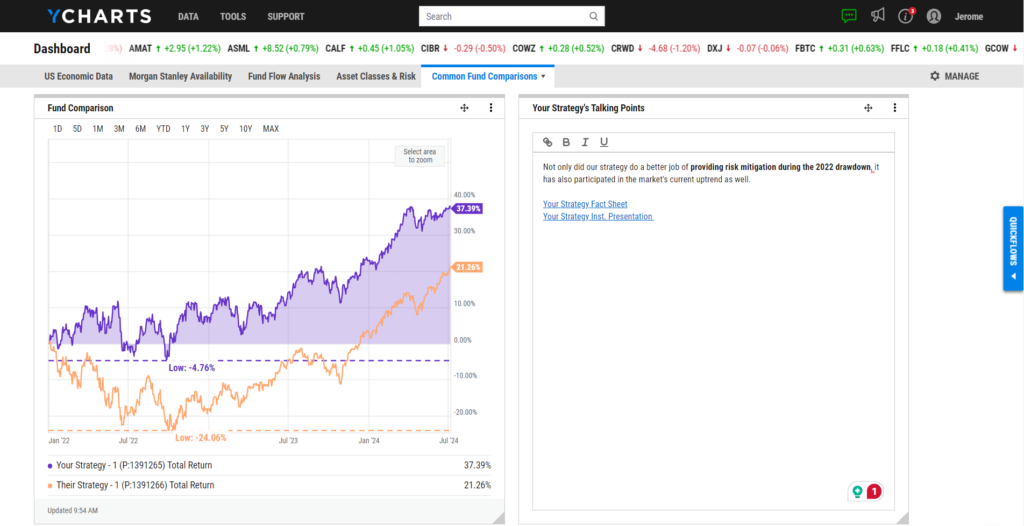
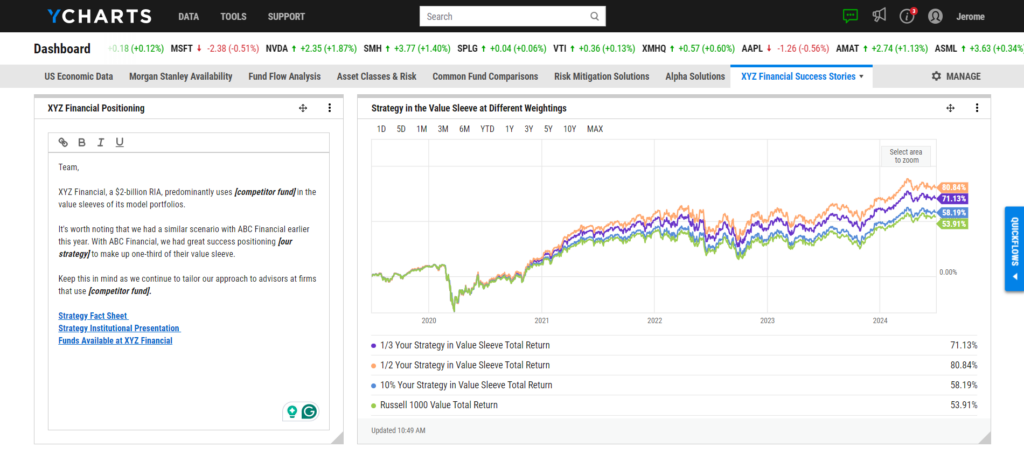
In advisor meetings, the Dashboard’s value as a point-of-sale tool shines through. For example, after encountering a particular fund multiple times in separate meetings, a wholesaler can add a visual comparison of their fund versus the competitor’s fund to save time in subsequent meetings.
A wholesaler can enhance this comparison by adding their own talking points alongside the visual to ensure they address every aspect of the strategy’s differentiated value and how it can help an advisor’s client reach their goals. When building these notes, a wholesaler can link to a strategy’s fact sheet or pitch deck, enabling them to seamlessly go from YCharts to their firm’s prepared presentation materials.
Connect with an Asset Management Specialist to Build Your Dashboard
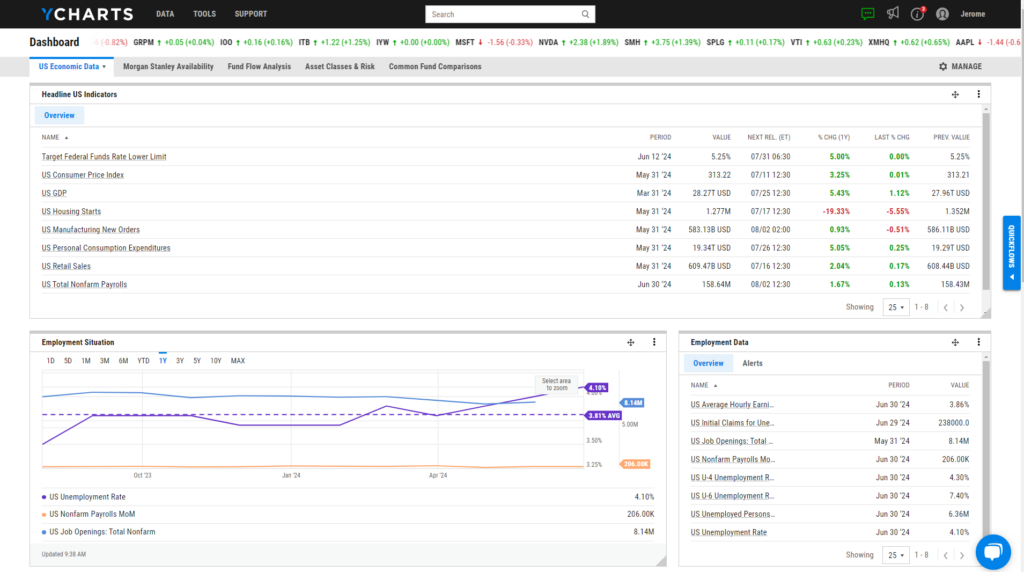
Additionally, the dashboard can be equipped with any of the 500,000+ economic indicators in YCharts to provide macro-level economic insights based on a target firm’s research, which can further enhance presentations with more tailored perspectives.
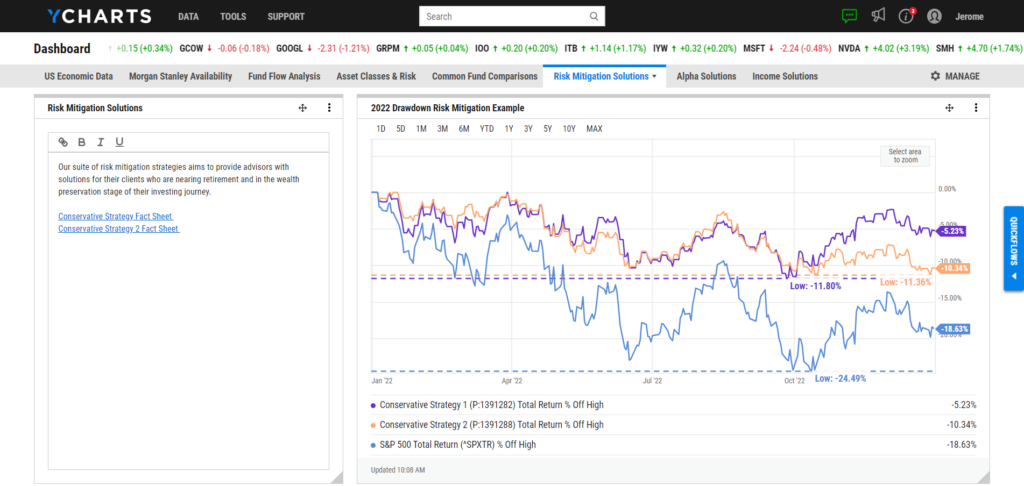
Organizing dashboards by a suite of strategies is also beneficial.
For instance, if advisors are more concerned with risk mitigation or income generation rather than alpha, a dashboard can be created to include the suite of solutions to address these common advisor concerns.
Connect with an Asset Management Specialist to Build Your Dashboard
Personalizing a dashboard in any of these ways transforms a wholesaler’s tablet or iPad into an AUM-generating technology, allowing them to build and maintain momentum and drive stronger relationships with financial advisors.
Divisional and Regional Directors Using Dashboards
Divisional and regional directors will find dashboards incredibly valuable because they can facilitate alignment among their teams.
After a team or home-office meeting, leaders can share a dashboard with their team, complete with notes on a fund, target firm, or a link to an internal list that shows what product offerings can be sold at a specific firm. This will ensure everyone is aligned on the strategy’s story.
Connect with an Asset Management Specialist to Build Your Dashboard
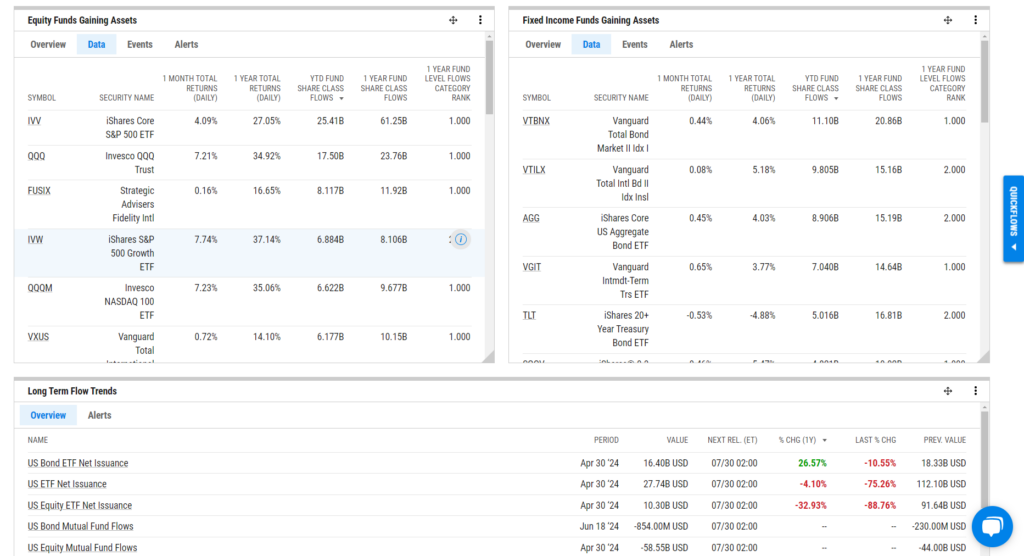
Directors and managers will also find value in the ease with which they can monitor their target addressable market and its competitors.
Monitoring top competitors’ fund flows right upon login helps identify which funds resonate with advisors and determine if a lower-cost or better-performing alternative is available.
Connect with an Asset Management Specialist to Build Your Dashboard
Depending on the vertical, a dashboard can be set up for wirehouse versus RIA availability or drilled down to specific firm availability. This ensures teams have only the most relevant stories saved to their shared dashboard.
Using Dashboards as Product ‘Factsheets’
Dashboards can also serve as interactive ‘factsheets.’ In addition to adding visuals with annotations, a CIO or research team can provide their notes on what those data points mean for a fund’s historical or potential performance.
Stress tests and shared model portfolio visuals can also be saved directly to a dashboard, making it easier to articulate the “how” and “why” an advisor should allocate to a particular fund.
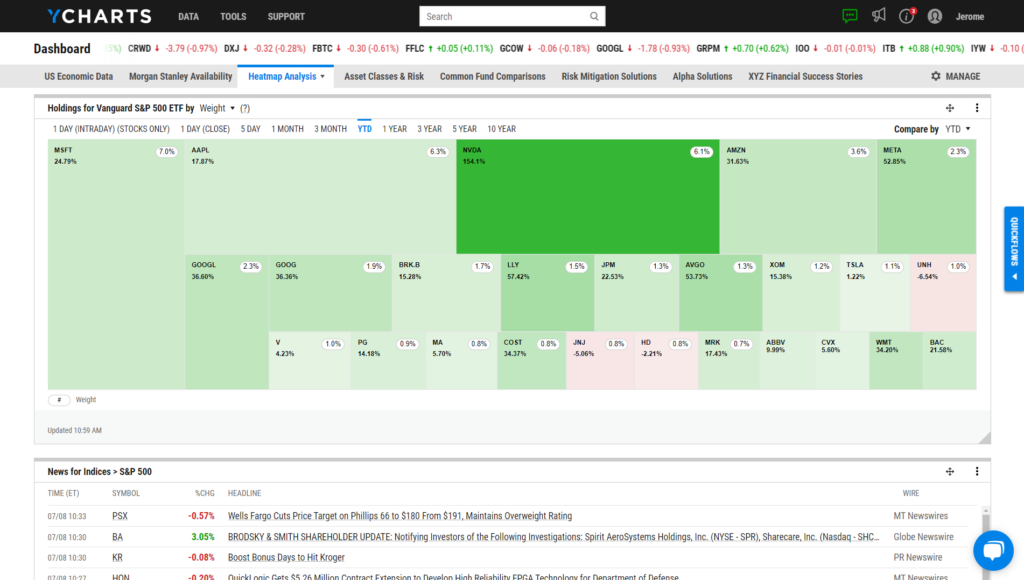
To visualize the value of a portfolio manager, a heatmap can be created and saved in combination with news modules to access deeper insights into the biggest holdings in a fund, helping to stay informed and tell stock stories that serve as a microcosm for the strategy’s success.
Connect with an Asset Management Specialist to Build Your Dashboard
By leveraging YCharts dashboards at the organizational, team, and individual levels, asset managers can streamline their sales processes, provide better insights, and ultimately attract more AUM from financial advisors.
Whenever you’re ready, there are three ways YCharts can help you:
1. Have questions about leveraging YCharts to grow AUM in your Mutual Fund or ETF?
Email us at hello@ycharts.com or call (866) 965-7552. You’ll get a response from one of our Chicago-based team members.
2. Build & Share your own Dashboards to align your sales force.
Dive into YCharts with a no-obligation 7-Day Free Trial now.
3. Talk to a member of our Asset Management team to see how YCharts can assist you in growing your business:
Disclaimer
©2024 YCharts, Inc. All Rights Reserved. YCharts, Inc. (“YCharts”) is not registered with the U.S. Securities and Exchange Commission (or with the securities regulatory authority or body of any state or any other jurisdiction) as an investment adviser, broker-dealer or in any other capacity, and does not purport to provide investment advice or make investment recommendations. This report has been generated through application of the analytical tools and data provided through ycharts.com and is intended solely to assist you or your investment or other adviser(s) in conducting investment research. You should not construe this report as an offer to buy or sell, as a solicitation of an offer to buy or sell, or as a recommendation to buy, sell, hold or trade, any security or other financial instrument. For further information regarding your use of this report, please go to: ycharts.com/about/disclosure
Next Article
Monthly Market Wrap: June 2024Read More →