Tech Drawdowns, Value Inflows: What ETF Flows Are Telling Us Now
Interested in testing out YCharts for free?
Start 7-Day Free TrialTable of Contents
Putting the Tech Drawdown in Context
Mega-cap tech is rolling over, but the broader market hasn’t, and flows are revealing where leadership is quietly shifting.
All of the Magnificent 7 are now off their all-time highs by double digits, with Microsoft, Meta, and Tesla down more than 20%.
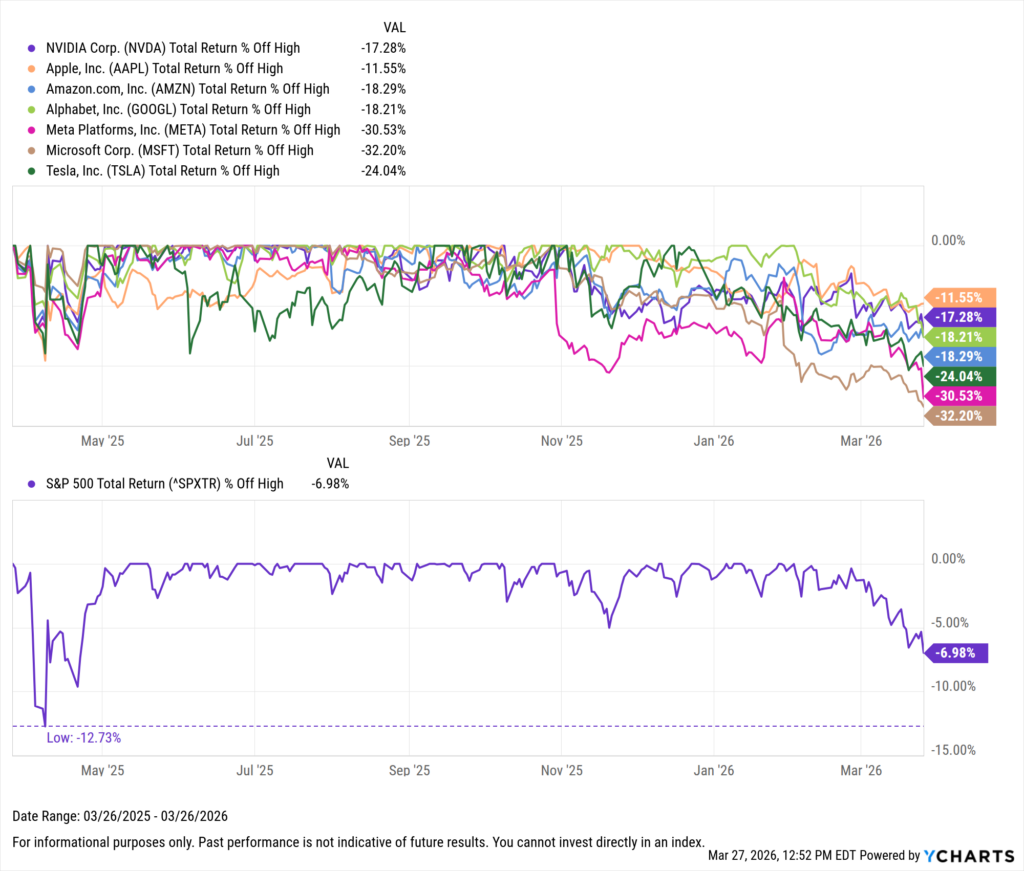
This is part of a trend that began in Q4 and has accelerated into 2026. Many of the same mega-cap names that led the AI-driven rally are now leading on the downside, with software stocks in the S&P 500 down over 30%.
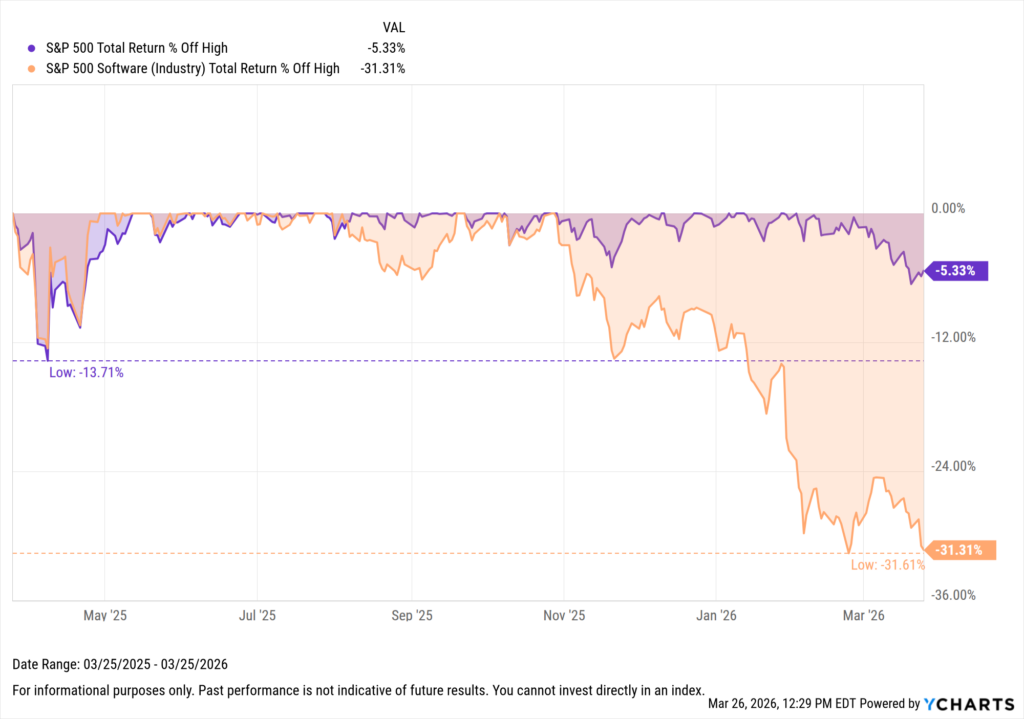
And yet, despite the dramatic drawdowns in some of the index’s most heavily weighted names, the S&P 500 itself is roughly 7% off its highs.
This suggests that while leadership has weakened, participation across the broader market has improved, with gains coming from outside the mega-cap cohort.
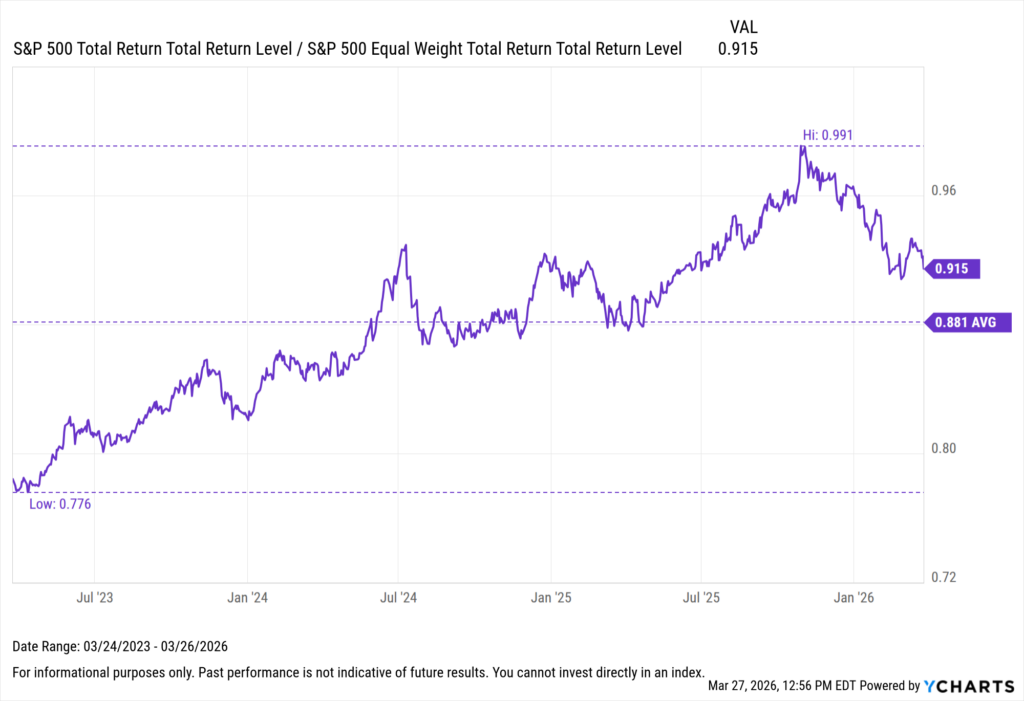
The start of 2026 has been a reminder that markets are cyclical and that diversification plays a critical role when leadership shifts.
That shift has coincided with strength in sectors like industrials, energy, utilities, and consumer staples—areas more closely tied to physical assets.
Ritholtz Wealth Management’s Josh Brown has framed this rotation through the lens of HALO (Heavy Assets, Low Obsolescence). These businesses are less dependent on long-term growth expectations and more grounded in physical-world use cases.

This rotation has been further reinforced by geopolitical tensions in the Middle East, which have introduced new uncertainties and supported demand for real assets and commodities, particularly within energy markets.
Brown has also pointed out that this environment presents a bit of a conundrum for investors, as it doesn’t fit neatly into traditional frameworks such as value vs. growth or small vs. large.
Instead, leadership is being driven by characteristics more closely tied to durability and real-world demand.
So while sector labels alone don’t fully explain what’s supporting the market, performance trends do point to a rotation toward more asset-heavy and defensive areas.
With that in mind, we looked across large- and multi-cap value strategies to identify where assets are flowing, and how sector exposure is evolving relative to benchmarks.
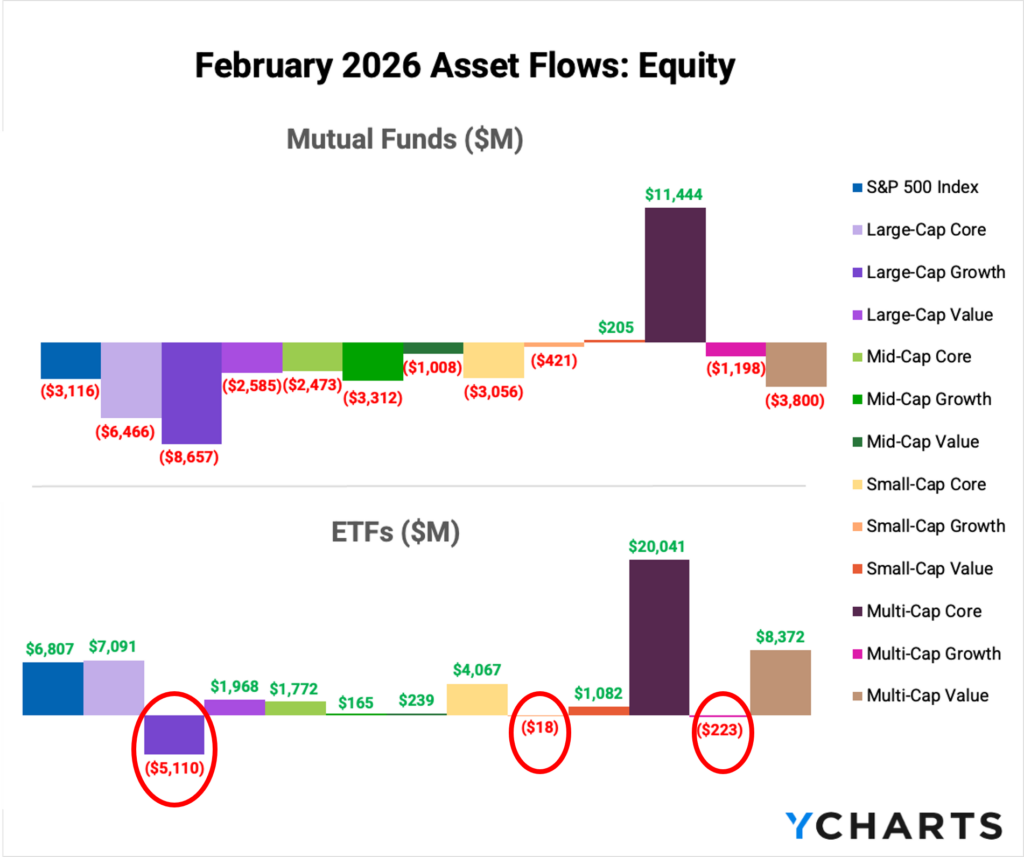
February 2026 Fund Flows Summary
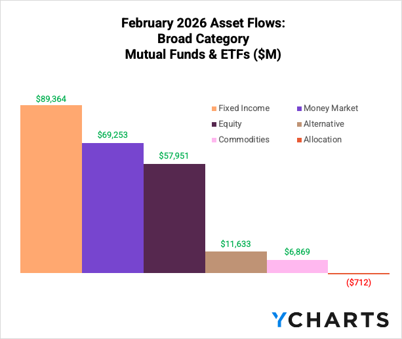
Before diving into the category level, we should set the stage that this rotation hasn’t scared investors away from stocks. In fact, equity mutual funds and ETFs attracted nearly $60B in assets in February.
Subscribe to the Fund Flow Report
Sign up for our free monthly Fund Flow Report to stay updated on how assets are moving in and out of these strategies:
And when looking at ETFs, which have almost exclusively brought in assets over the past couple of years, growth funds, except mid, saw net outflows in aggregate across sizes.
Further indicating that investors are seeking solutions for other areas of their portfolio.
Subscribe to the Fund Flow Report
Large-Cap Value ETF Flows
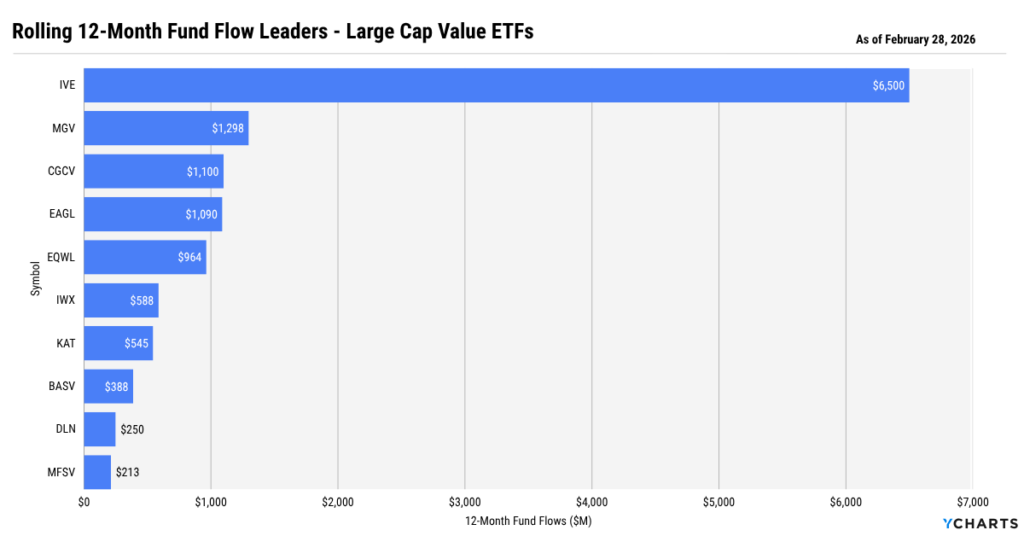
Like most things, cumulative flows don’t tell the full story—especially as allocations continue to migrate toward ETFs. Within large-cap value, ETF flows have held up well over the past year, with the category taking in roughly $14B in net inflows.
Over that period, the iShares S&P 500 Value ETF (IVE) has been the clear leader, gathering $6.5B (12.8% of AUM), followed by the Vanguard Mega Cap Value ETF (MGV), which has brought in $1.3B (11% of AUM).
Subscribe to the Fund Flow Report
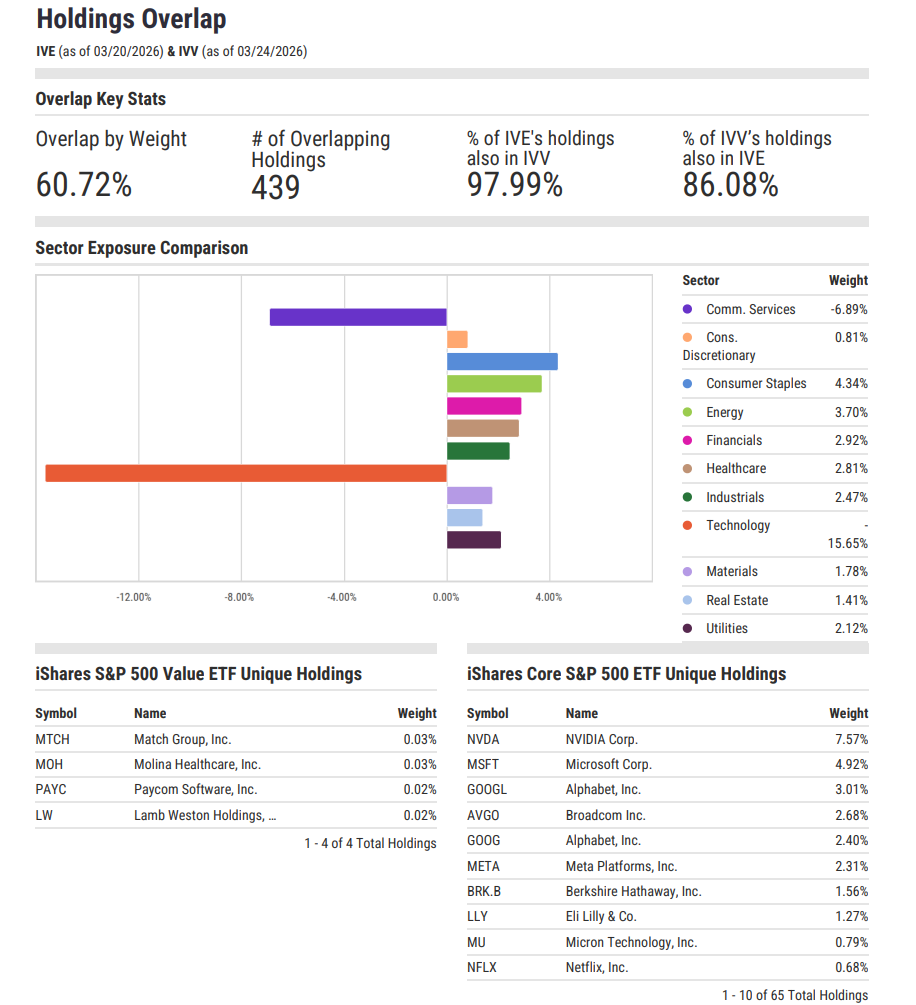
Looking under the hood, both strategies reflect a rotation that is less about moving into entirely new securities and more about reweighting within the existing universe. In the case of IVE relative to the S&P 500, that means a meaningful underweight to technology (-15.7%) and increased exposure to sectors like energy (+3.7%), financials (+2.9%), industrials (+2.5%), and consumer staples (+4.3%), areas that are driving performance and align with the HALO framework.
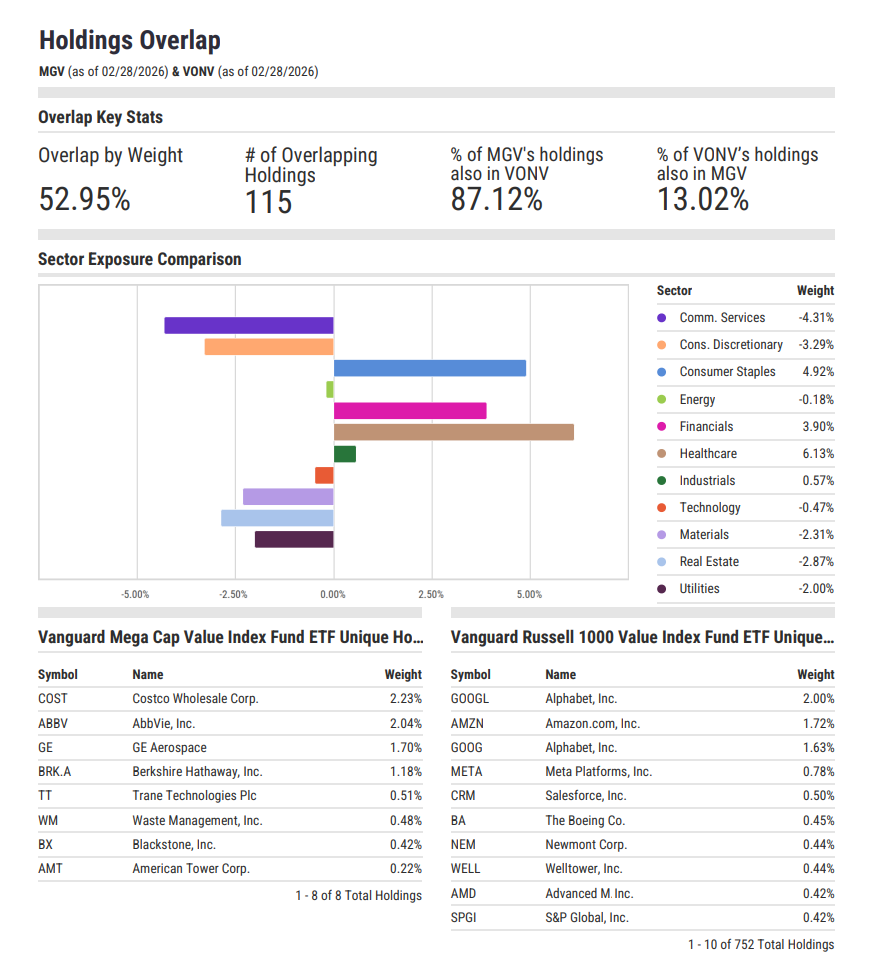
If we look at MGV relative to the Russell 1000 Value benchmark (VONV as a proxy), it maintains significant overlap (53% by weight across 115 holdings) while expressing tilts toward consumer staples (+4.9%), financials (+3.9%), and healthcare (+6.1%).
After the leaders, more differentiated strategies like the Capital Group Conservative Equity ETF (CGCV) and the Eagle Capital Select Equity ETF (EAGL) have each gathered just over $1B in flows, representing 73.1% of AUM and 28.5% of AUM, respectively. Rounding out the group, the Invesco S&P 100 Equal Weight ETF (EQWL) has attracted nearly $1B in inflows, with over 40% of AUM added over the past year.
Multi-Cap Value ETF Flows
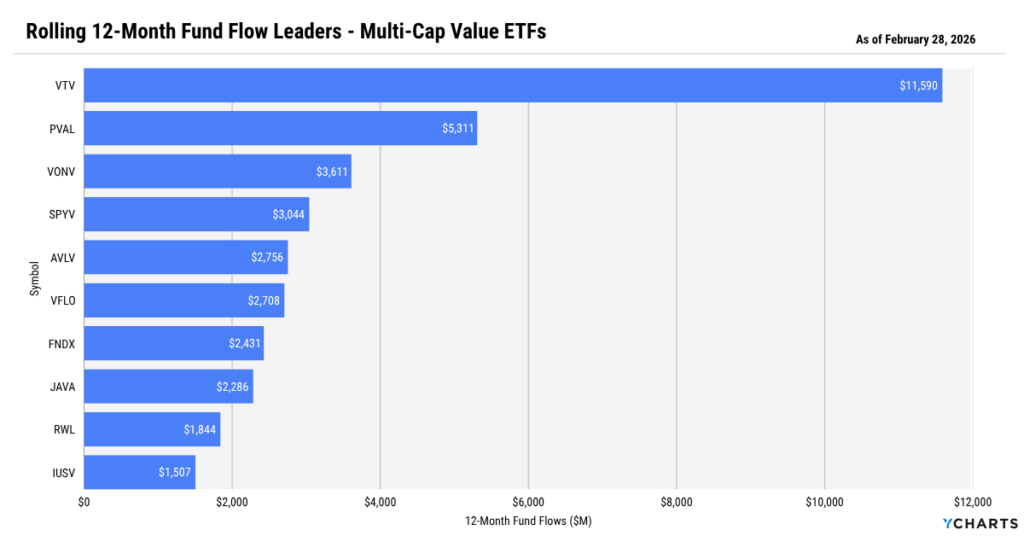
Multi-cap value ETFs have seen stronger asset gathering, pulling in roughly $32B over the past 12 months.
Much of that demand has concentrated in low-cost, beta exposures. The Vanguard Value ETF (VTV) leads with $11.6B in inflows, followed by the Vanguard Russell 1000 Value ETF (VONV) and the SPDR Portfolio S&P 500 Value ETF (SPYV), each with over $3B in inflows.
Subscribe to the Fund Flow Report
Under the surface, these strategies are also reweighting within the same universe. Relative to the S&P 500, they are consistently overweight energy (3–4%), industrials (2–5.5%), and consumer staples (2–4%), while remaining underweight technology (-15–22%), reinforcing the shift toward more asset-heavy sectors.
Beyond low-cost beta, flows have also moved into more differentiated strategies. The Putnam Focused Large Cap Value ETF (PVAL) has attracted $5.3B in flows, over 60% of AUM, while maintaining low overlap (~20%) withthe Russell 1000 Value benchmark.
It is selectively overweight in names such as Citigroup, ExxonMobil, Coca-Cola, and Freeport-McMoRan, while remaining underweight financials and technology sectors.

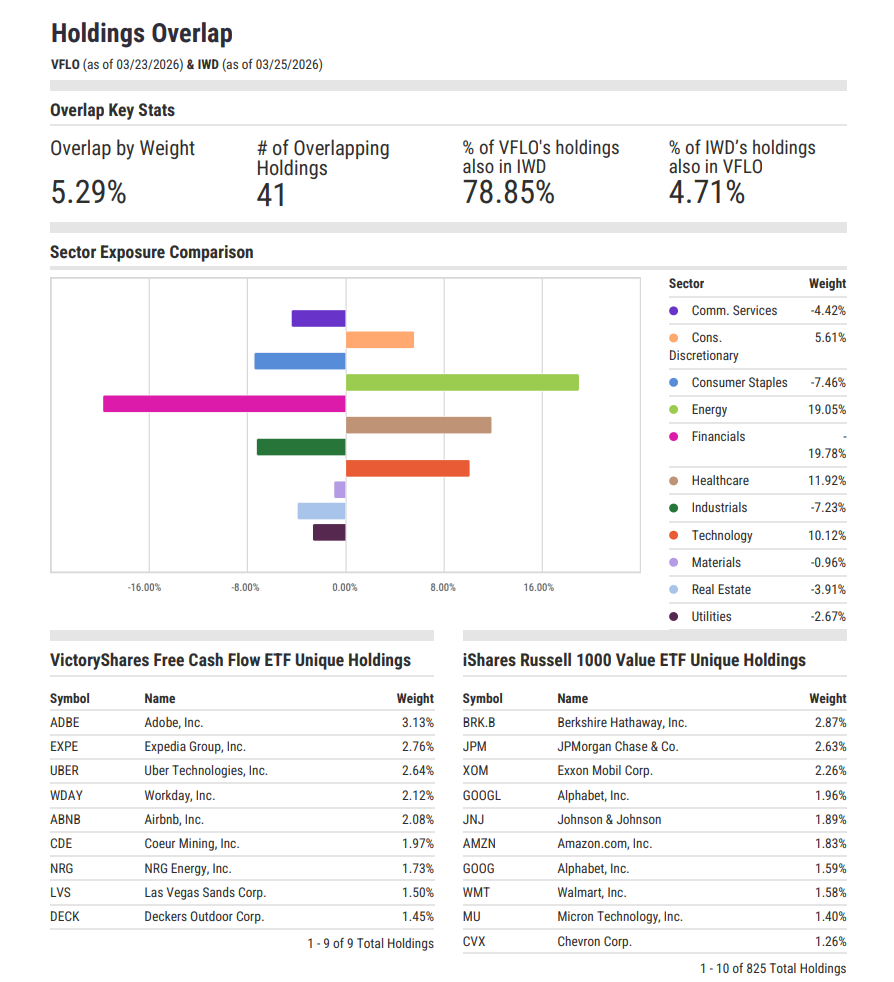
The VictoryShares Free Cash Flow ETF (VFLO) reflects an even more differentiated approach, bringing in approximately $2.7B in flows, or roughly 43% of AUM. Its positioning is more concentrated at the sector level, with a significant overweight to energy (~19%) and healthcare (~12%), largely underweight financials (~-20%) and industrials (~-7%), and, interestingly, a 10% overweight to technology.
Taken together, these flows highlight ETFs capturing the rotation through incremental tilts and more differentiated strategies through concentrated positioning.
This is further reinforced by continued demand for other value strategies. The Avantis US Large Cap Value ETF (AVLV) has gathered $2.8B (26% of AUM), while the Schwab Fundamental US Large Company ETF (FNDX) has brought in $2.4B (10% of AUM).
Flows Confirm the Shift in Leadership
While much of the attention has been on the drawdowns in mega-cap technology, performance, and flows across both large- and multi-cap value ETFs suggest that investors are reallocating toward sectors and strategies tied more closely to real assets, cash flow, and economic activity.
This shift is showing up across implementation styles—index strategies capturing incremental sector tilts, active ETFs applying more selective positioning, and systematic approaches reinforcing a broader trend: capital is being redistributed toward areas of the market better aligned with the current environment, including geopolitical uncertainty and longer-term balance sheet pressures.
To stay abreast of how investor allocations continue to evolve, subscribe to the Fund Flow Report.
Ready to Move On From Your Investment Research and Analytics Platform?
Sign up for a copy of our Fund Flows Report: to keep tabs on flows into ETFs and Mutual Funds:
Sign up for our free monthly Fund Flow Report:Follow YCharts Social Media to Unlock More Content!
*Legacy Provider’s name withheld due to respect of our competitors
Next Article
How Markets Absorb Geopolitical Uncertainty Over TimeRead More →