Can You Hedge Volatility with an ETF?
As advisors know all too well, some clients just can’t stomach the day-to-day jerkiness of markets these days. More critically, volatility can also impact availability of capital. Purpose-built “limited volatility” or “low vol” funds, which screen out volatile stocks, have risen in popularity to join short-term treasuries as common volatility hedges.
For the opportunists, derivatives-based products like iPath® B S&P 500® VIX Short-Term Futures™ ETN (VXX) have emerged to offer upside when volatility surges.
Of these presented options, do any of these assets actually offer the benefits of less severe drawdowns and more stability? And, for ease of implementation, will an exchange-traded fund (ETF) do the trick for hedging the average portfolio against volatility?
To better answer these questions, we examined how different hedging strategies performed during historically significant periods of volatility. Our findings shed light on the potential benefits and drawbacks of hedging with ETFs when added to a hypothetical, balanced portfolio of 60% equity, 40% fixed income.
Download the new White Paper—which also looks into hedging inflation, market crashes, geopolitical risk, and climate change using ETFs—for our full findings:
The Best Inflation Hedges in 2020 and 2021
Our full Can You Hedge It with an ETF? white paper uses three distinct periods of increased volatility to measure the efficacy of hedging with different ETFs. Here, we focus on the most recent bout of volatility.
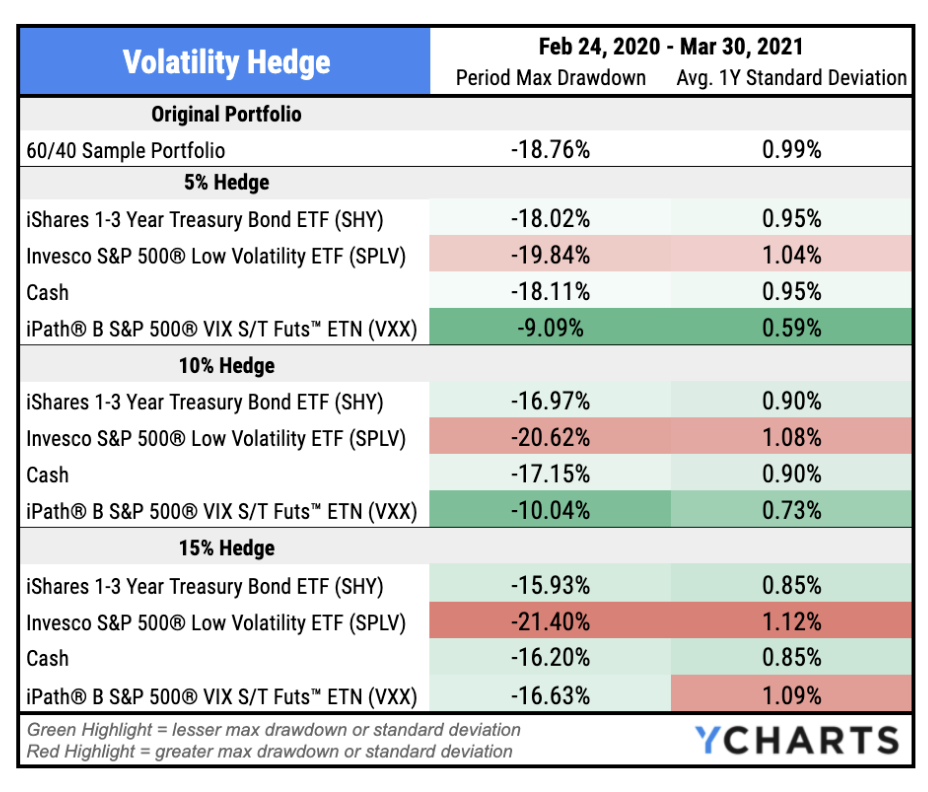
The CBOE S&P 500 Volatility Index set an all-time record high of 82.69 on March 16, 2020, then lowered slowly but remained elevated through the start of 2021. Two volatility hedges stood out during the period, but for opposite reasons.
Although built for just this occasion, the Invesco S&P 500® Low Volatility ETF (SPLV) worsened max drawdown by more than a couple percentage points. At the same time, just a 5% hedge using the iPath® B S&P 500® VIX S/T Futs™ ETN (VXX) cut the Sample 60/40 Portfolio’s drawdowns in half, and nearly did the same to its standard deviation.
Download Visual | See the Full White Paper
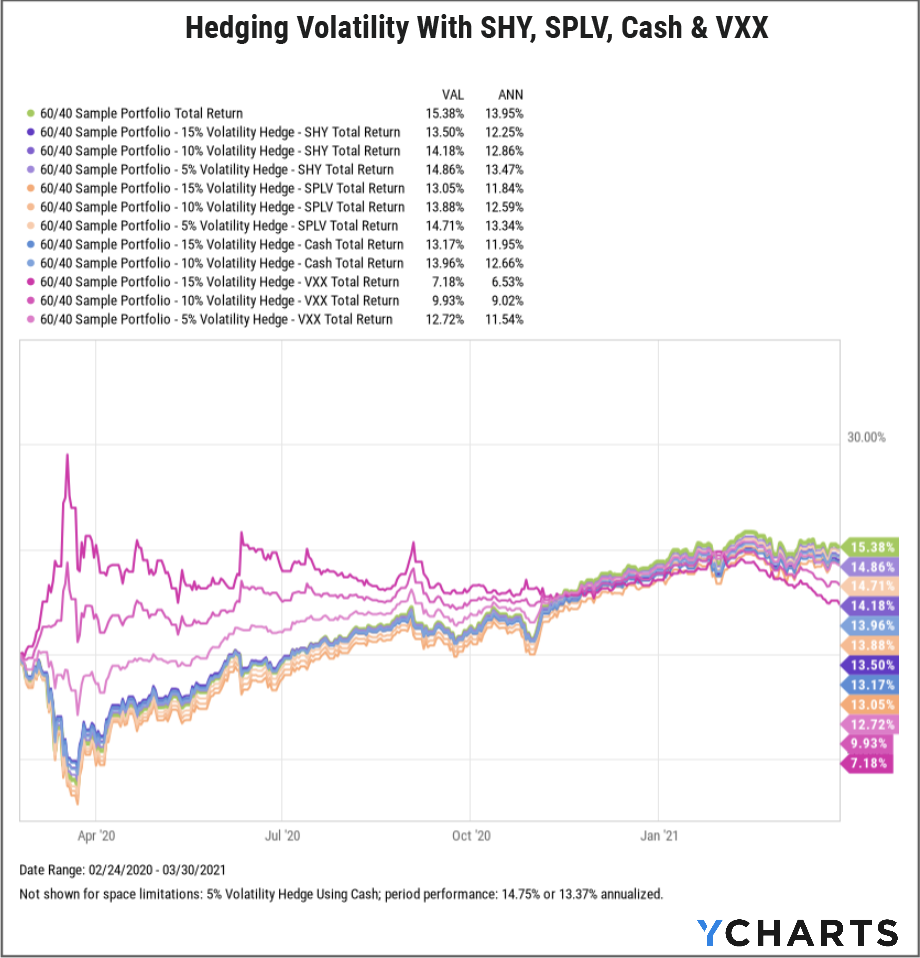
As the VIX fell from its record-high and “high volatility” territory, investors’ confidence returned and each of the hedges examined finished with worse returns compared to the Sample 60/40 Portfolio.
During the record-setting VIX spike, hedging with the Invesco S&P 500® Low Volatility ETF (SPLV) not only dampened performance but also caused more severe drawdowns. The iPath® B S&P 500® VIX S/T Futs™ ETN (VXX) shone bright early on, but burned out quickly as the VIX and investor sentiment both reset.
This portfolio performance chart with the volatility hedges applied at varying allocations points toward the importance of timing. When maintained through the VIX’s decline, a volatility hedge using these ETFs tended to worsen performance.
Download Visual | See the Full White Paper
To see whether ETF hedges were effective during other historical periods of volatility, as well as for other risk factors such as inflation, a stock market crash, geopolitical turmoil, a weakening US Dollar, or climate change, download the FREE white paper:
Connect With YCharts
To get in touch, contact YCharts via email at hello@ycharts.com or by phone at (866) 965-7552
Interested in adding YCharts to your technology stack? Sign up for a 7-Day Free Trial.
Disclaimer
©2022 YCharts, Inc. All Rights Reserved. YCharts, Inc. (“YCharts”) is not registered with the U.S. Securities and Exchange Commission (or with the securities regulatory authority or body of any state or any other jurisdiction) as an investment adviser, broker-dealer or in any other capacity, and does not purport to provide investment advice or make investment recommendations. This report has been generated through application of the analytical tools and data provided through ycharts.com and is intended solely to assist you or your investment or other adviser(s) in conducting investment research. You should not construe this report as an offer to buy or sell, as a solicitation of an offer to buy or sell, or as a recommendation to buy, sell, hold or trade, any security or other financial instrument. For further information regarding your use of this report, please go to: ycharts.com/about/disclosure
Next Article
How Strong Are Your Diamond Hands? with RAMP CapitalRead More →