Weekly Market Pulse: April 28–May 2, 2025 – Navigating Tech Earnings, Trade Talks, and Employment Trends

Introduction: Why This Week Matters for Markets and Advisors
The final week of April 2025 brought a pivotal mix of strong tech earnings, renewed signals from U.S.-China trade negotiations, and a robust U.S. jobs report—each contributing to a surge in investor optimism and new questions for market watchers. Microsoft and Meta delivered blockbuster results, reigniting enthusiasm in the tech sector and lifting major indices. Meanwhile, Harley-Davidson’s earnings miss underscored persistent global cost pressures, and better-than-expected job growth complicated the outlook for Fed policy and inflation.
This blog offers a consolidated, data-rich look at the week’s most market-moving developments—translating them into actionable insights for financial advisors, asset managers, and institutional investors.
What You’ll Learn in This Pulse:
- • How corporate earnings from tech and industrial leaders are reshaping market leadership
- • What China’s shifting stance on trade means for tariff-sensitive sectors
- • Why April’s job growth may recalibrate expectations for rate cuts in 2025
- • Which YCharts tools can help you visualize and act on these trends in real time
Let’s dive into the data—and its implications for your portfolio decisions.
Explore More on YCharts
How New U.S. Tariffs Could Create Winners
iShares, PIMCO, and Fidelity Are Leading the Charge in Active Fixed Income ETFs
Market Overview: Indices Respond to Tech Earnings and Trade Developments
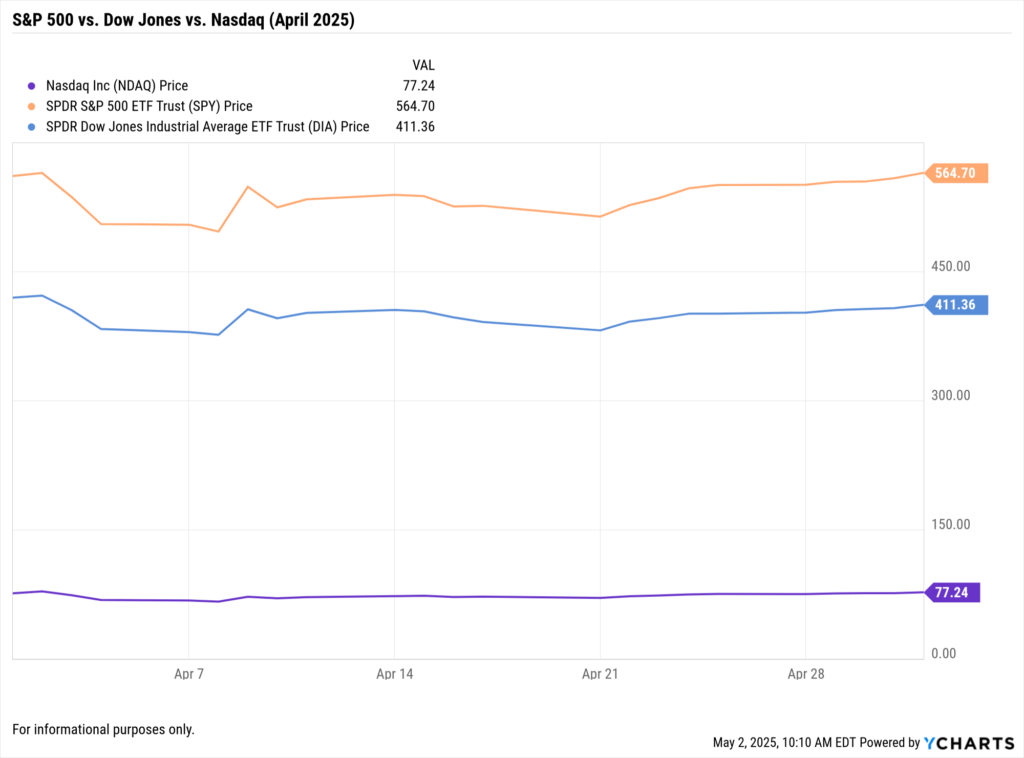
S&P 500: Closed at 5,611.85, up 1.6% for the week.
Dow Jones Industrial Average: Ended at 40,752.96, gaining 1.3%.
Nasdaq Composite: Finished at 17,382.94, rising 2.1%.
Market Insight: Major indices posted gains driven by robust tech earnings, particularly from Microsoft and Meta. Investor sentiment was further bolstered by potential easing in U.S.-China trade tensions.
What to Watch:
- • Sustainability of tech sector momentum.
- • Developments in U.S.-China trade negotiations.
- • Upcoming economic indicators that could influence market direction.
Corporate Earnings Highlights
Microsoft (MSFT): Cloud and AI Drive Strong Performance
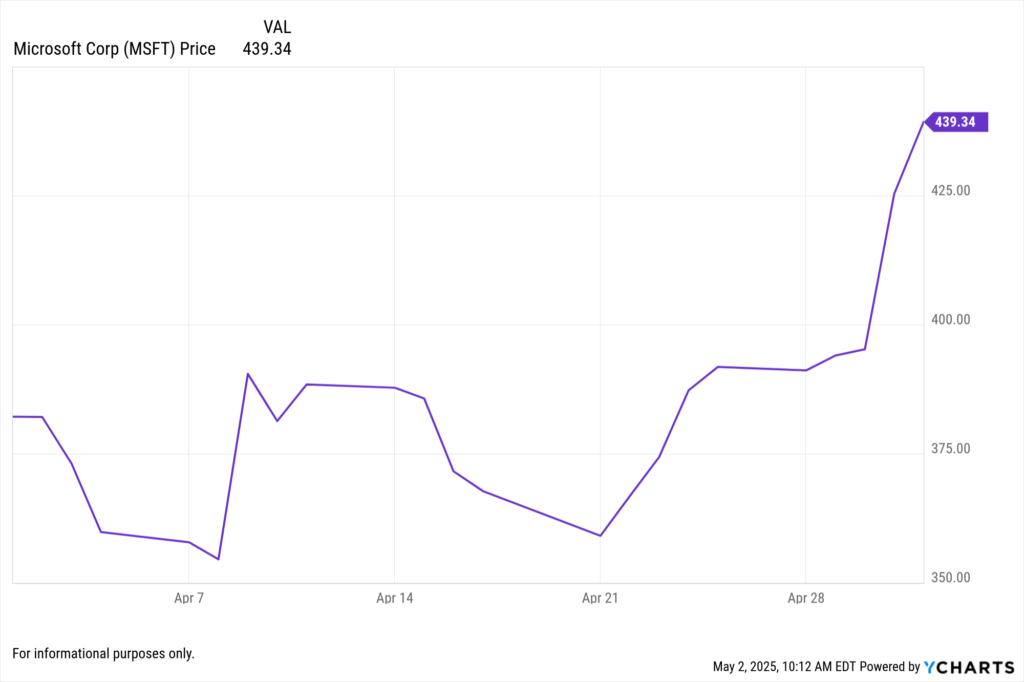
Revenue: $70.07B (↑14% YoY)
EPS: $3.46 vs. $3.22 expected
Intelligent Cloud Revenue: $42.4B (↑20% YoY)
Market Insight: Microsoft’s growth in cloud services and AI integration underscores its leadership in enterprise solutions. This performance reflects broader trends in digital transformation and enterprise spending.
YCharts Tool to Explore: Utilize the Fundamental Chart to analyze Microsoft’s revenue and EPS trends over the past quarters.
What to Watch:
- • Continued adoption of AI and cloud services across industries.
- • Impact of enterprise spending patterns on tech sector performance.
- • Microsoft’s role in shaping future technological advancements.
Meta Platforms (META): Advertising Revenue Rebounds
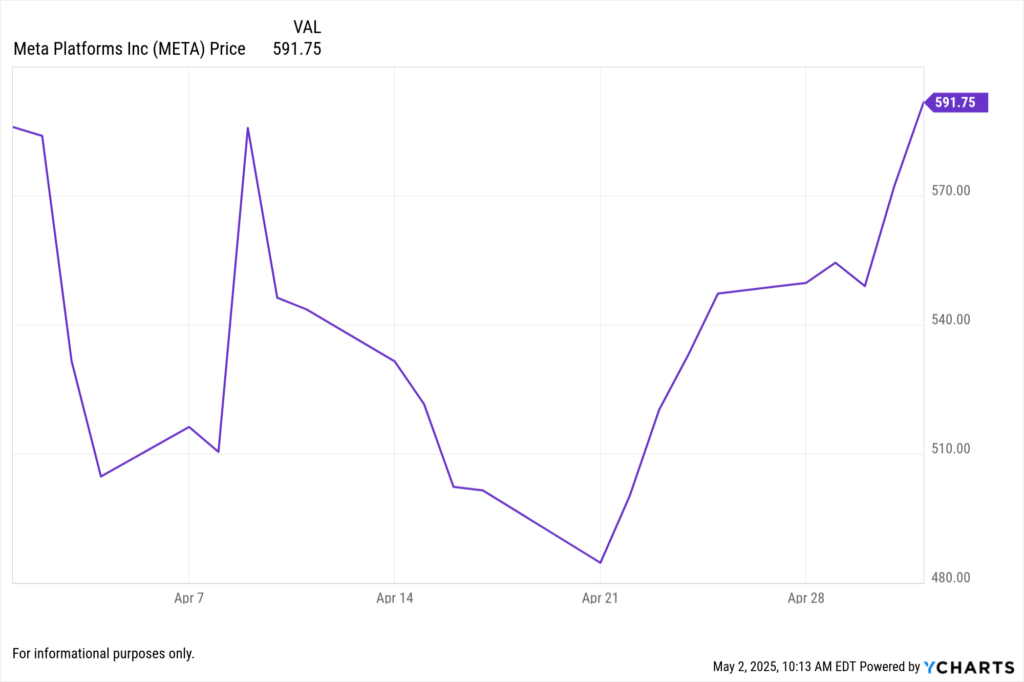
Revenue: $42.31B (↑16% YoY)
EPS: $6.43 vs. $5.92 expected
Key Drivers: Growth in Instagram and Reels monetization; enhanced ad targeting through AI.
Market Insight: Meta’s strong performance indicates a resurgence in digital advertising, signaling increased marketing budgets and consumer engagement.
YCharts Tool to Explore: Leverage Custom Reports to compare Meta’s advertising revenue trends with clients.
What to Watch:
- • Trends in digital advertising spend across sectors.
- • Meta’s innovation in ad targeting and user engagement.
- • Regulatory developments affecting digital advertising platforms.
Harley-Davidson (HOG): Tariffs and Global Challenges Impact Earnings
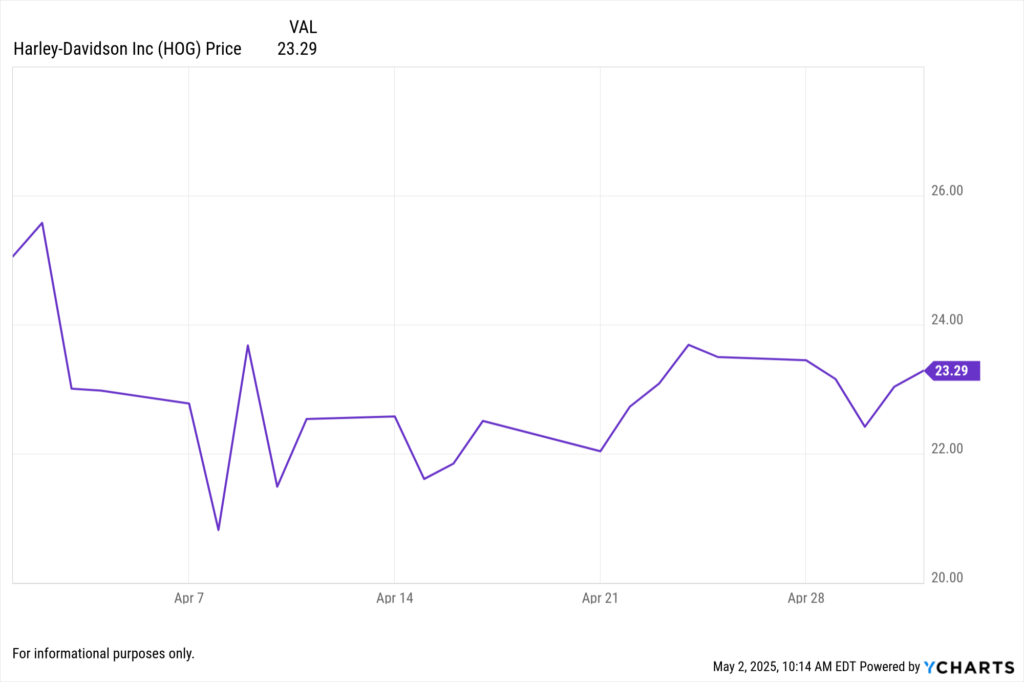
Revenue: $1.33B (↓27% YoY)
Global Motorcycle Retail Sales: ↓21%
Tariff Costs: Projected to rise to $175M in 2025
Market Insight: Harley-Davidson’s results highlight the vulnerabilities of manufacturers to global trade policies and economic uncertainties. The withdrawal of full-year guidance reflects the challenges in forecasting amidst such volatility.
YCharts Tool to Explore: Use the Holdings Overlap Tool to assess exposure to companies affected by international trade dynamics.
What to Watch:
- • Evolving trade agreements and their impact on manufacturing.
- • Consumer demand trends for discretionary goods.
- • Strategies by manufacturers to mitigate tariff-related costs.
U.S.-China Trade Relations: Signs of Thaw Amid Economic Pressures
Key Developments:
- • China’s Commerce Ministry signaled openness to resuming trade talks, contingent on U.S. actions regarding tariffs.
- • Economic indicators from China show factory activity contraction and rising unemployment, adding urgency to negotiations.
Market Insight: Potential easing of trade tensions could benefit multinational corporations and sectors reliant on global supply chains. However, the path to resolution remains uncertain, requiring close monitoring.
What to Watch:
- • Announcements from upcoming trade discussions or policy shifts.
- • Performance of export-driven industries and companies with significant exposure to China.
- • Currency fluctuations and their impact on international trade.
Economic Indicators: April Employment Report Surpasses Expectations
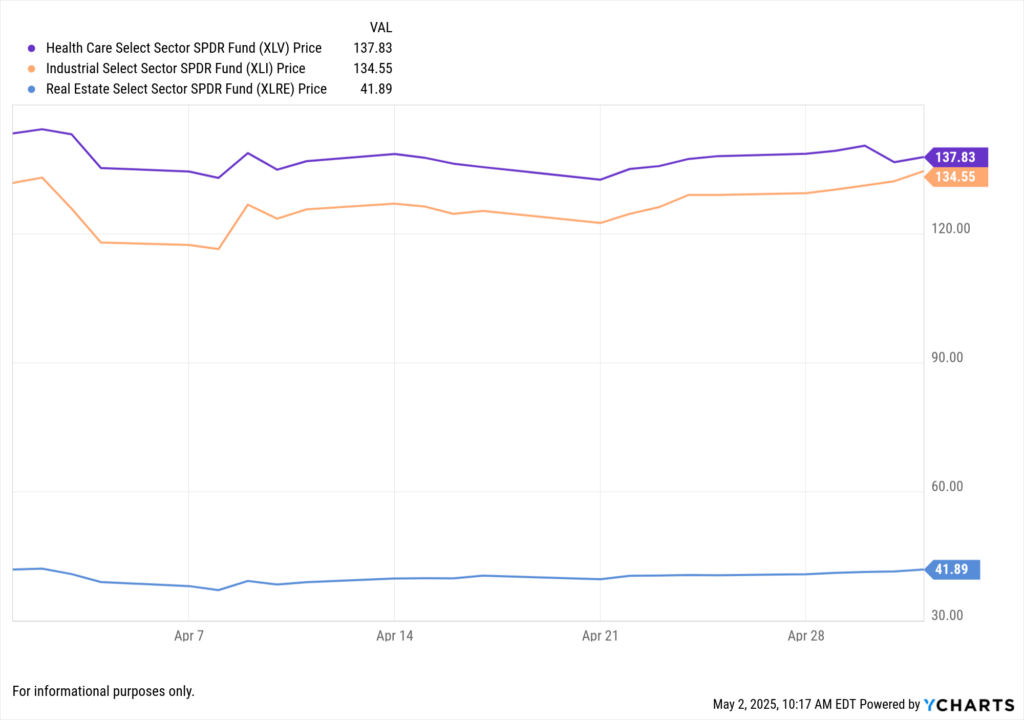
Jobs Added: 177,000 (vs. 135,000 expected)
Unemployment Rate: 4.2%
Sector Highlights: Healthcare (+51,000), Transportation and Warehousing (+29,000), Construction (+11,000)
Wage Growth: Average hourly earnings up 0.2% MoM; 3.8% YoY
Market Insight: The stronger-than-expected job growth suggests resilience in the labor market, potentially influencing Federal Reserve policy decisions. Moderate wage growth may alleviate some inflationary pressures.
YCharts Tool to Explore: Explore Economic Indicators to track labor market trends and their implications for monetary policy.
What to Watch:
- • Upcoming Federal Reserve statements and interest rate decisions.
- • Inflation data releases and their alignment with employment trends.
- • Sector-specific employment shifts indicating broader economic trends.
Implications for Advisors and Asset Managers
Tech Sector Opportunities: Strong earnings from Microsoft and Meta highlight growth potential in cloud computing and digital advertising.
Trade Policy Monitoring: Developments in U.S.-China relations could impact sectors like manufacturing, technology, and agriculture.
Economic Indicators: Robust employment data may influence interest rate expectations and fixed income strategies.
Portfolio Diversification: Given sector-specific volatilities, diversification remains key to managing risk and capitalizing on growth areas.
How YCharts Can Enhance Your Strategy
Fundamental Charts: Analyze company performance metrics over time to identify trends and investment opportunities.
Custom Reports: Generate client-ready reports with up-to-date market data and insights.
Economic Indicators: Stay informed on macroeconomic trends that influence investment decisions.
Conclusion
This week underscored the dynamic interplay between corporate earnings, international trade relations, and economic indicators. For financial professionals, staying attuned to these developments is crucial for informed decision-making. Leveraging tools like YCharts can provide the necessary insights to navigate the evolving financial landscape effectively.
Whenever you’re ready, here’s how YCharts can help you:
1. Looking to Move On From Your Investment Research and Analytics Platform?
2. Want to test out YCharts for free?
Start a no-risk 7-Day Free Trial.
Disclaimer
©2025 YCharts, Inc. All Rights Reserved. YCharts, Inc. (“YCharts”) is not registered with the U.S. Securities and Exchange Commission (or with the securities regulatory authority or body of any state or any other jurisdiction) as an investment adviser, broker-dealer or in any other capacity, and does not purport to provide investment advice or make investment recommendations. This report has been generated through application of the analytical tools and data provided through ycharts.com and is intended solely to assist you or your investment or other adviser(s) in conducting investment research. You should not construe this report as an offer to buy or sell, as a solicitation of an offer to buy or sell, or as a recommendation to buy, sell, hold or trade, any security or other financial instrument. For further information regarding your use of this report, please go to: ycharts.com/about/disclosure
Next Article
Economic Update: Reviewing Q1 2025Read More →
