What Is Inflation Doing to the Market? A Comprehensive Analysis for Advisors

Introduction
Understanding what is inflation doing to the market has never been more critical for investment advisors navigating today’s complex economic environment. With the Federal Reserve maintaining its target range at 4.25-4.50% (effective rate 4.33%) amid persistent inflationary pressures and emerging labor market weakness, the implications extend far beyond simple price movements into fundamental changes in how markets operate.
This comprehensive analysis serves as the cornerstone of our Inflation Impact Hub, providing advisors with the essential framework to understand how inflation is reshaping investment landscapes, client portfolios, and the broader economy. The inflation market impact touches everything from sector rotation patterns to housing affordability, creating both challenges and opportunities that require sophisticated analysis and strategic positioning.
Table of Contents
The Current Inflation Environment
The U.S. economy presents a complex picture of resilient growth alongside persistent inflation concerns and emerging labor market weakness:
- Federal Reserve Policy Stance: The Federal Reserve maintains its target range at 4.25-4.50% (effective rate 4.33%), holding steady through five FOMC meetings in 2025 despite growing internal debate. July’s meeting saw two dissenting votes favoring cuts, the first dissent in nearly five years.
- Economic Growth Momentum: Q2 2025 GDP expanded at a 3.0% annualized rate, exceeding expectations and accelerating from Q1’s 2.1%. However, this growth comes with concerning underlying dynamics in the labor market.
- Stubborn Inflation Pressures: Core PCE inflation at 2.8% year-over-year (June 2025) remains meaningfully above the Fed’s 2% target. July CPI data shows headline inflation at 2.7% year-over-year with core CPI even higher at 3.1%, driven by persistent services inflation at 4.9% annually.
- Deteriorating Labor Conditions: July unemployment rose to 4.2%, with only 73,000 jobs added, the weakest showing since December 2023. Combined with -258,000 in downward revisions to prior months, the labor market shows clear signs of cooling.
- Financial Market Dynamics: The 10-year Treasury yields 4.37%, creating an essentially flat yield curve versus fed funds at 4.33%. This unusual configuration reflects market uncertainty about the Fed’s next moves amid conflicting economic signals.
- Housing Market Stress: Despite mortgage rates declining to 6.58% (lowest since October 2024), housing remains severely constrained. The median home price of $422,800 combined with elevated rates keeps affordability near crisis levels.
These dynamics paint a picture of an economy facing genuine cross-currents: GDP growth surprising upward while employment deteriorates, inflation proving sticky while housing crumbles. The 4 basis point spread between fed funds (4.33%) and 10-year Treasury (4.37%) represents an essentially flat curve, not normalization, while the Fed’s restrictive stance continues with real rates at approximately 1.5%.

How the Federal Reserve Controls Inflation and Market Impact
The Federal Reserve’s approach to controlling inflation represents one of the most powerful forces shaping modern financial markets. Understanding this mechanism is essential for advisors seeking to position portfolios effectively in an inflationary environment.
The Rate-Setting Architecture
The Federal Open Market Committee (FOMC) meets eight times annually to assess economic conditions and set the federal funds rate target. This process involves comprehensive analysis of employment data, inflation measures (both headline and core), GDP growth, and financial market conditions. July unemployment at 4.2% provides context for the Fed’s dual mandate of maximum employment and price stability.
The Fed operates sophisticated models that incorporate hundreds of economic variables, from labor market slack to housing prices, creating a complex web of relationships that inform policy decisions. The current target range of 4.25-4.50% (effective rate 4.33%) reflects the committee’s assessment that monetary policy must remain restrictive given Core PCE inflation at 2.8%, meaningfully above the 2% target for 18 consecutive months. However, with inflation moderating and economic conditions evolving, several factors could prompt a policy shift. Our analysis identifies 6 specific reasons the Fed would cut rates, including key thresholds advisors should monitor.
Transmission Mechanisms: From Fed Funds to Market Reality
When the Fed adjusts the federal funds rate, the impact flows through the economy via multiple channels that create the inflation market impact advisors observe daily. The immediate effect appears in money markets, with short-term Treasury yields typically moving in tandem with Fed policy. The current spread between fed funds (4.33%) and short-term Treasuries reflects market expectations and liquidity conditions.
Long-term rate dynamics prove more complex, as longer-duration bonds incorporate expectations of future Fed policy, inflation, and economic growth. The relationship between current policy rates and long-term yields creates the yield curve shape that influences investment decisions across asset classes. With the 10-year Treasury at 4.37%, markets are pricing in specific expectations about the future path of monetary policy.
Quantitative Policy and Balance Sheet Management
Beyond traditional rate policy, the Federal Reserve’s balance sheet (approximately $6.7 trillion in total assets) continues to influence Treasury markets through quantitative tightening at $60B Treasuries/$35B MBS monthly runoff. The Fed’s Treasury holdings create effective duration supply as securities mature without reinvestment, potentially affecting longer-term yields and market liquidity. This process adds another layer of complexity to the transmission mechanism, as reduced Fed participation in Treasury markets affects price discovery and liquidity provision.
Political pressures and Fed independence create additional market uncertainty. Election cycle considerations, Congressional oversight of Fed mandates, and public debate about monetary policy contribute to volatility and policy uncertainty. Fed Chair communications serve as crucial market-moving events, with forward guidance representing a key policy tool in the modern Fed’s arsenal. The Fed’s stance remains firmly restrictive, with real rates (fed funds minus core PCE) at approximately 1.5%, continuing to restrain economic activity despite July’s first dissenting votes in nearly five years.
The Current Inflation Reality: What Advisors Need to Know
Understanding the Real Inflation Picture
While headline inflation figures capture media attention, the underlying inflation dynamics reveal a more nuanced story crucial for investment decision-making. Core measures exclude volatile food and energy components, providing clearer insight into persistent inflationary pressures. The current core inflation rate of 2.8% (Core PCE, June) compared to headline inflation of 2.7% (CPI, July) demonstrates this divergence and its importance for policy decisions. More concerning, core CPI runs even higher at 3.1%, driven by services inflation at 4.9% annually.
Service sector inflation continues as the largest component of inflationary pressure, particularly housing-related costs that affect both consumer spending power and investment returns. Services inflation proves more persistent than goods inflation, creating challenges for Fed policy and investment strategies alike. Many goods categories have experienced deflation or disinflation, partly offsetting service sector pressures, but this divergence complicates both policy decisions and portfolio positioning.
Regional and Sector-Specific Variations
Inflation affects different markets and regions unequally, creating opportunities and challenges for geographically diversified portfolios. High-cost metropolitan areas experience different inflationary pressures than rural markets, with housing costs driving much of this variation. Understanding these regional differences helps advisors position client portfolios to benefit from inflation’s uneven impact.
Supply chain improvements have contributed to goods disinflation in many categories, while labor-intensive services continue to see persistent price increases. This divergence reflects structural changes in the post-pandemic economy that may prove more durable than initially anticipated, requiring long-term strategic adjustments in portfolio construction and asset allocation decisions.
Understanding how persistent inflation influences Federal Reserve policy decisions becomes crucial for
investors positioning portfolios. While current data supports rate cut expectations, our comprehensive
analysis of 6 reasons the Fed would hold rates examines scenarios where policymakers might prioritize
inflation control over accommodation despite market pressure for easing.
Treasury and Bond Market Dynamics in an Inflationary Environment
Yield Curve Analysis and Market Expectations
The Treasury yield curve reflects market expectations for future Fed policy, inflation, and economic growth, providing crucial insight for fixed-income positioning. Current curve dynamics reveal important themes about inflation expectations and policy trajectory. With fed funds at 4.33% and 10-year Treasuries at 4.37%, the essentially flat yield curve indicates market uncertainty about the Fed’s next moves amid conflicting economic signals.
Term premiums – the additional yield investors demand for holding longer-duration bonds – reflect inflation uncertainty and monetary policy expectations. Treasury Inflation-Protected Securities (TIPS) provide insight into real yield expectations, with the TIPS-Treasury spread indicating market-based inflation expectations that advisors can use to gauge inflation market impact across different time horizons.
Interested in how the financial sector reacts to interest rates? Read our analysis on How Financials Navigate a Falling Rate Cycle.
Corporate Bond Considerations
Investment-grade and high-yield corporate bonds face multiple pressures in an inflationary environment that require careful credit analysis. Higher base rates increase the cost of capital for all borrowers, while inflation affects different companies’ ability to service debt based on their pricing power, competitive position, and operational leverage.
Credit spread dynamics become crucial as duration risk creates significant price sensitivity to interest rate changes. Longer-duration corporate bonds face substantial volatility, creating both risk and opportunity for active managers who can navigate credit selection and duration positioning effectively.
Advanced bond analysis and yield curve tools are available through YCharts comprehensive financial data platform for detailed market analysis.
The Housing Affordability Crisis: Inflation’s Most Visible Impact
Mortgage Rate Transmission and Market Dynamics
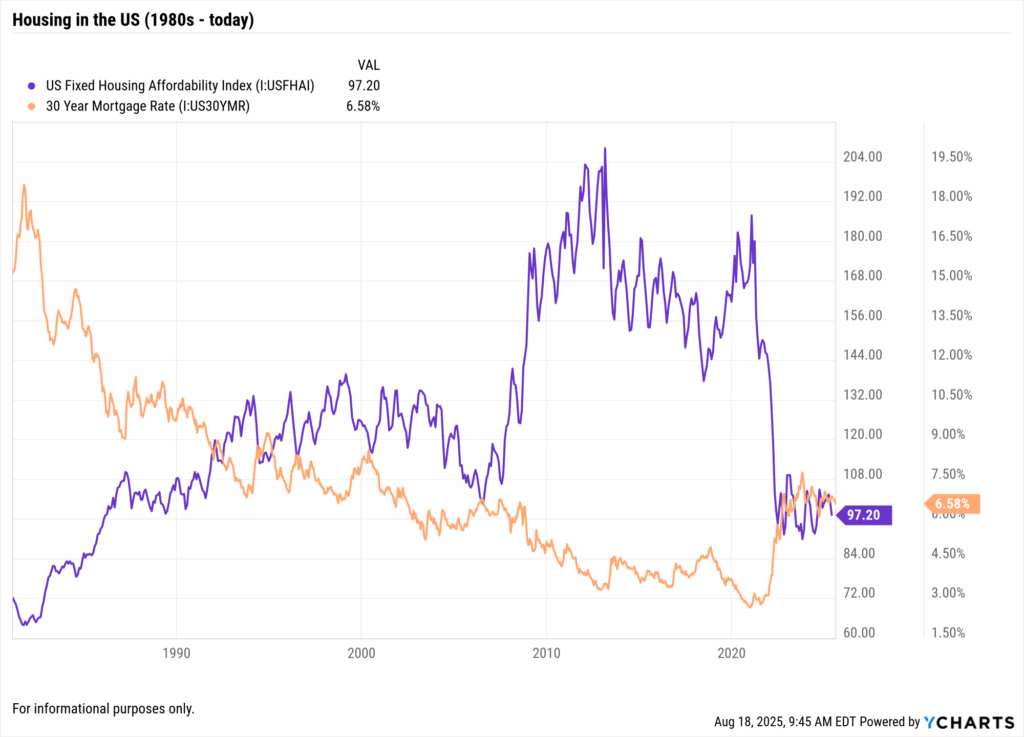
The relationship between Fed policy and mortgage rates demonstrates the real-world impact of monetary policy on American families and investment opportunities. While mortgage rates don’t move lockstep with fed funds, the general direction and magnitude create significant economic effects. Current 30-year mortgage rates at 6.58% compared to the Fed funds rate of 4.33% show the continuing complexity of rate transmission through the mortgage market. Despite improvement from April’s 7.12% peak, a median-priced home requires a $2,157 monthly payment, 62% higher than in 2021.
Regional variations in affordability create different investment opportunities and risks across geographic markets. Different metropolitan areas experience varying degrees of affordability pressure based on local economic conditions, supply constraints, demographic trends, and regulatory environments. These variations create opportunities for geographically diversified real estate strategies while highlighting risks in overheated markets.
Renter vs. Buyer Economic Analysis
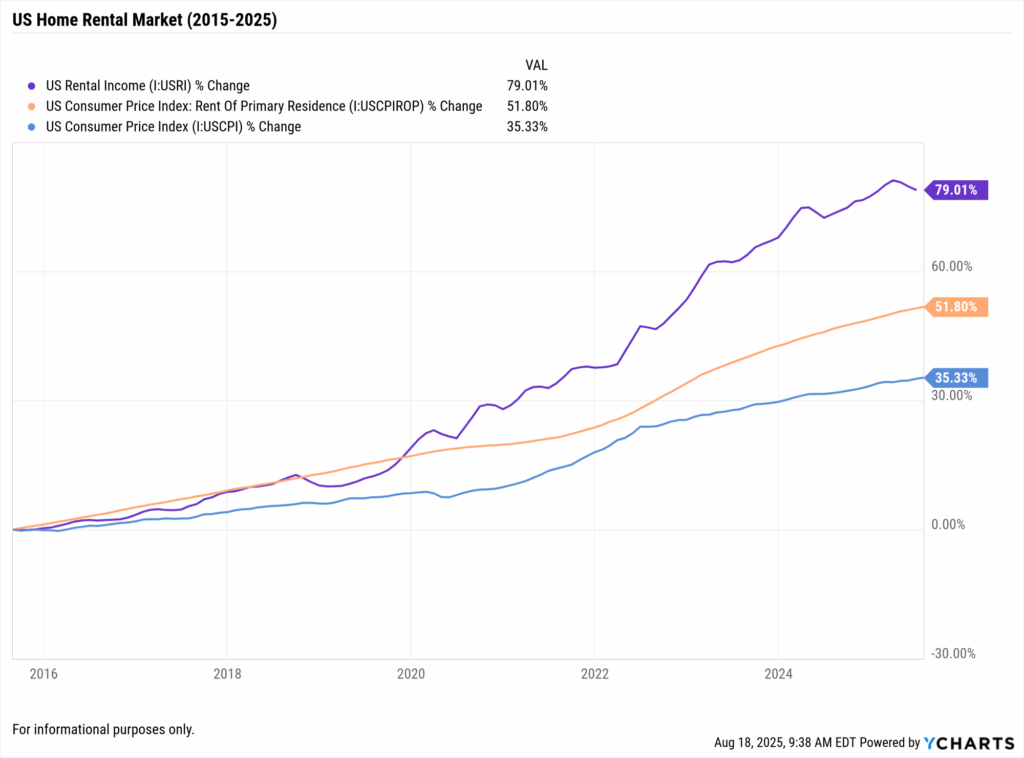
Current market conditions have fundamentally altered the rent-versus-buy calculation that affects both real estate investment opportunities and broader economic consumption patterns. Elevated mortgage rates combined with high home prices create monthly payment burdens that often exceed rental costs, even accounting for tax benefits of homeownership and long-term appreciation potential.
This dynamic creates increased rental demand from potential buyers priced out of homeownership, generating upward pressure on rents that affects both residential real estate investment opportunities and consumer spending patterns. The ripple effects extend through the broader economy, affecting everything from furniture sales to home improvement spending.
To understand how you can use YCharts to create finincial visuals similar to the ones used in this section, take a look into our Fundamental Charts page.
Data Analysis: Key Economic Relationships
Federal Funds Rate vs. Inflation Trends (2020-2025)
| Period | Fed Funds Rate | Core PCE | Headline CPI | Policy Stance | Market Response |
|---|---|---|---|---|---|
| Q4 2020 | 0.00-0.25% | ~1.4% | ~1.2% | Accommodative | Risk-On Rally |
| Q4 2021 | 0.00-0.25% | ~4.9% | ~6.8% | Behind Curve | Volatility Surge |
| Q4 2022 | 4.25-4.50% | ~4.7% | ~6.5% | Catching Up | Market Stress |
| Q4 2023 | 5.25-5.50% | ~3.2% | ~3.1% | Restrictive | Yield Curve Inversion |
| Q2 2024 | 5.25-5.50% | ~2.6% | ~3.0% | Restrictive | Selective Recovery |
| Q4 2024 | 4.75-5.00% | ~2.4% | ~2.7% | Moderately Restrictive | Gradual Easing |
| Q2 2025 | 4.25-4.50% | 2.8% YoY | 2.7% YoY | Restrictive | Growth Resilience |
| Current | 4.25-4.50% | 2.8% YoY | 2.7% YoY | Restrictive – Held Steady | Labor Market Concerns |
|
Powered by
|
|||||
Note: Data for 2020-2024 reflects historical trends. Current 2025 data from official government sources. Core PCE through June 2025, CPI through July 2025. For precise historical economic data, visit YCharts.
Federal Funds Rate vs. 10-Year Treasury Correlation
| Period | Fed Funds | 10-Year Treasury | Spread | Market Interpretation | Policy Implications |
|---|---|---|---|---|---|
| Jan 2023 | ~4.50-4.75% | ~3.40% | ~-135 bps | Peak Inversion | Recession Signal |
| Jun 2023 | ~5.00-5.25% | ~3.70% | ~-155 bps | Maximum Inversion | Policy Tightening |
| Dec 2023 | ~5.25-5.50% | ~4.20% | ~-105 bps | Gradual Normalization | Soft Landing Hope |
| Jun 2024 | ~5.25-5.50% | ~4.45% | ~-80 bps | Continued Recovery | Growth Resilience |
| Dec 2024 | 4.85% | 4.20% | ~-65 bps | Curve Normalization | Easing Cycle |
| Jun 2025 | 4.33% | 4.25% | ~-8 bps | Near Normal | Policy Pause |
| Current | 4.33% | 4.37% | +4 bps | Essentially Flat | Pause Continues |
|
Powered by
|
|||||
Note: Historical data through 2024 reflects actual market conditions. Current 2025 data from official Treasury and Fed sources. For precise bond yield data, visit YCharts.
Mortgage Rates vs. Home Sales Correlation
| Mortgage Rate Range | Existing Home Sales | New Home Sales | Affordability Impact | Investment Opportunity |
|---|---|---|---|---|
| 3.0-3.5% | ~6.1M units | ~800K units | High Affordability | Limited Rental Demand |
| 4.0-4.5% | ~5.2M units | ~650K units | Moderate Impact | Increasing Rentals |
| 5.0-5.5% | ~4.1M units | ~550K units | Significant Constraint | Strong Rental Market |
| 6.0-6.5% | ~3.8M units | ~480K units | Severe Constraint | Peak Rental Demand |
| 6.0-6.5% (Current: 6.58%) | ~4.1M units | ~620K units | Severe Constraint | Peak Rental Demand |
|
Powered by
|
||||
Note: This table contains estimated historical correlations for illustrative purposes. For precise housing market data, visit YCharts.
Housing Affordability Index Trends
| Metro Area | Median Home Price | Monthly Payment | Income Required | vs. 2020 | Investment Outlook |
|---|---|---|---|---|---|
| San Francisco | ~$1,950,000 | ~$12,365 | ~$371,000 | -42% | Rental Premium |
| New York | ~$825,000 | ~$5,232 | ~$157,000 | -32% | Stable Rental |
| Los Angeles | ~$975,000 | ~$6,187 | ~$186,000 | -37% | High Rental Demand |
| Miami | ~$700,000 | ~$4,442 | ~$134,000 | -47% | Tourist Rental Strong |
| Austin | ~$575,000 | ~$3,646 | ~$110,000 | -40% | Tech Worker Impact |
| National Average | $422,800 | $2,681 | $74,000 | -35% | Crisis Levels |
|
Powered by
|
|||||
Note: This table uses current median home price of $422,800 (NAR May 2025) and current mortgage rate of 6.58%.
Advisor Implications: Practical Client Strategies
Portfolio Construction for Inflationary Environments
Traditional 60/40 portfolios require fundamental reconsideration in persistent inflationary environments, with real assets, commodities, and inflation-protected securities warranting increased allocations. Duration management across bond portfolios demands active oversight, as shorter duration strategies may offer better risk-adjusted returns during periods of rate uncertainty.
Equity sector positioning becomes crucial, with companies demonstrating pricing power, strong balance sheets, and essential services characteristics potentially outperforming during extended inflationary periods. The inflation market impact varies significantly across sectors, requiring sophisticated analysis and dynamic positioning to capitalize on changing conditions.
Client Communication and Expectation Management
Clients need comprehensive education about the relationship between inflation, interest rates, and portfolio performance, with historical context helping frame current conditions within longer-term market cycles. Setting appropriate expectations about volatility, sector rotation, and the time horizon required for inflation-hedging strategies proves essential for maintaining client relationships during challenging periods.
Higher rates create opportunities in fixed-income markets that haven’t existed for over a decade, with money market funds and short-term bonds offering meaningful yield for the first time since before the 2008 financial crisis. Communicating these opportunities while managing duration risk requires sophisticated analysis and clear client communication.
Looking Ahead: September FOMC
The September 16-17, 2025 FOMC meeting represents a crucial inflection point for markets and advisors, with several key factors influencing committee decisions. The Fed faces the challenging balance of Core PCE inflation at 2.8% (above target) against deteriorating employment conditions (4.2% unemployment with weak job growth). Markets price in 65% probability of a September cut, though July’s weak jobs report has increased expectations to 85% for a cut by November.
Market functioning considerations, including credit availability and financial stability concerns, play important roles in Fed decision-making beyond traditional economic indicators. Understanding these factors helps advisors position portfolios for various policy scenarios.
Conclusion
The inflation market impact extends far beyond simple asset price movements, creating complex interactions between Fed policy, sector rotations, housing markets, and client portfolios that require sophisticated analysis and strategic positioning. Current conditions present both significant challenges and unique opportunities that advisors can navigate successfully through data-driven analysis and appropriate positioning.
Understanding these dynamics helps advisors position portfolios to capitalize on emerging opportunities while managing inflation-related risks. With economic indicators showing Fed funds at 4.33%, unemployment at 4.2%, GDP growth at 3.0% (Q2 2025), and mortgage rates at 6.58%, the economic backdrop provides a solid foundation for informed decision-making despite ongoing uncertainties.
As we continue through this Inflation Impact Hub series, we’ll examine each theme in greater detail, providing the comprehensive analysis advisors need to serve clients effectively in this dynamic environment.
The next rate cut is coming! See how YCharts can help you prepare:
Follow YCharts Social Media to Unlock More Content!
Disclaimer
©2025 YCharts, Inc. All Rights Reserved. YCharts, Inc. (“YCharts”) is not registered with the U.S. Securities and Exchange Commission (or with the securities regulatory authority or body of any state or any other jurisdiction) as an investment adviser, broker-dealer or in any other capacity, and does not purport to provide investment advice or make investment recommendations. This report has been generated through application of the analytical tools and data provided through ycharts.com and is intended solely to assist you or your investment or other adviser(s) in conducting investment research. You should not construe this report as an offer to buy or sell, as a solicitation of an offer to buy or sell, or as a recommendation to buy, sell, hold or trade, any security or other financial instrument. For further information regarding your use of this report, please go to: ycharts.com/about/disclosure.
All economic indicators reflect official government statistics from the Federal Reserve, Bureau of Economic Analysis, Bureau of Labor Statistics, U.S. Treasury, and Freddie Mac. Federal Reserve data from July FOMC statement; GDP from BEA’s Q2 advance estimate; employment data from July BLS report; inflation metrics from June PCE and July CPI releases; mortgage rates from Freddie Mac weekly survey. For real-time updates, consult primary sources directly. Market data and analysis provided through YCharts platform. For comprehensive analysis tools, visit YCharts.com.
Next Article
Fed Rate Cut Looms: How Advisors Can Position Clients NowRead More →