Working the Core: Where Bond ETF Flows Are Heading in 2026

Nothing says summer like working on your core. Investors appear to be doing something similar.
Through April 2026, advisors poured more than $43 billion into core bond and multi-sector income ETFs, or toward the “belly” of the yield curve—the intermediate maturities that sit between cash and long-duration bonds.
As short-term cash alternatives have become less compelling and the yield curve has steepened, advisors have increasingly looked beyond traditional benchmark exposure and toward active managers capable of navigating a more complex fixed-income landscape.
Core bond ETFs attracted $32.3 billion in net new assets through April, while active core bond strategies alone gathered nearly $15 billion. Multi-sector income ETFs added another $11.2 billion, highlighting investors’ appetite for flexibility, income, and differentiated sources of return.

Access innovation without making a narrow bet. FWD (The AB Disruptors ETF) actively invests in market-leading innovators across sectors and geographies—offering diversified exposure to themes like AI, cloud, fintech and digital technology in one forward-looking ETF.
Table of Contents
Why Advisors Are Returning to the Core
For much of the last two years, investors could earn attractive yields sitting in cash.
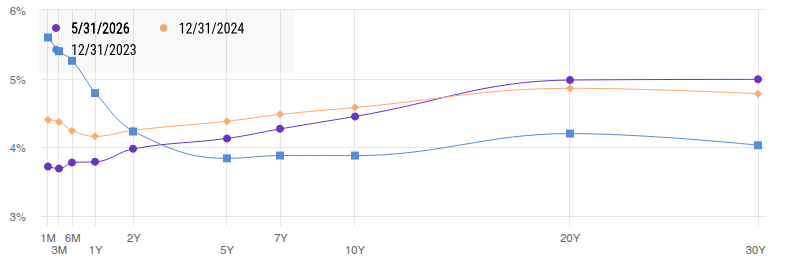
That advantage is beginning to fade. By the end of May, 2-year Treasuries yielded roughly 4%, while 10-year Treasuries stood near 4.45%, widening the 10-2 spread to 47 basis points and creating a stronger incentive to move out along the curve.
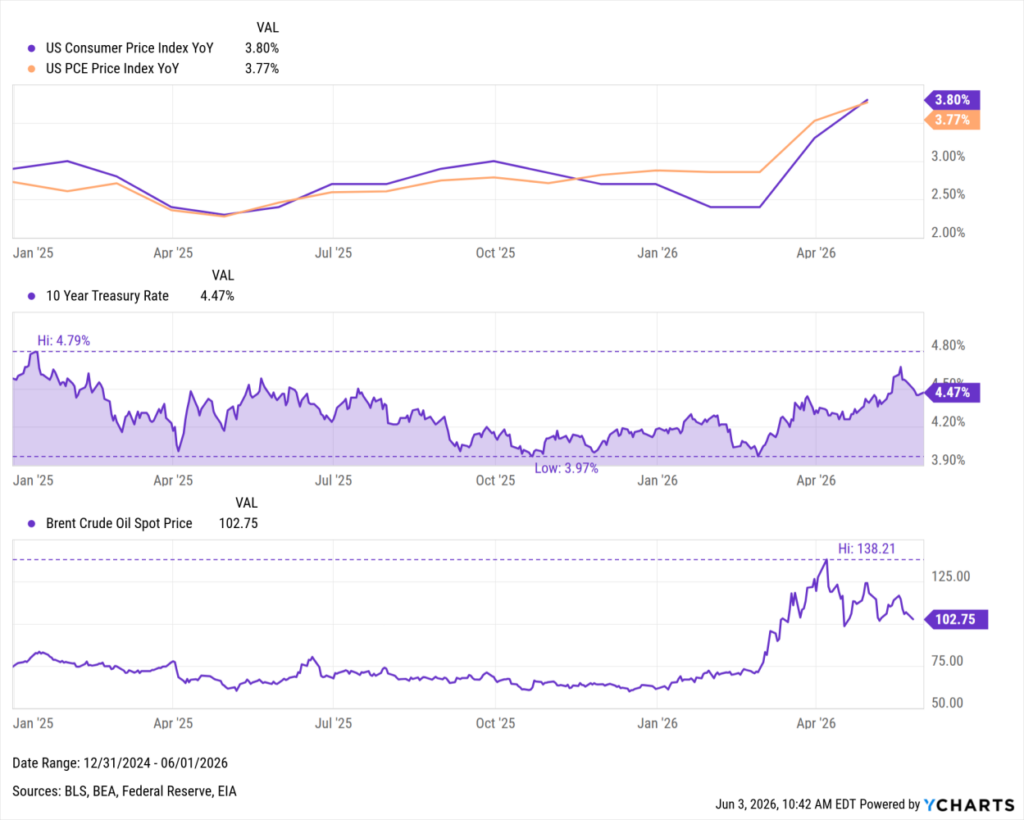
At the same time, expectations for aggressive Federal Reserve easing have largely faded. Sticky inflation concerns, higher energy prices, and geopolitical tensions have pushed bond yields higher across much of 2026. Help clients get familiar with the new Fed Chair here.
The result has been a market where simply owning duration isn’t enough. Advisors increasingly want active managers who can allocate across sectors, adjust exposures, and identify opportunities beyond traditional benchmark holdings.
Five Active Core Bond ETFs Advisors Are Adding
While index strategies continue to dominate the category, advisors aren’t stopping at BND or AGG.
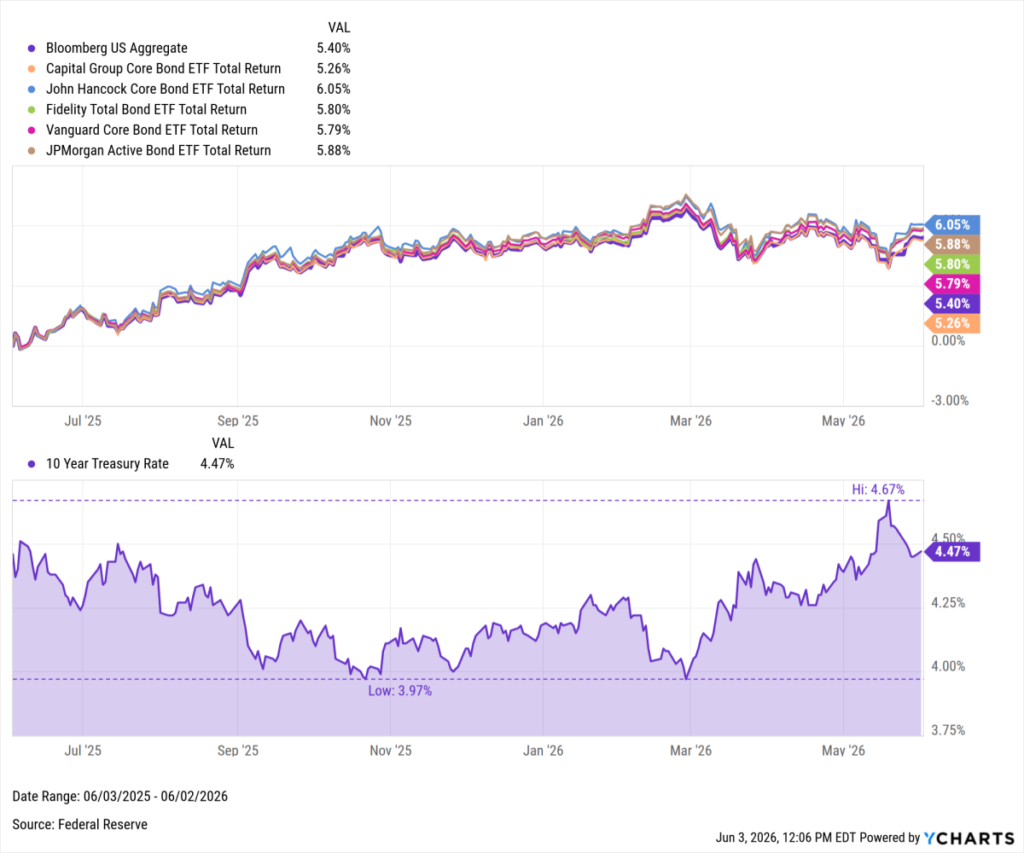
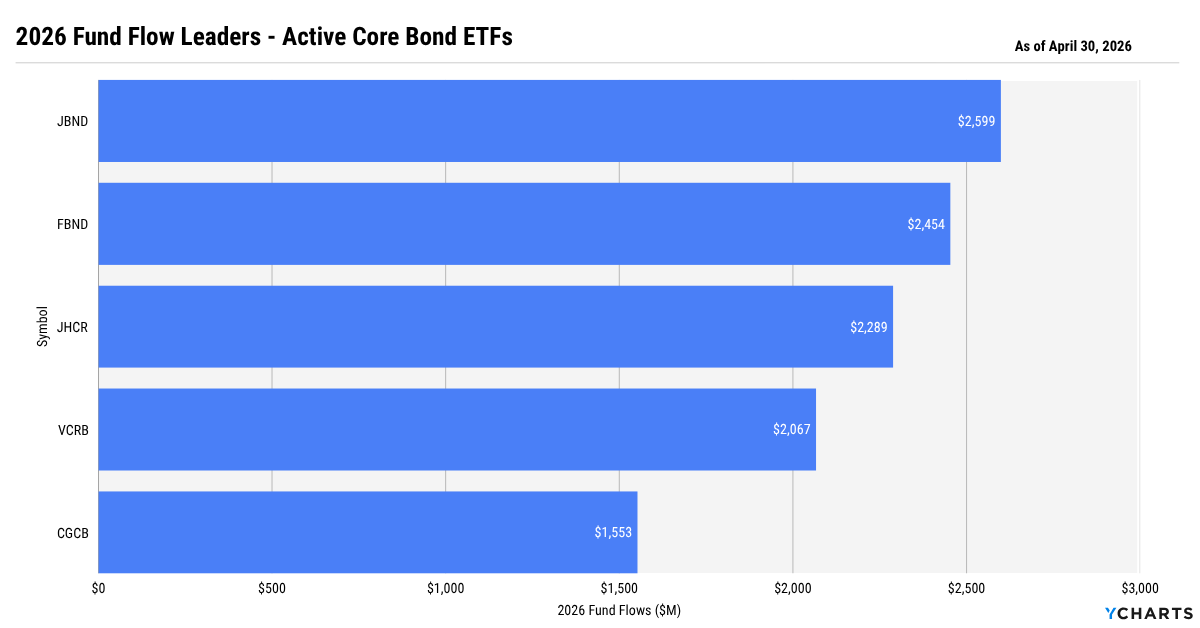
Through April 2026, active core bond ETFs attracted nearly $14.8 billion in net new assets, nearly half of all flows into the category (As of April 30, 2026). In a market where Treasury yields have remained elevated and the yield curve has steepened, advisors appear increasingly willing to move beyond benchmark exposure in search of additional income, differentiated sector allocations, and active security selection.
What’s particularly notable is that these funds have delivered results comparable to—or better than—the Bloomberg U.S. Aggregate Bond Index while taking noticeably different approaches.
For example, BND allocates roughly 52% of assets to government bonds and 22% to securitized credit. Each of the largest flow recipients has reduced Treasury exposure in favor of corporate bonds, mortgages, and other securitized sectors where managers see more attractive risk/reward opportunities.
Here are five active core bond ETFs that have attracted the most advisor attention in 2026.
Subscribe to the Fund Flow Report →
JBND – JPMorgan Active Bond ETF
YTD Flows: $2.6 Billion
JBND has attracted more assets than any other active core bond ETF this year, bringing in nearly $2.6 billion in net inflows. Advisors who moved beyond benchmark core exposure have been rewarded, as the fund delivered a 5.9% trailing one-year return versus 5.4% for the Bloomberg U.S. Aggregate Bond Index. The outperformance hasn’t been limited to a single period either. JBND has generated an average rolling one-year return of 6.5%, compared to 5.3% for the benchmark, highlighting its ability to add value across varying market environments.
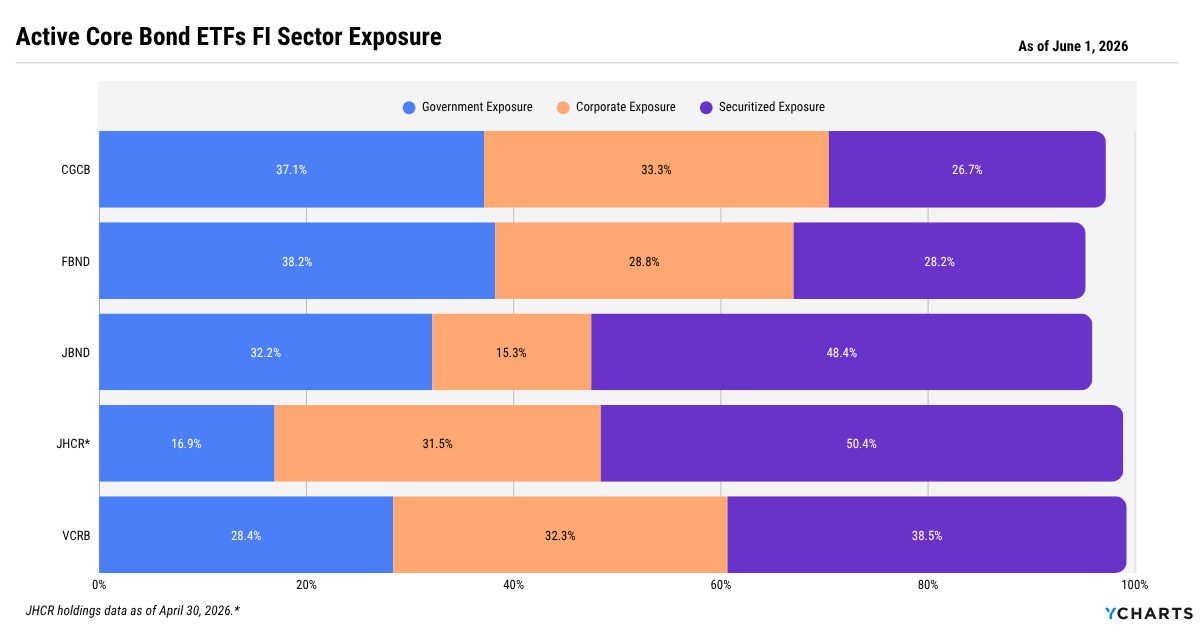
The strategy also stands out for its portfolio construction. While the Agg allocates approximately half of its assets to government bonds, JBND holds just 32% in government securities and nearly 48% in securitized credit, more than double the benchmark’s exposure.
FBND – Fidelity Total Bond ETF
YTD Flows: $2.5 Billion
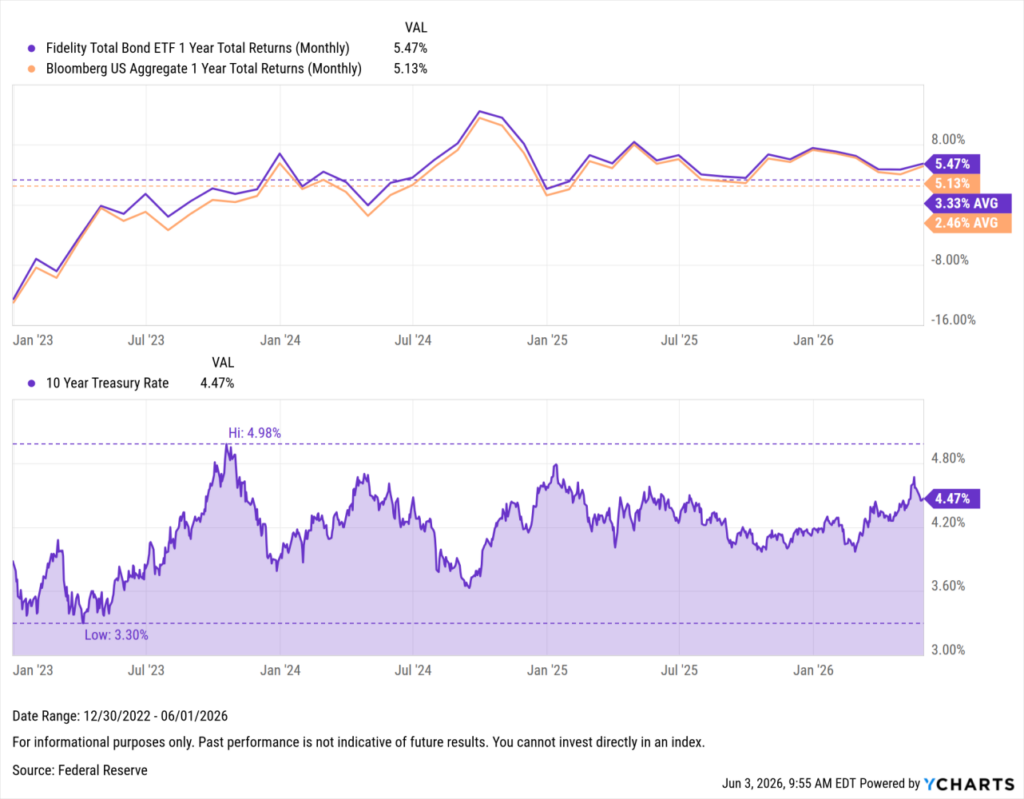
Unlike JBND and JHCR, which make larger securitized-credit bets, FBND takes a more balanced approach, allocating roughly 38% to government bonds, 29% to corporate credit, and 28% to securitized holdings.
That diversification has helped the fund generate a trailing one-year return of 5.8% while producing an average rolling one-year return of 3.3% since the start of 2023.
JHCR – John Hancock Core Bond ETF
YTD Flows: $2.3 Billion
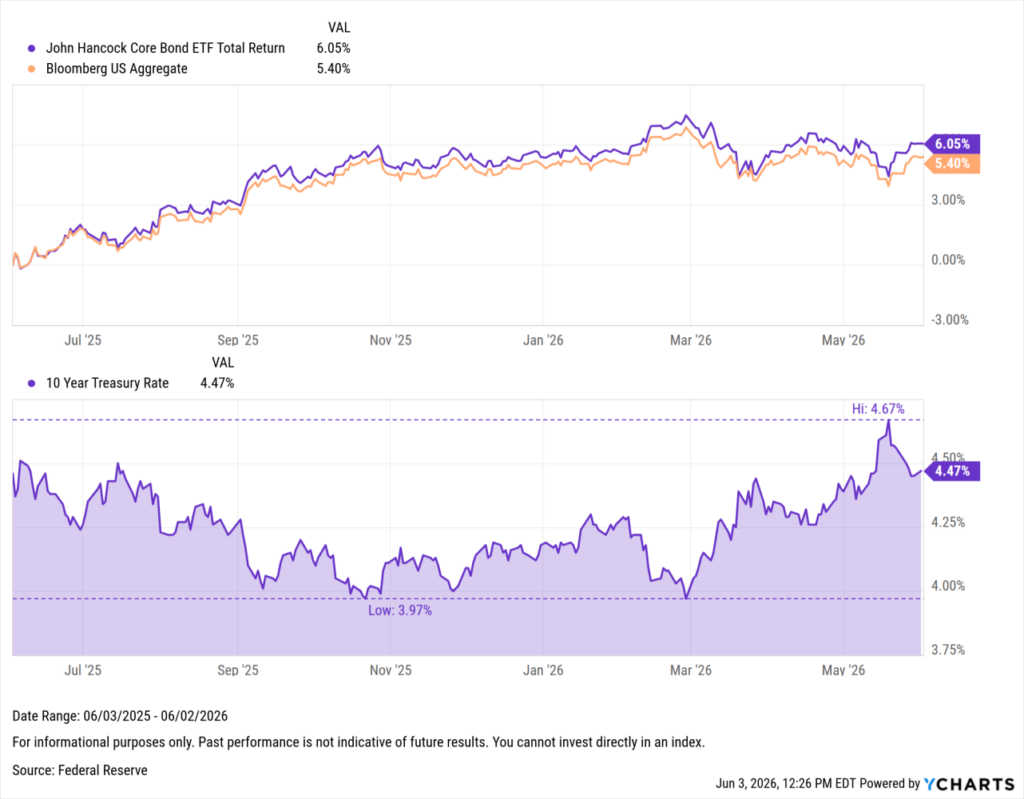
If JBND tilts toward securitized credit, JHCR takes that approach even further. Just 17% of assets are invested in government securities, while more than half of the portfolio sits in securitized sectors.
That positioning helped the strategy generate the strongest trailing one-year return among the group at 6.1%.
VCRB – Vanguard Core Bond ETF
YTD Flows: $2.1 Billion
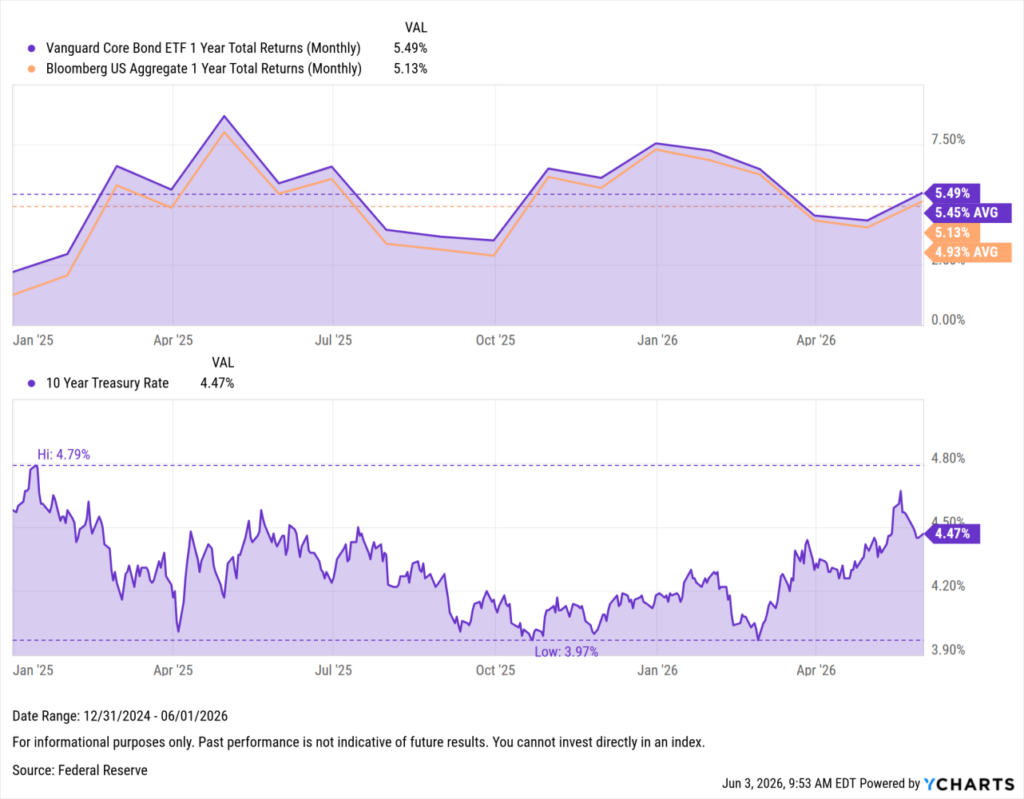
Vanguard’s active offering has quickly become one of the industry’s largest asset gatherers, bringing in more than $2 billion year-to-date. Unlike many of its peers, VCRB doesn’t seek to reinvent core bonds. Instead, it aims to enhance them.
While the strategy retains a familiar core profile, it significantly reduces government bond exposure—from 52% in BND to 28%—while increasing allocations to corporates (32%) and securitized credit (39%).
The fund returned 5.8% over the last year versus 5.4% for the Agg and produced an average rolling one-year return of 5.5%, compared to 4.9% for the benchmark.
CGCB – Capital Group Core Bond ETF
YTD Flows: $1.6 Billion
CGCB‘s appeal is consistency. While its 16.5% cumulative return since inception only narrowly exceeds the 16.4% gain for the Bloomberg U.S. Aggregate Bond Index, the result is notable given the volatility in interest rates over that period.
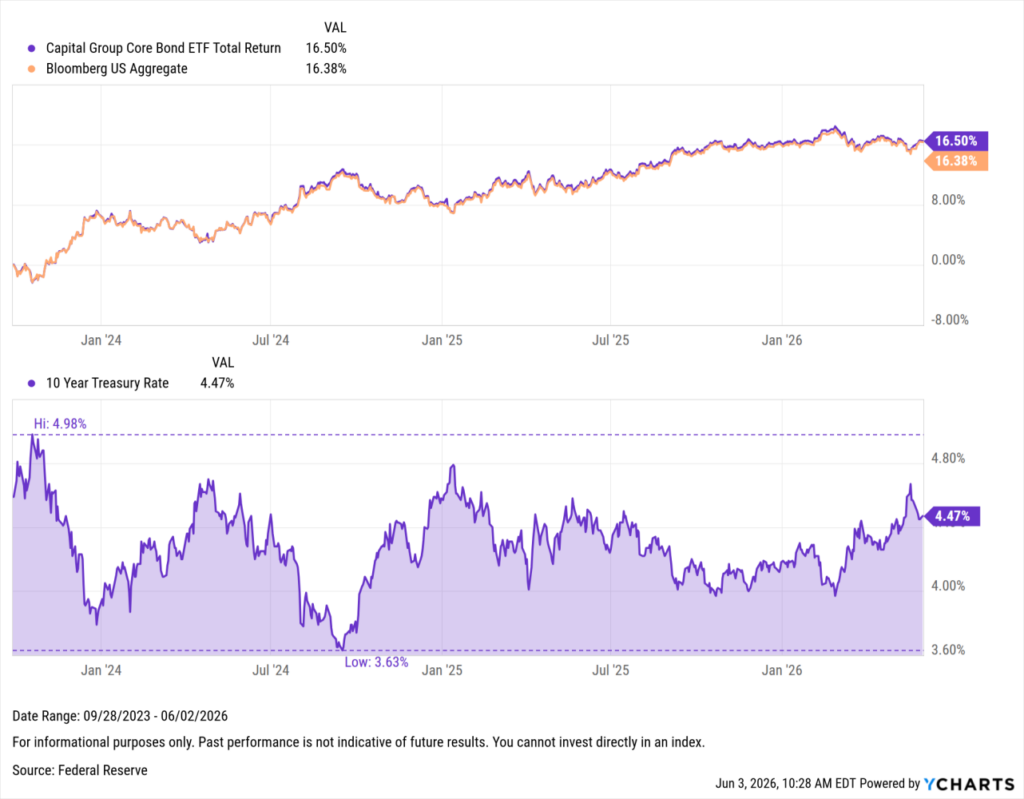
Throughout that environment, CGCB has maintained a diversified mix of approximately 37% government bonds, 33% corporate credit, and 27% securitized holdings, supplemented by a modest derivatives allocation to help manage risk and positioning.
Collectively, these five funds have attracted more than $11 billion in net new assets this year, highlighting advisors’ growing willingness to look beyond traditional benchmark exposure; they’re looking for managers who can strengthen the core.
Beyond Core: Advisors Continue Reaching for Flexible Income
If active core bond funds are helping advisors strengthen the foundation of fixed-income portfolios, multi-sector income ETFs are where they’re seeking additional flexibility and yield.
If core bond ETFs represent the summer workout routine, multi-sector income ETFs are the cross-training program.
Unlike traditional core bond funds, these strategies aren’t tied to a benchmark. Managers can allocate across investment-grade credit, high yield bonds, securitized debt, mortgages, and other income-producing sectors as opportunities emerge.
That flexibility has become increasingly valuable in a market where Treasury yields remain elevated, credit spreads have stayed relatively tight, and security selection once again matters.
Subscribe to the Fund Flow Report →
While each strategy takes a different path, they share two common characteristics: yields above the Agg’s 4% distribution yield and the flexibility to move beyond traditional benchmark constraints.
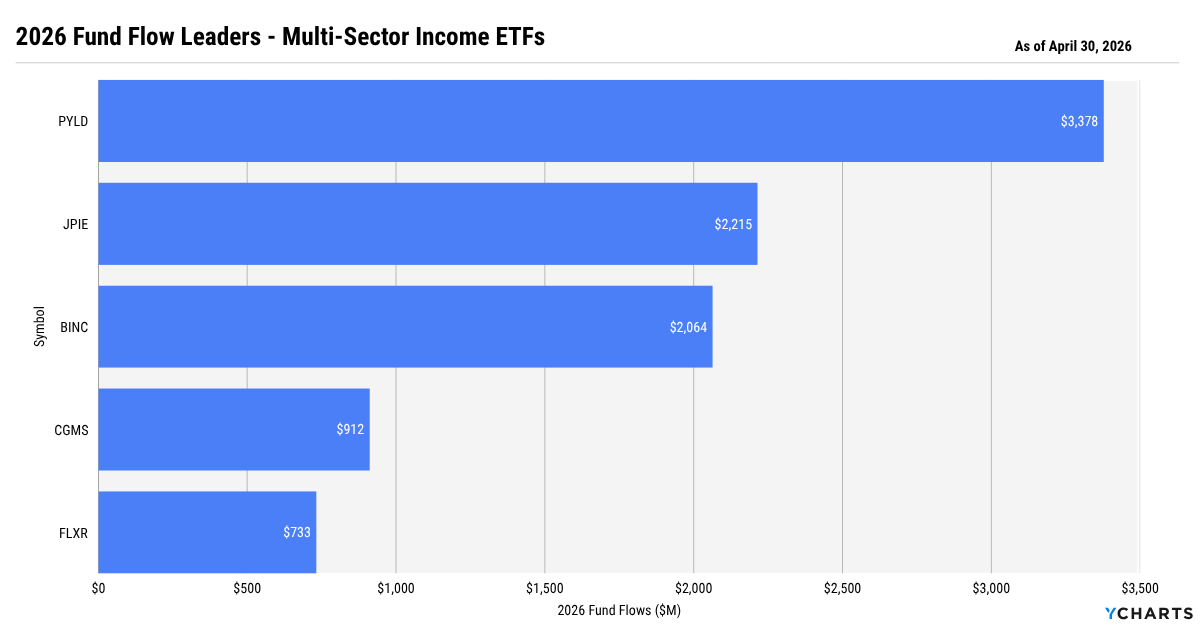
PYLD – PIMCO Multisector Bond Active ETF
YTD Flows: $3.4 Billion
PYLD leads the category in both flows ($3.4 billion) and trailing one-year returns (7.6%). PIMCO’s approach blends multiple sources of income, including 32% securitized credit, 22% government bonds, and nearly 19% derivative exposure, while maintaining a 6.3% distribution yield (TTM).
Advisors appear to be gravitating toward the combination of elevated income and PIMCO’s reputation for active management.
JPIE – JPMorgan Income ETF
YTD Flows: $2.2 Billion
JPIE may be the most distinctive portfolio in the group, allocating more than 74% of assets to securitized credit and less than 4% to government bonds. Combined with a 5.6% distribution yield, that positioning helped the fund outperform the Aggregate while gathering $2.2 billion in new assets.
BINC – iShares Flexible Income Active ETF
YTD Flows: $2.1 Billion
BINC has taken a different route to outperformance, maintaining an effective duration of just 2.9 years—roughly half that of the Aggregate—while still delivering a 5.9% trailing one-year return.
And its flexibility is evident in its portfolio construction. The portfolio combines 23% corporate credit, 27% securitized holdings, and more than 30% derivatives exposure. That flexibility has allowed managers to pursue income opportunities while reducing sensitivity to interest-rate movements.
CGMS – Capital Group Multi-Sector Income ETF
YTD Flows: $912 Million
While most of the category’s leaders lean heavily on securitized credit, CGMS takes a different approach, allocating nearly 58% of assets to corporate bonds. That emphasis on bottom-up credit research helped the fund generate a 7.4% trailing one-year return while maintaining a 6.1% distribution yield.
CGMS – Capital Group Multi-Sector Income ETF
YTD Flows: $733 Million
FLXR offers one of the most compelling yield-duration combinations in the group, pairing a 5.8% distribution yield with an effective duration of 3 years.
The portfolio allocates more than 51% of assets to securitized credit, the largest allocation in the peer group outside of JPIE.
Just as a strong summer physique starts with a strong core, many advisors appear to be rebuilding fixed-income allocations from the middle out.
With more than $43 billion flowing into core bond and multi-sector income ETFs through April, the message is clear: investors aren’t just chasing yield—they’re seeking active managers capable of building a stronger foundation for client portfolios.
Ready to Move On From Your Investment Research and Analytics Platform?
Follow YCharts Social Media to Unlock More Content!
Next Article
Liquid Alt Fund Leaderboard: May 2026Read More →