Why “Time in the Market” Trumps “Timing the Market”
Stating the obvious: no one enjoys watching their portfolio balance decline. And advisors know all too well how clients can feel uneasy about “staying the course” as their nest eggs shrink in periods of volatility.
However, rushing for the exit when the market goes south can actually stunt long-term portfolio growth. “Timing the market”—ideally buying at lows and selling at the highs—can be incredibly difficult and lead to unintended outcomes. Good timing on entries and exits might help you avoid some losses, but it could also cause you to miss the market’s best days.
In fact, the latest episode of market volatility occurred in the first week of August. On August 5th, the S&P 500 tumbled 3%, gained 1.04% on the 6th, slipped another 0.77% on the 7th, and roared 2.3% higher on the 8th. Exiting the market on the 5th and waiting until “things get better” would have led to missing out on two solid rebound days along the way…arguably a form of market timing that no one wants to make.
In light of recent volatility, you’ll find captivating visuals from our Top 10 Visuals for Clients & Prospects slide deck that not only illustrate to clients why staying invested matters through both thick and thin, but also show how “time in the market” outperforms trying to “time the market”.
Download the free Slide Deck for more insights:The Devastating Effect of Missing the Market’s Best Days
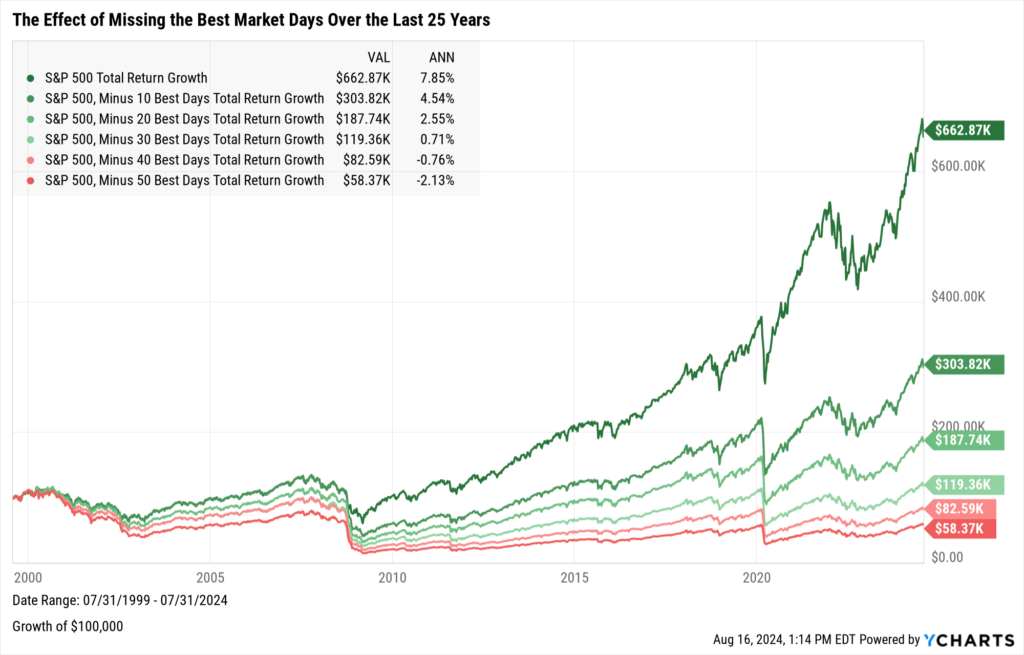
The 25-year period between August 1999 and July 2024 consisted of around 6,200 trading days. Being uninvested for just the best 10 days of that stretch would have significantly diminished long-term total returns.
Using an all-stock S&P 500 portfolio as an example, moving to cash for each of the 10 best days in that 25-year span resulted in an annualized total return that was 3.31 points lower versus simply remaining invested in the market. In terms of dollar amounts, a $100,000 portfolio that missed the 10 best days since August 1999 would be worth less than half of one that remained fully invested through July 2024.
Notably, missing the best 40 or more days in the last 25 years actually resulted in a negative return.
Download Visual | Modify in YCharts | Get in Touch to Access
When Were the Best Market Days in the Last 25 Years?
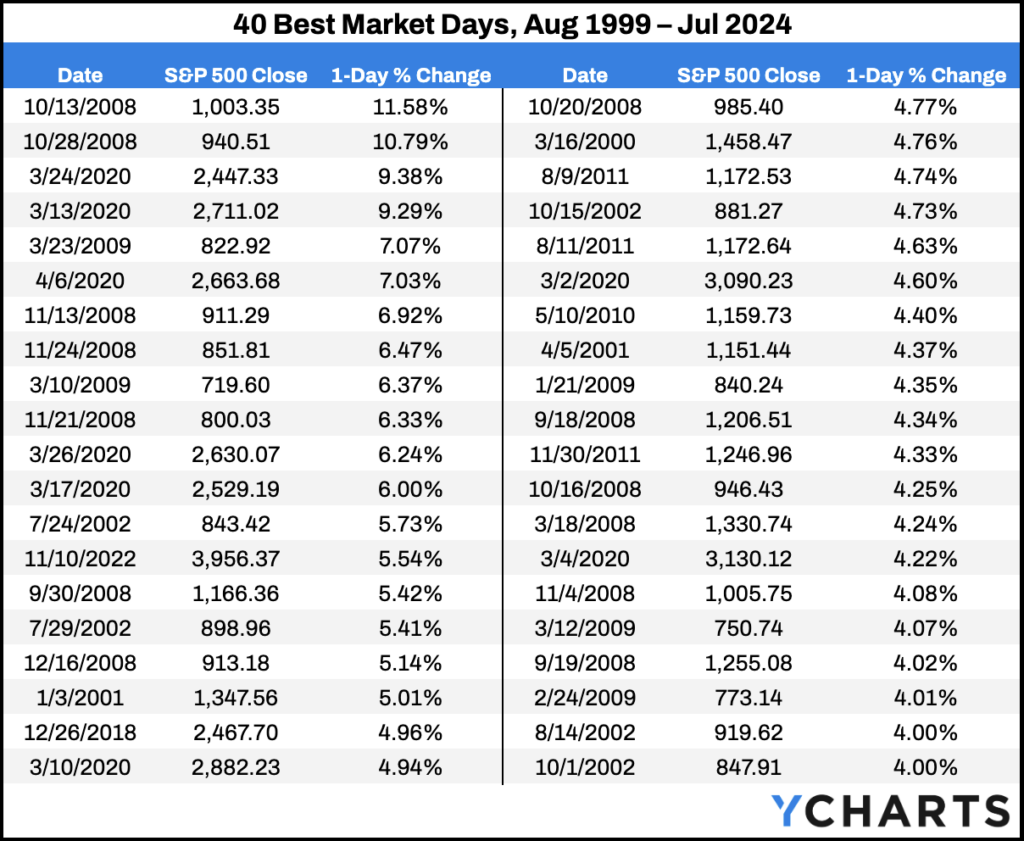
The S&P 500 index saw single-day gains of 4% or more in its 40 best days over the last 25 years. More importantly, the market’s best days often occurred during periods of volatility.
Despite the plummeting declines that resulted from the Dot-Com Bubble, Great Financial Crisis, and the COVID-19 pandemic, the best single-day performances also occurred during these turbulent times.
Of the market’s 40 best days in the last 25 years, 18 occurred around the GFC (2008-2009), eight at the onset of the COVID-19 pandemic in 2020, and another seven in the Dot-Com Bubble era (2000-2002).
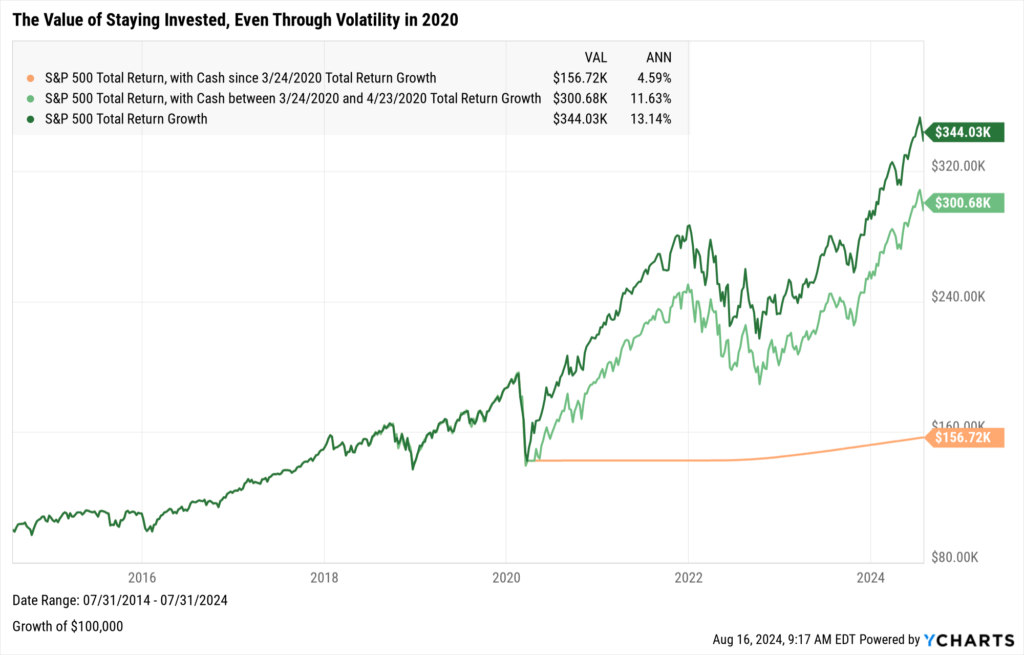
Reinforcing the idea about missing the best market days, let’s look at what would have happened if a client decided to head for the exits during a recent concentrated period of volatility: the COVID-19 pandemic.
Suppose on March 24th, 2020 that someone had endured enough pain and told their advisor to take their investments out of the market. In retrospect, this was the “bottom” of the decline. But if that portfolio stayed in cash for the next month, the client would’ve missed out on 1.51 percentage points worth of annualized return. Staying in cash in perpetuity since March 2020 would have been much more detrimental.
Download Visual | Modify in YCharts | Get in Touch to Access
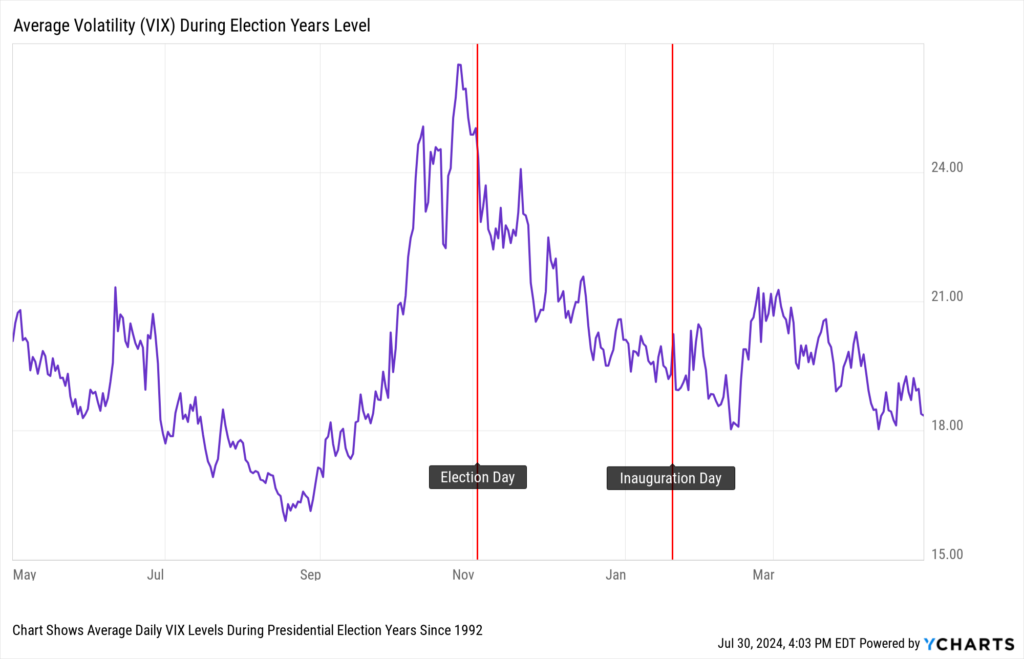
What Are Volatility Levels During Election Years?
When we explore market drivers in 2024, we’d be remiss if we didn’t include a discussion on election impact. Every four years, presidential election season comes around. Likewise, every four years, investor anxiety often rises leading up to an election.
In our latest election resource, “How Do Presidential Elections Impact The Market?”, we compiled daily average VIX values from the last eight presidential election cycles between 1992-2024 and found that the “fear index” tends to spike in the last couple of months before Election Day.
However, the volatility index generally returns to earth after Election Day, showing a pattern of calmer waters on the horizon.
One can assume that the months of September and October in election years contain their fair share of bad market days, but this shouldn’t diminish the fact that there ought to be several good ones sprinkled in, especially post-election.
Download Visual | Modify in YCharts | Get in Touch to Access
It’s never fun seeing portfolio holdings swim in a sea of red. But when the tides of the market turn, they often do so quickly yet vigorously. Attempting to time the market during periods of volatility in the hopes of escaping its worst days might unintentionally lead to missing out on its best ones, resulting in diminished long-term returns.
Advisors can use these visuals to illustrate that a good course of action for clients is to simply stay the course.
Whenever you’re ready, there are 3 ways YCharts can help you:
1. Looking for a best-in-class data & visualization tool?
Send us an email at hello@ycharts.com or call (866) 965-7552. You’ll be directly in touch with one of our Chicago-based team members.
2. Want to test out YCharts for free?
Start a no-risk 7-Day Free Trial.
3. Download a copy of The Top 10 Visuals for Client and Prospect Meetings slide deck:
Disclaimer
©2024 YCharts, Inc. All Rights Reserved. YCharts, Inc. (“YCharts”) is not registered with the U.S. Securities and Exchange Commission (or with the securities regulatory authority or body of any state or any other jurisdiction) as an investment adviser, broker-dealer or in any other capacity, and does not purport to provide investment advice or make investment recommendations. This report has been generated through application of the analytical tools and data provided through ycharts.com and is intended solely to assist you or your investment or other adviser(s) in conducting investment research. You should not construe this report as an offer to buy or sell, as a solicitation of an offer to buy or sell, or as a recommendation to buy, sell, hold or trade, any security or other financial instrument. For further information regarding your use of this report, please go to: ycharts.com/about/disclosure
Next Article
Monthly Market Wrap: July 2024Read More →