YCharts Dashboard: Elevate Your Financial Analysis and Client Communication
Introduction to the YCharts Dashboard
The YCharts Dashboard is more than just a workspace; it’s a powerful tool designed to enhance the productivity and efficiency of financial professionals. Whether you’re a financial advisor, wholesaler, or researcher, the YCharts Dashboard brings together real-time data, portfolio insights, and interactive visuals—all in one place. The Dashboard is fully customizable, offering the flexibility to organize watchlists, model portfolios, and charts, ensuring you have all critical information at your fingertips.
In this blog post, we’ll explore why the YCharts Dashboard stands out against competitors and how it can support your business growth.
Key Features of the YCharts Dashboard
1. Fully Customizable Workspace
The YCharts Dashboard allows users to create and customize their workspace to fit their needs. You can add various modules like watchlists, screeners, model portfolios, and fundamental charts, all designed to display critical information at a glance. This feature provides a personalized experience, ensuring that your most-used tools and data points are readily accessible.
Example: Easily add a watchlist with your top securities, or pull in pre-saved screeners for continuous monitoring of key investments.
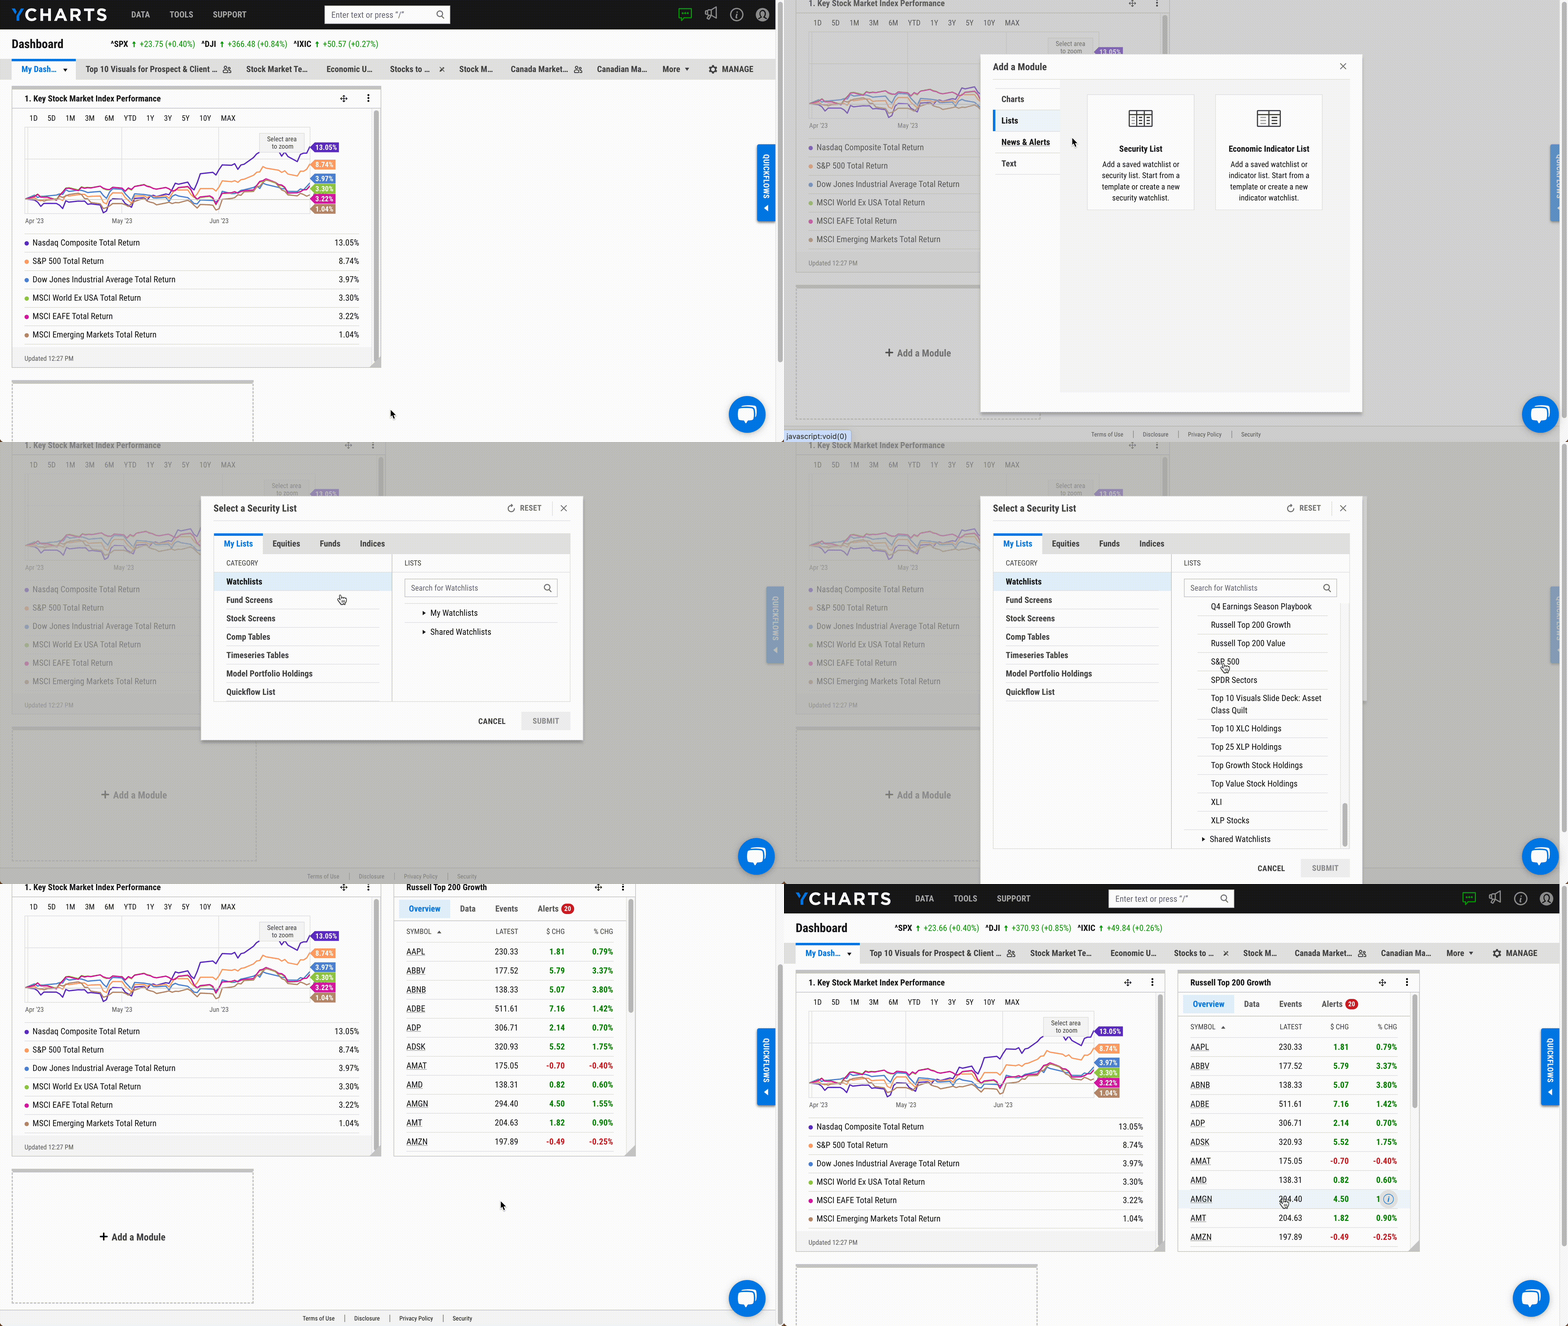
Watch the step-by-step video on how to setup your YCharts Dashboard here.
2. Streamlined Portfolio Management
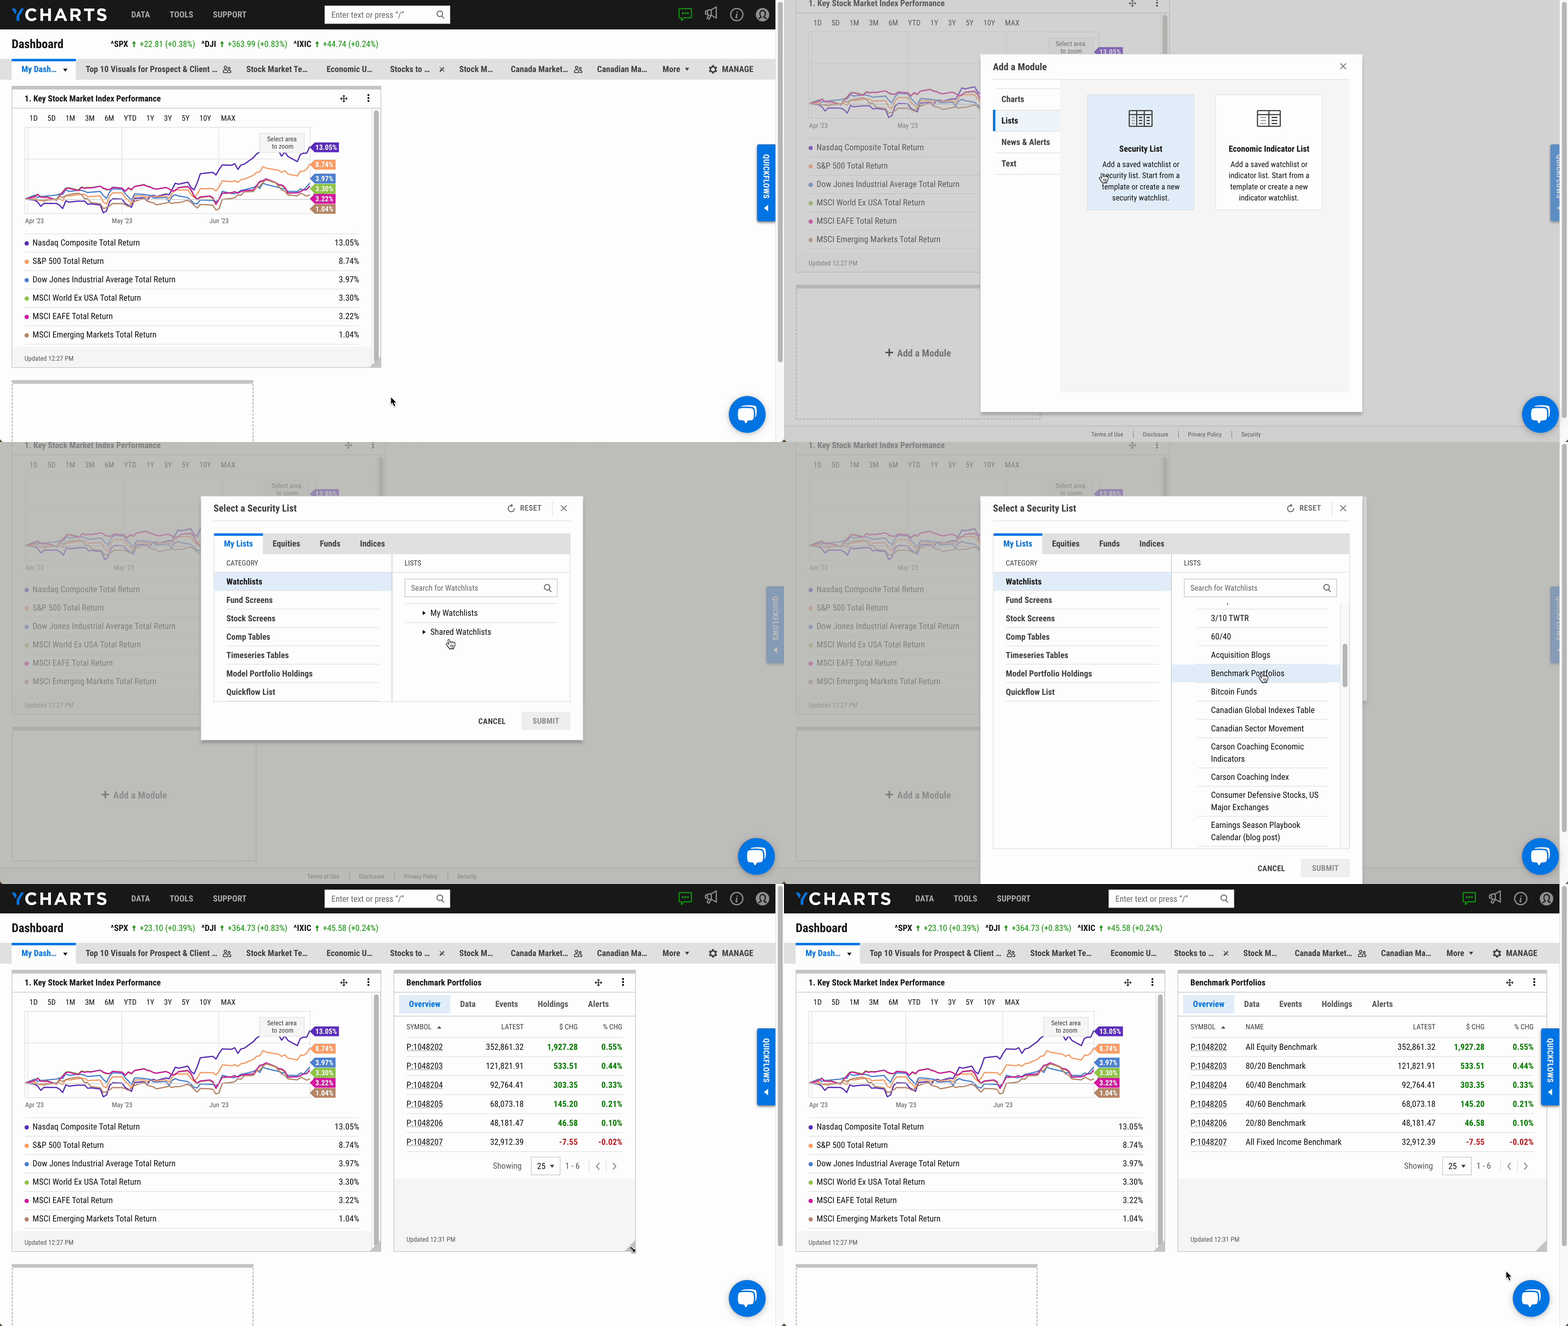
The YCharts Dashboard integrates portfolio management tools seamlessly. With the ability to add and monitor model portfolios, you can compare different strategies side by side, track performance, and evaluate risk—all in real-time.
Example: Import model portfolios to benchmark them against your client’s holdings, providing clear, data-driven insights on portfolio improvements.
3. Interactive Data Visualization
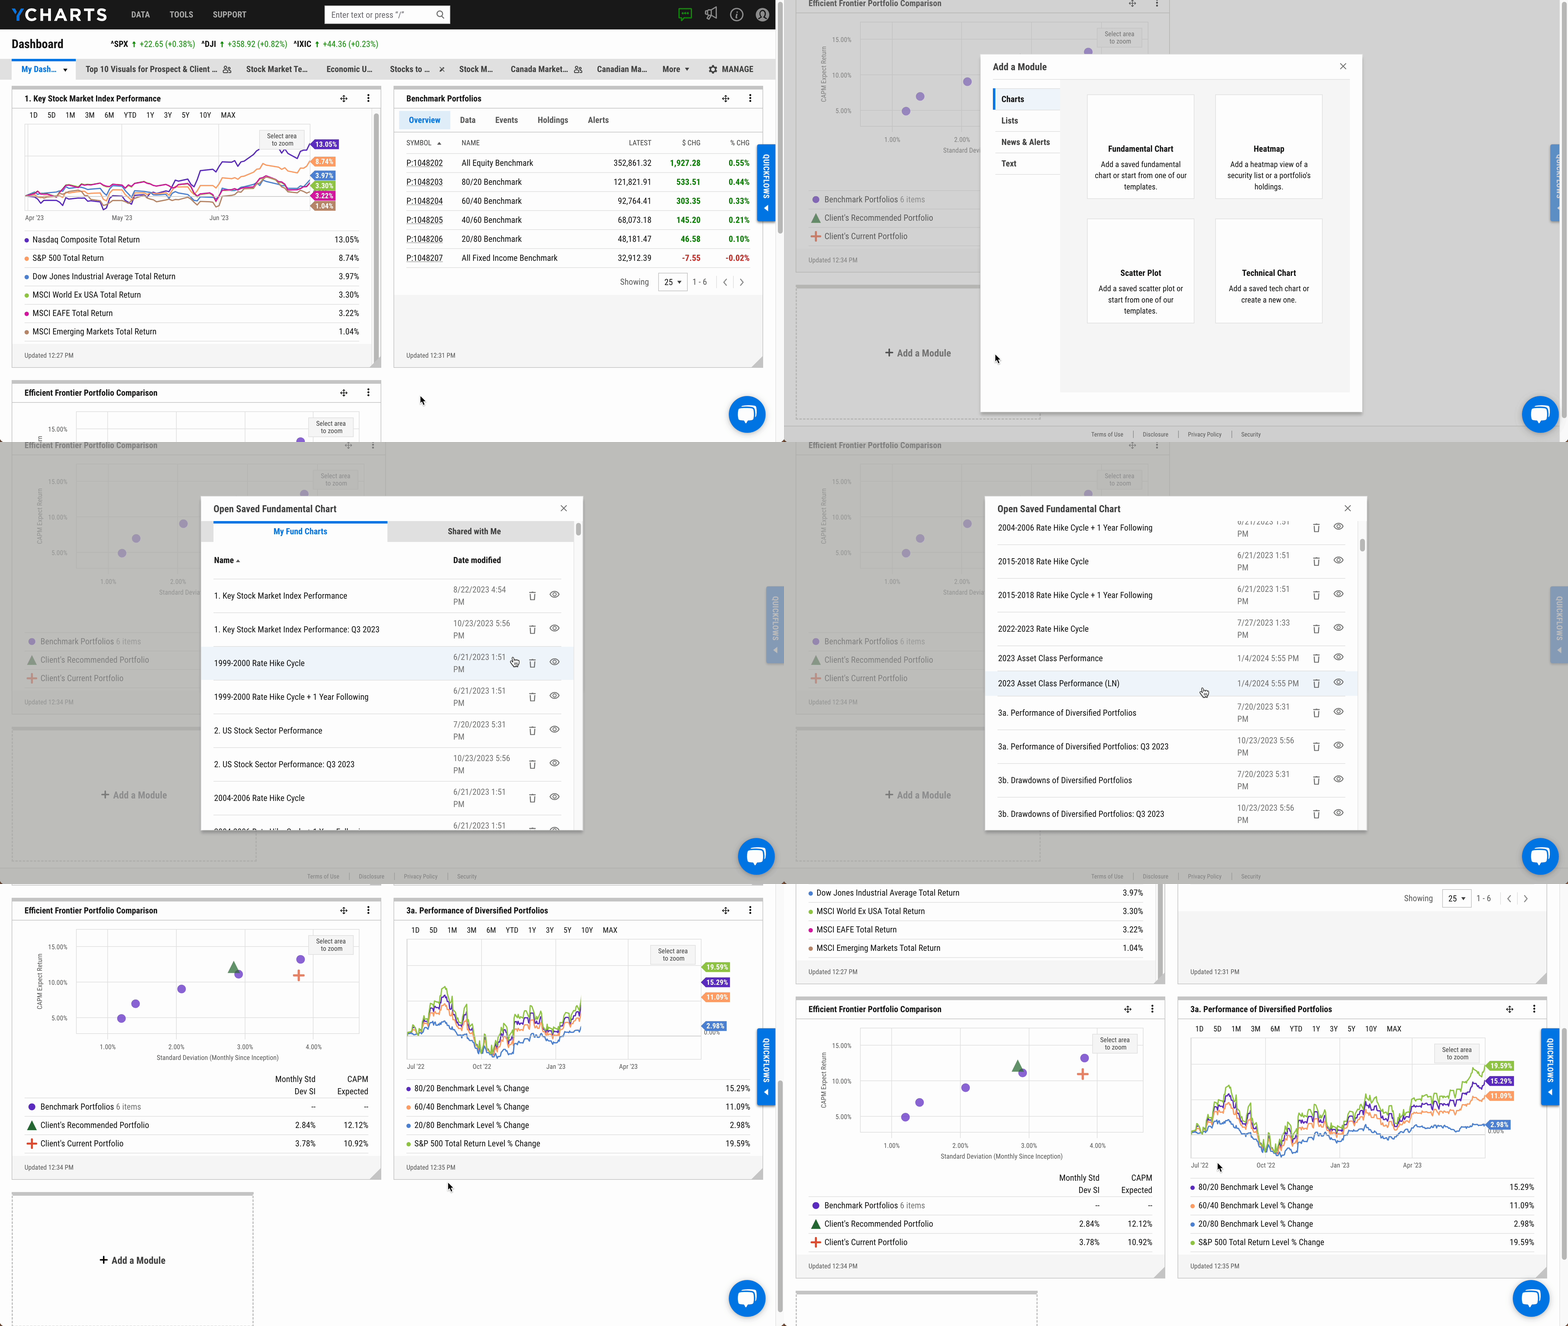
The Dashboard excels in data visualization. Users can integrate various financial charts directly into their workspace, such as price movements, economic indicators, or scatter plots. The charts are interactive and customizable, allowing users to explore market trends over different time horizons.
Example: Add fundamental charts that visualize stock performance over multiple time frames, providing a snapshot of market dynamics.
4. Condensed Layout and Easy Organization
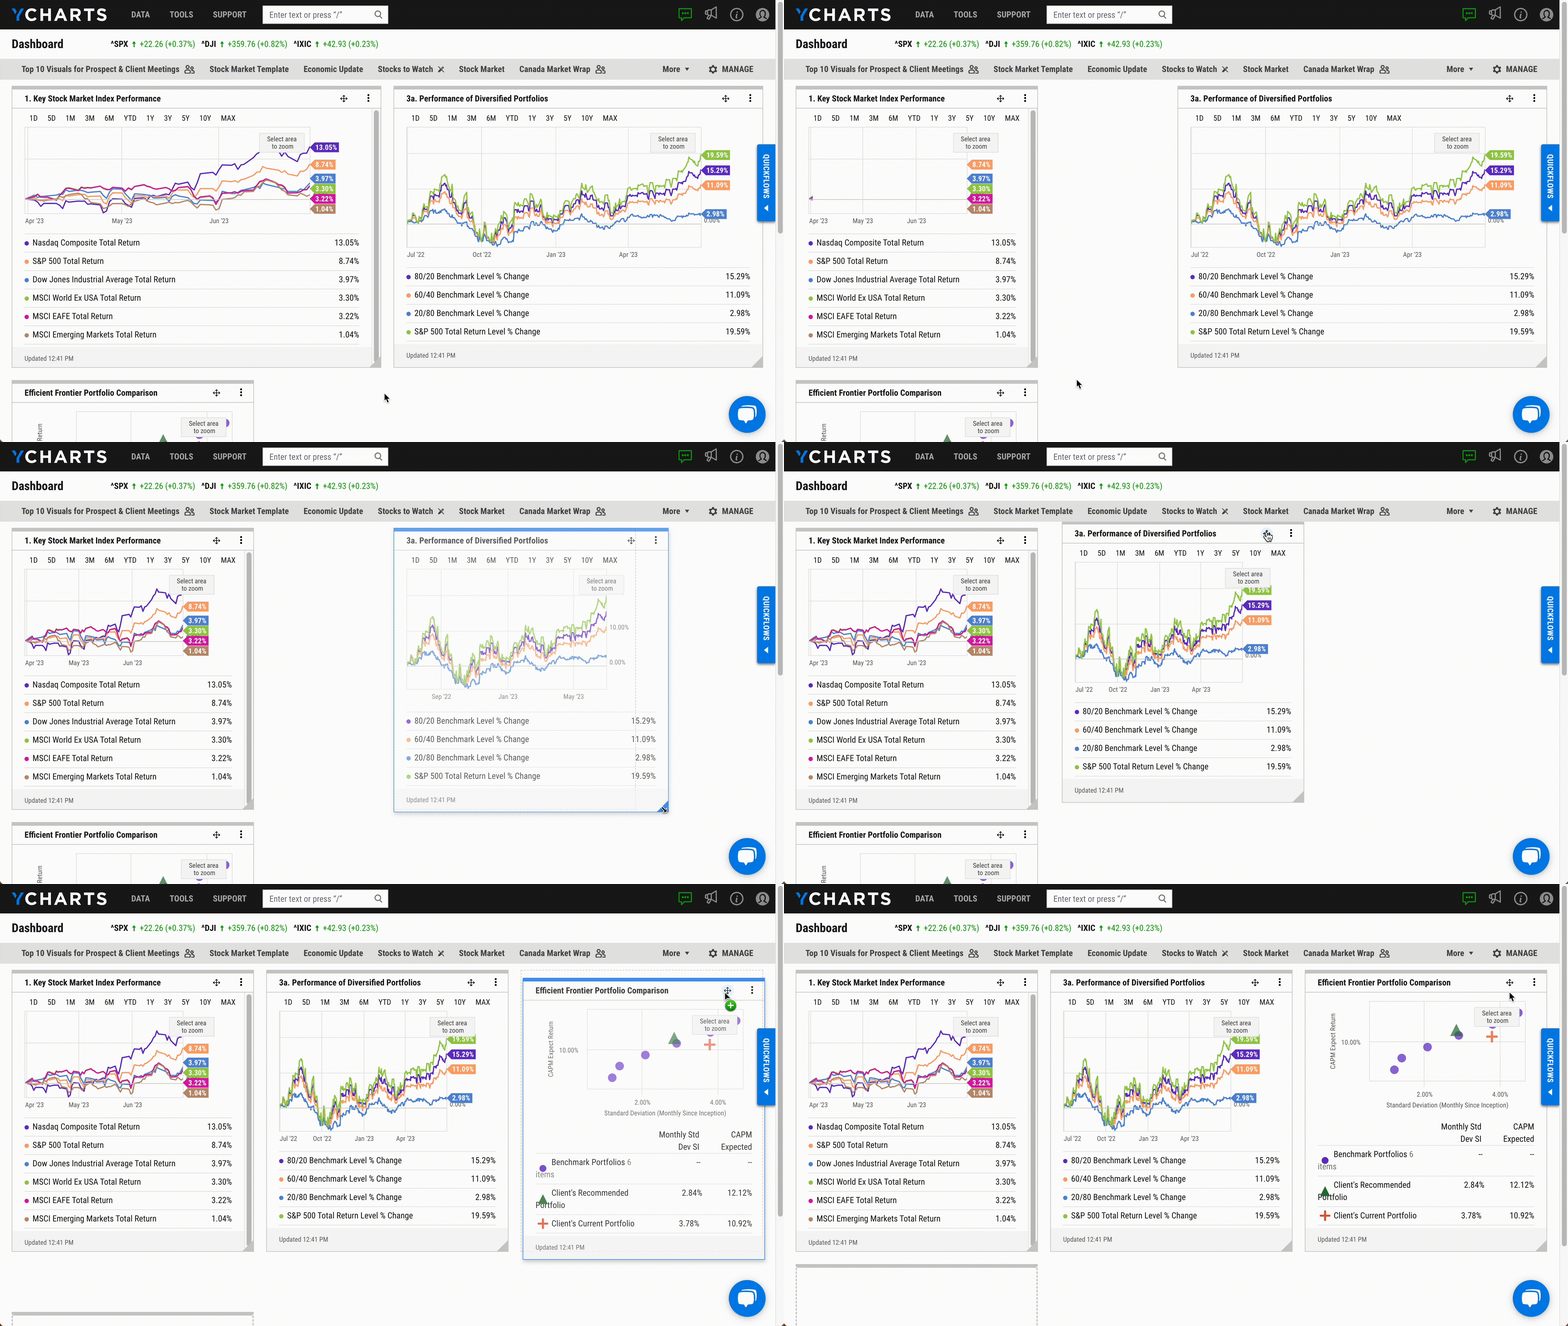
The YCharts Dashboard offers a “Condense” feature, making it easy to organize modules and eliminate any excess white space. Modules can be resized and adjusted based on your needs, ensuring your workspace is both efficient and visually appealing.
Example: With a few clicks, consolidate your modules into a compact layout that fits neatly on your screen without clutter.
5. Seamless Sharing with Colleagues
One of the standout features of the YCharts Dashboard is its collaborative capability. You can share dashboards or individual modules with colleagues who also use YCharts. This function is especially useful for advisor teams, ensuring consistency across different users and promoting collaborative insights.
Example: Easily share a customized watchlist or a fundamental chart with your team, keeping everyone aligned on key portfolio strategies.

The Competitive Edge of the YCharts Dashboard
Compared to other platforms, the YCharts Dashboard offers unrivaled flexibility and depth. Competitors may offer dashboards, but few provide the breadth of data integrations, user-friendly customization, and powerful visualization that YCharts offers. The platform’s ability to support various financial products (e.g., ETFs, mutual funds, equities, and fixed income) makes it a versatile choice for professionals managing diverse portfolios.
Moreover, YCharts enables financial professionals to easily brand and customize reports, embedding their firm’s logo and colors. This feature not only improves client communication but also reinforces your firm’s presence in every client interaction.
Why Choose YCharts for Your Business?
The YCharts Dashboard empowers financial professionals by consolidating all essential information and data into one customizable, user-friendly interface. It allows for real-time monitoring, portfolio management, and insightful decision-making—all while improving efficiency and scalability. For advisors looking to streamline their workflows and impress clients with stunning visuals, the YCharts Dashboard is a must-have tool.
With its powerful set of features, the Dashboard ensures less focus on manual data collection and more time on growing your business, strengthening client relationships, and delivering high-quality financial advice.
Conclusion: Elevate Your Workflow with the YCharts Dashboard
In today’s fast-paced financial environment, efficiency, accuracy, and real-time insights are paramount. The YCharts Dashboard provides financial professionals with the flexibility and power to monitor portfolios, create custom visuals, and collaborate with colleagues, all while helping to streamline workflows. Whether you are an independent advisor or part of a larger asset management firm, YCharts helps you stand out in client communication and portfolio management.
Whenever you’re ready, there are 3 ways YCharts can help you:
1. Looking to better communicate the importance of economic events to clients?
Send us an email at hello@ycharts.com or call (866) 965-7552. You’ll be directly in touch with one of our Chicago-based team members.
2. Want to test out YCharts for free?
Start a no-risk 7-Day Free Trial.
3. Download a copy of the Quarterly Economic Update slide deck:
Download the Economic Summary Deck:Disclaimer
©2025 YCharts, Inc. All Rights Reserved. YCharts, Inc. (“YCharts”) is not registered with the U.S. Securities and Exchange Commission (or with the securities regulatory authority or body of any state or any other jurisdiction) as an investment adviser, broker-dealer or in any other capacity, and does not purport to provide investment advice or make investment recommendations. This report has been generated through application of the analytical tools and data provided through ycharts.com and is intended solely to assist you or your investment or other adviser(s) in conducting investment research. You should not construe this report as an offer to buy or sell, as a solicitation of an offer to buy or sell, or as a recommendation to buy, sell, hold or trade, any security or other financial instrument. For further information regarding your use of this report, please go to: ycharts.com/about/disclosure
Next Article
What is YCharts? A Comprehensive Guide to the Leading Investment Research PlatformRead More →
