Your End-of-Year Guide to Tax-Efficient Portfolio Planning

With the S&P 500 advancing another 23% year-to-date in 2024 YTD, advisors and their clients will eventually face a bittersweet scenario: capital gains tax.
As the year winds down, advisors are gearing up for critical end-of-year tasks in preparation for their annual client reviews, including assessing potential tax liabilities for client portfolios.
This guide helps advisors deliver greater value to clients by minimizing their tax liabilities before the calendar turns. We’ll cover:
- Analyzing projected distributions from funds and portfolios
- Identifying tax-loss harvesting opportunities
- Communicating capital gains tax strategies to clients
- Simplifying tax-efficient portfolio transitions
- Illustrating the long-term impact of tax burdens and how to minimize them
Analyze Projected Distributions from Funds and Portfolios
As the final quarter of 2024 unfolds, advisors should review potential capital gains distributions from funds.
Recently added CapGainsValet data enables you to analyze distributions by source—income, short-term, or long-term capital gains—and quantify them as dollar amounts or percentages of a fund’s Net Asset Value (NAV).

Get in touch with us to access CapGainsValet data
The full suite of CapGainsValet data metrics include:
- Estimated Income Distribution (Dollar/Percent)
- Estimated Short Term Distribution (Dollar/Percent)
- Estimated Long Term Distribution (Dollar/Percent)
- Estimated Total Distribution (Percent)
- Cap Gains Date Last Updated
- Cap Gains Record Date, Ex-Date, and Payment Date
- Links to Capital Gains Estimates
With this expanded dataset, advisors can proactively manage tax impacts for client and model portfolios.
You can Quick Extract a client’s portfolio holdings into YCharts from a brokerage statement or screenshot, then employ the “Holdings Cap Gains” Quickflow at any time to pinpoint the origins of capital gains within a portfolio.
If a fund shows a significant tax liability, the “Cap Gains Analysis for Similar Funds” Quickflow speedily identifies potential replacement funds. This can be done in preparation for rebalancing a portfolio into a more tax-efficient solution or when exploring tax loss harvesting opportunities to offset gains.
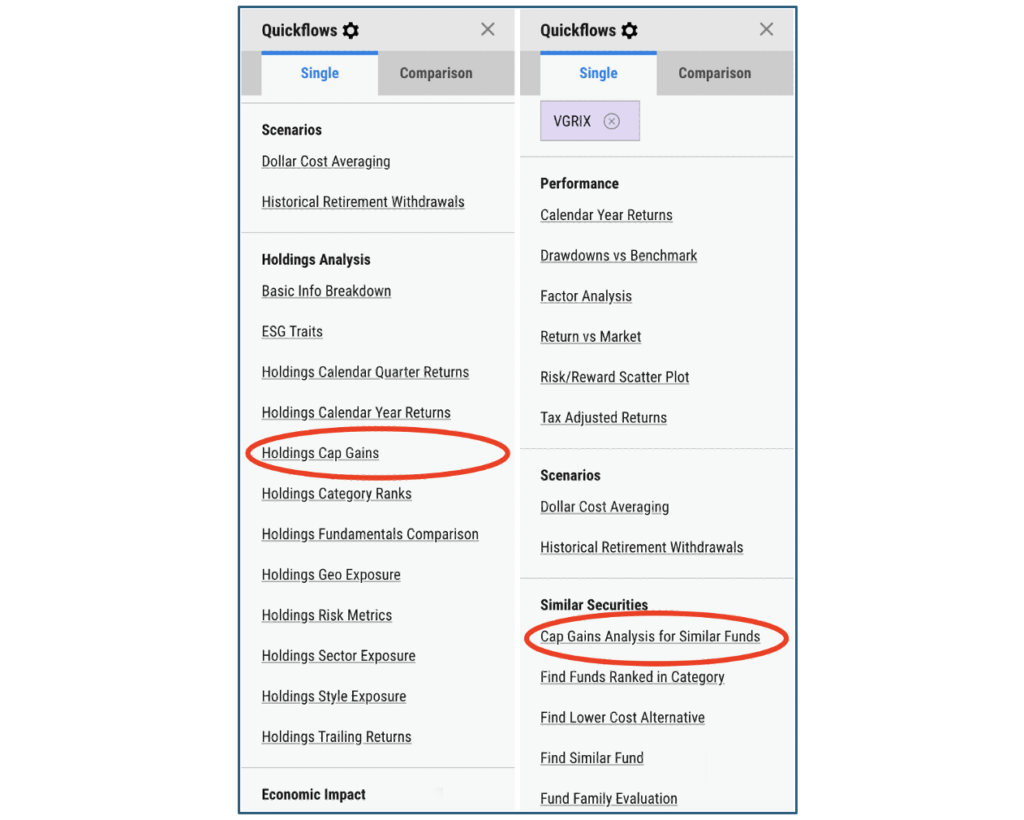
Streamline your workflows into as little as one click with Quickflows
By combining CapGainsValet with Quickflows, you can streamline workflows for finding ways to reduce clients’ capital gains tax burdens and planning effectively for future liabilities.
Reach Out to Add Cap Gains Metrics to Your AccountIdentify Tax-loss Harvesting Opportunities
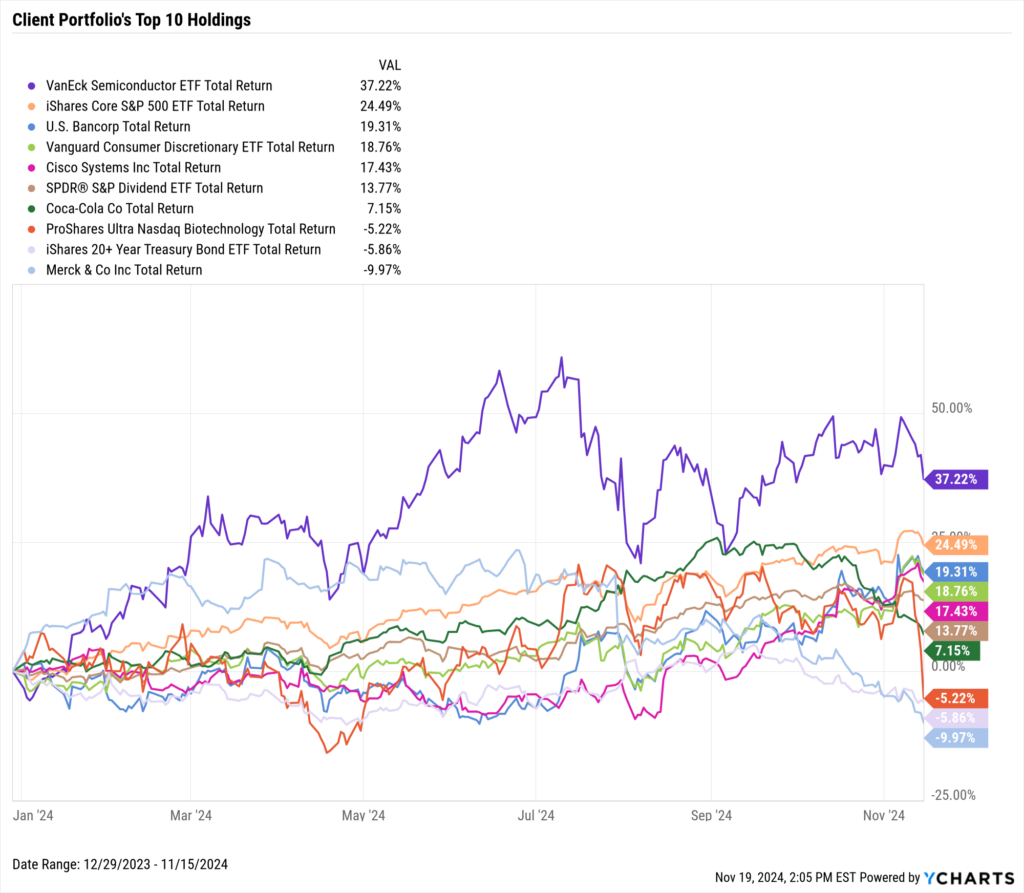
Tax-loss harvesting allows you to offset gains and ordinary income by realizing losses in underperforming positions.
Using YCharts’ Fundamental Charts tool, advisors can:
- Open holdings from a Watchlist, Comparison Table, or Model Portfolio.
- Visually track holding performance over custom time periods.
This makes it easy to identify holdings ripe for tax-loss harvesting, such as the three underperforming securities of a hypothetical client portfolio highlighted below:
Communicate Capital Gains Tax Strategies to Clients
After identifying where a client’s tax burden will come from and figuring out a plan to soften it, YCharts equips you with communication tools to illustrate that tax strategy to a client.
For clients who are unhappy receiving hefty tax bills each year, you can create tailored comparison reports with personalized proposals that demonstrate how a different investment vehicle could improve tax efficiency while keeping them on track to achieve their financial goals.
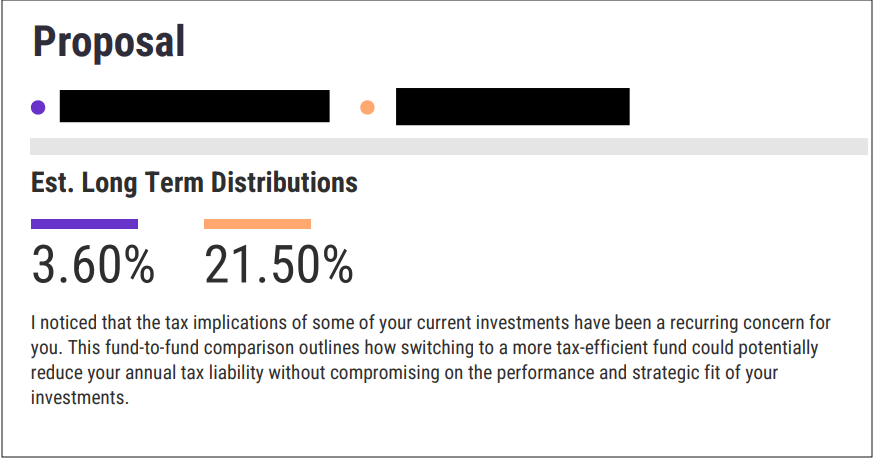
Get started with YCharts’ proposal generation tool
These proposals are customizable with unique talking points, such as a portfolio’s stock/bond allocation and estimated long-term distributions. Reports can be exported as PDFs for email or print, ensuring you leave clients with clear, actionable insights.
Simplify Tax-Efficient Portfolio Transitions
Prospective high-net-worth individuals will be especially concerned about the associated tax impact when switching advisors. Setting appropriate expectations regarding potential tax liabilities is crucial for not only establishing credibility but also the first step in building a solid foundation for a long-term advisory relationship.
With Transition Analysis, you can plan seamless tax-efficient transitions from one portfolio to a recommended model.
The Transition Analysis tool ensures transitions result in minimal projected tax liability by:
- Calculating all required transactions to move to a recommended portfolio
- Prioritizing selling of losing positions, followed by winning positions from smallest to largest over time as needed, to minimize tax liabilities
- Consolidating transactions and outcomes into a single, client-ready PDF
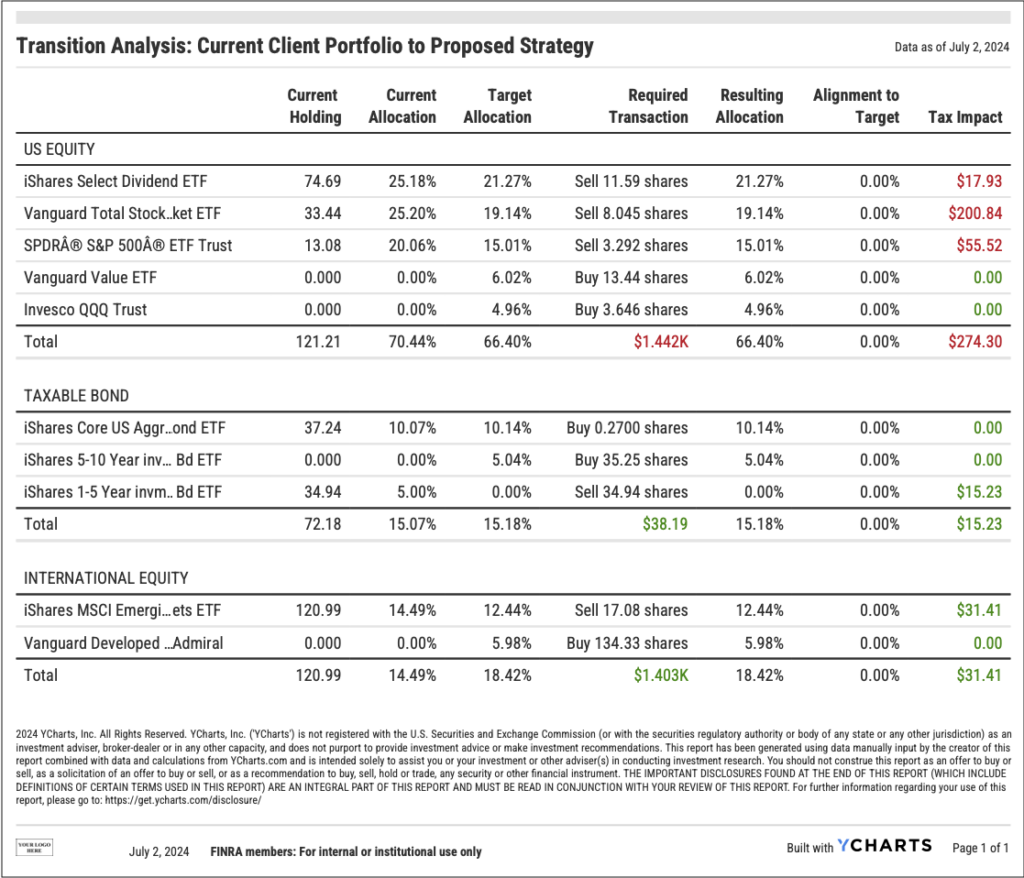
Start tax-efficiently transitioning portfolios for your clients and prospects
Advisors can significantly reduce the amount of manual work and mental energy typically associated with this part of bringing on a new client.
Illustrate Long-Term Impacts of Tax Burdens with Scenarios
Finally, you can position clients for long-term success by showing scenarios that address tax concerns early on in the investing journey.
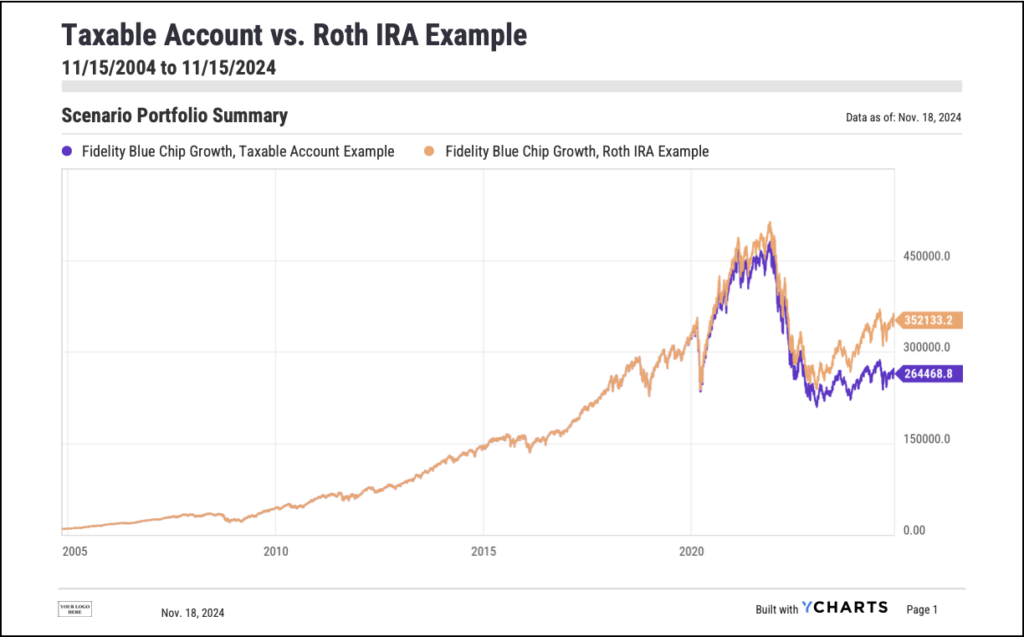
Suppose you had a client named Mary who started investing in November 2004. Mary invested $10,000 in Fidelity’s Blue Chip Growth (FBGRX) fund and contributed $500 monthly for the next 15 years. By November 2019, Mary would have contributed a total of $100,000, and that investment would have grown to $352,133.
Then Mary entered retirement and sought to withdraw $5,000 monthly for the first five years at an effective tax rate of 15%.
- In a Roth IRA, Mary could withdraw funds tax-free.
- In a taxable brokerage account, Mary would need to withdraw $5,882 monthly in order to cover the tax liability and still meet the $5,000 monthly income goal. This would have resulted in a portfolio worth almost $88,000 less after the first five years of retirement.
Help your clients visualize and plan their retirement with YCharts
By clearly illustrating such scenarios, you can demonstrate the value of tax-efficient strategies and help clients like Mary achieve their financial aspirations.
With 2024 nearing its end, now is the time to prepare for client reviews and demonstrate value through proactive tax management. YCharts supports you in achieving these goals.
Whenever you’re ready, there are 3 ways YCharts can help you:
1. Looking for a best-in-class data & visualization tool?
Send us an email at hello@ycharts.com or call (866) 965-7552. You’ll be directly in touch with one of our Chicago-based team members.
2. Want to test out YCharts for free?
Start a no-risk 7-Day Free Trial.
3. Download a copy of The Top 10 Visuals for Client and Prospect Meetings slide deck to educate clients on a range of investing topics:
Disclaimer
©2024 YCharts, Inc. All Rights Reserved. YCharts, Inc. (“YCharts”) is not registered with the U.S. Securities and Exchange Commission (or with the securities regulatory authority or body of any state or any other jurisdiction) as an investment adviser, broker-dealer or in any other capacity, and does not purport to provide investment advice or make investment recommendations. This report has been generated through application of the analytical tools and data provided through ycharts.com and is intended solely to assist you or your investment or other adviser(s) in conducting investment research. You should not construe this report as an offer to buy or sell, as a solicitation of an offer to buy or sell, or as a recommendation to buy, sell, hold or trade, any security or other financial instrument. For further information regarding your use of this report, please go to: ycharts.com/about/disclosure
Next Article
US Housing Starts Monthly UpdateRead More →
