Upcoming Webinars
Find the latest insights, best practices, and market trends for wealth management professionals.
Join Our Next Event
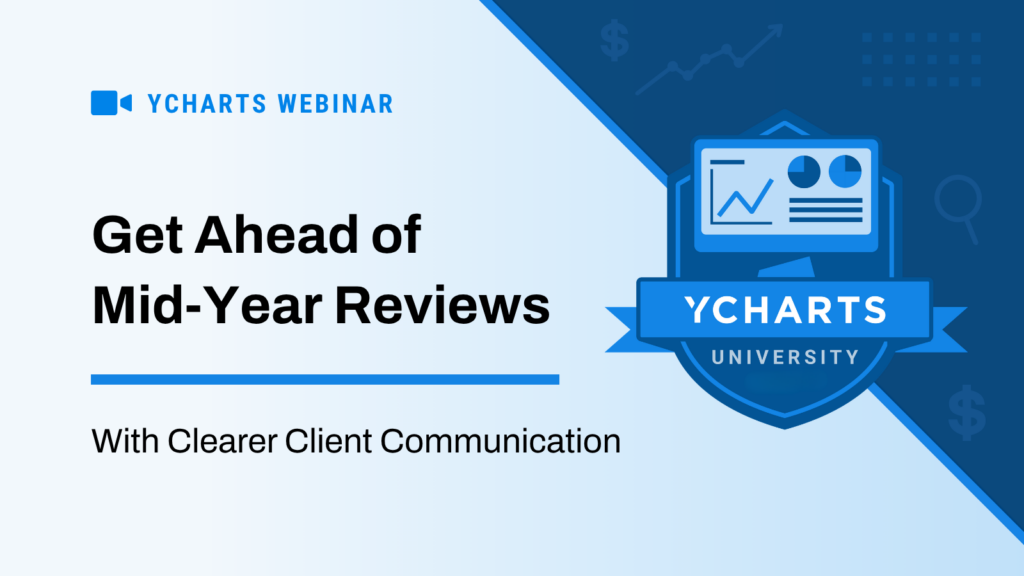
YCharts University: Get Ahead of Mid-Year Reviews With Clearer Client Communication
By May, most advisors are deep into follow-ups, mid-year prep, and ongoing client conversations. This is where complexity starts to surface.
Performance, allocations, and market narratives don’t always translate clearly, and when they don’t, confidence can slip.
The opportunity isn’t to explain more, but to make things clearer, so clients can quickly understand where they stand and what comes next.
In this 30-minute workshop, you’ll learn how to:
✅ Prepare for mid-year reviews by clearly showing performance, allocation shifts, and progress toward goals
✅ Reinforce portfolio strategy using Stress Tests to address risk, volatility, and “what if” scenarios
✅ Simplify estate and long-term planning conversations with visuals clients can actually understand
✅ Use YCharts’ AI Suite to quickly answer client questions and generate talking points in real time
Featured Tools: Stress Tests, Reports & Proposals, Fundamental Charts, AI Chat
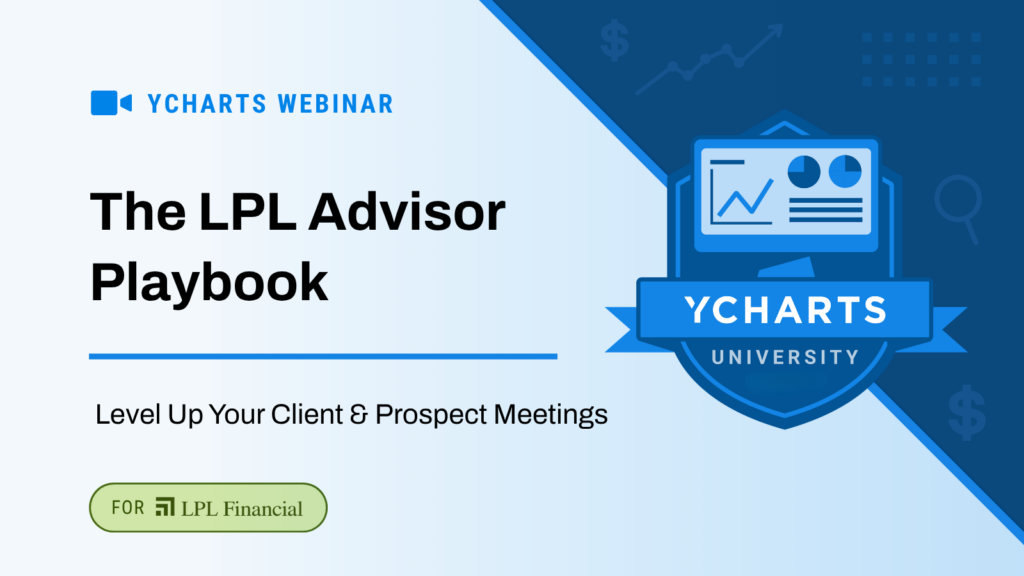
The LPL Advisor Playbook: Level Up Your Client & Prospect Meetings
Every meeting is an opportunity, but preparation is what separates advisors who build trust from those who don’t. With YCharts’ ClientWorks integration and tools like Quick Extract, Dashboards, Alerts, and Portfolio Analytics, you’ll walk into every client and prospect conversation ready.
In this 30-minute workshop, you’ll build a repeatable pre-meeting routine using YCharts so every conversation starts with confidence and context.
You’ll learn how to:
Pull Client Context In Seconds
Use the ClientWorks integration and Quick Extract to walk in knowing exactly where each client stands.
Surface The Right Talking Points
Dashboards and Alerts flag what’s changed and what needs addressing before you ever sit down.
Anticipate Questions Before They’re Asked
Use Portfolio Analytics to spot performance gaps, allocation shifts, and risk exposure ahead of time.
Impress Prospects From The First Meeting
A structured, data-driven process shows you’ve done your homework before the conversation even starts.
Talk to one of our experts.
Reach out for a personalized demo with a YCharts product specialist.