Upcoming Webinars
Find the latest insights, best practices, and market trends for wealth management professionals.
Join Our Next Event
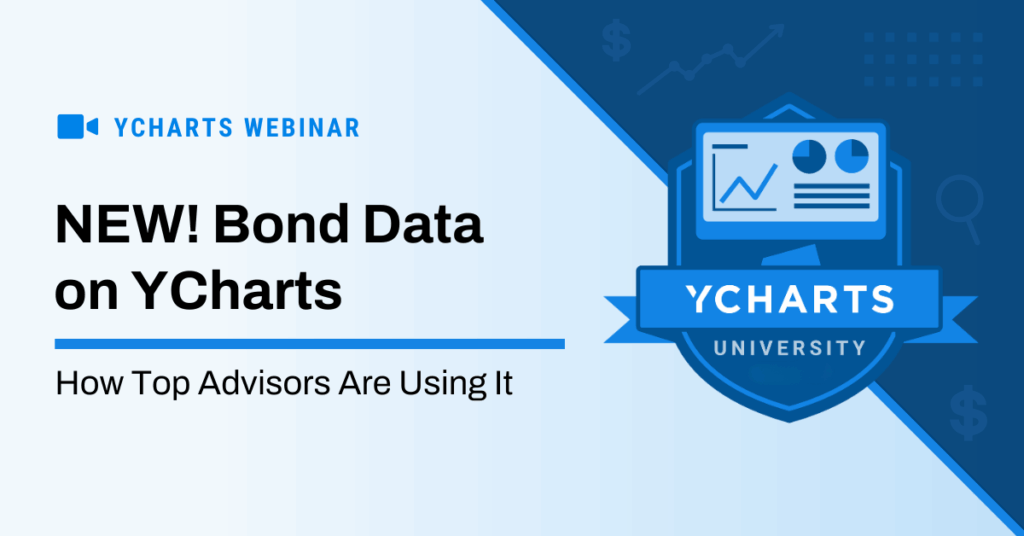
YCharts’ New Bond Data & How Top Advisors Are Using It
Join us to discuss:
With Q3 reviews wrapping up, markets shifting, and holiday spending ahead, October is the time to refresh planning conversations and position portfolios for what’s next. In this workshop, we’ll show you how top teams turn October’s opportunities into client wins while scaling efficiency across their practice.
You’ll learn how to:
- Build and adjust Model Portfolios with our (new!) Bond Data, giving your entire team consistent strategies to apply across clients.
- Use Comp/Timeseries Tables to surface Q3 performance trends and streamline quarterly reviews.
- Deliver polished Reports & Proposals that ensure consistent, client-ready messaging across teams to free up time for growth-focused work.
Featured Tools: Model Portfolios, Bond Data, Comp/Timeseries Tables, Reports & Proposals
Talk to one of our experts.
Reach out for a personalized demo with a YCharts product specialist.