Monthly Market Wrap: May 2024

Welcome back to the Monthly Market Wrap from YCharts, where we dissect crucial market trends for advisors and their clients. This May, US equity indices clawed back losses incurred in April while treasury yields fell. On the economic front, the US employment situation weakened and inflation remained above the Fed’s target of 2%.
Want to use these visuals in your own presentations? Download our free Monthly Market Wrap slide deck, containing all charts featured in the Market Wrap and more in a shareable, presentation-ready format.
May 2024 Market Summary: Equities Bounce Back, Sticky Inflation and Lower Long-Term Treasury Yields
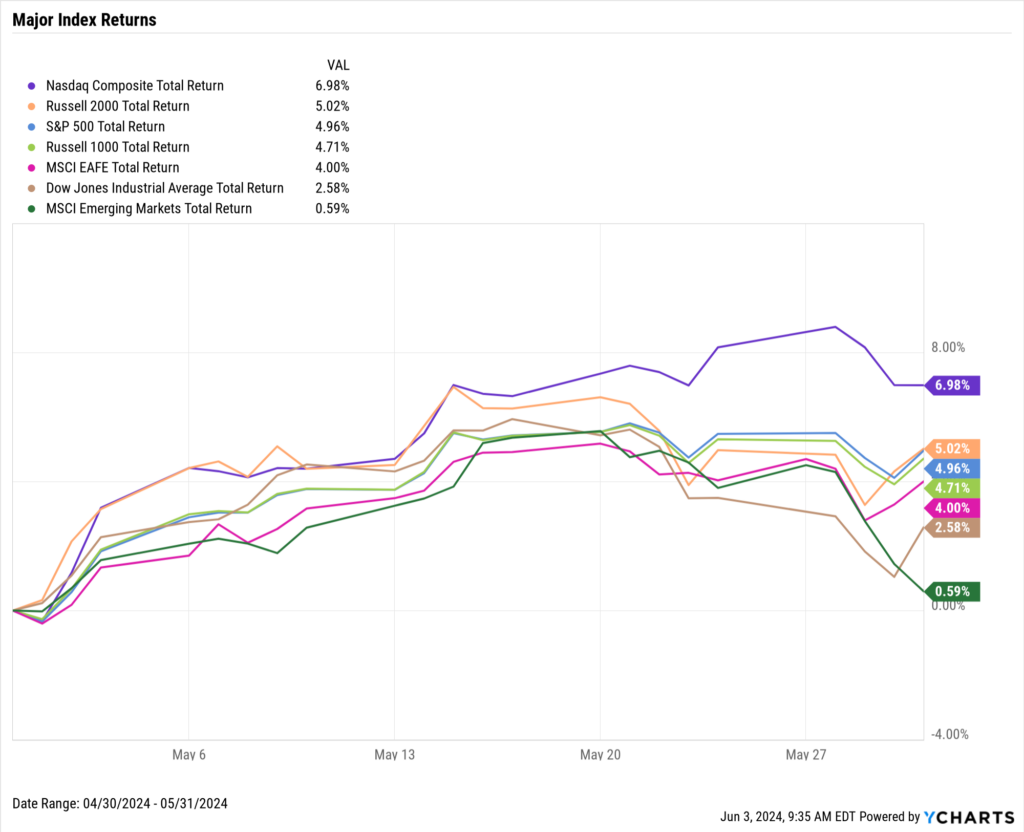
Equities returned to winning ways in May following a down April that had stunted three straight months of gains in 2024. The Dow Jones Industrial Average rose 2.6% in May, the S&P 500 advanced 5%, and the NASDAQ surged 7%. EAFE gained 4% in May, while Small Caps bested Large Caps by three-tenths of a percentage point.
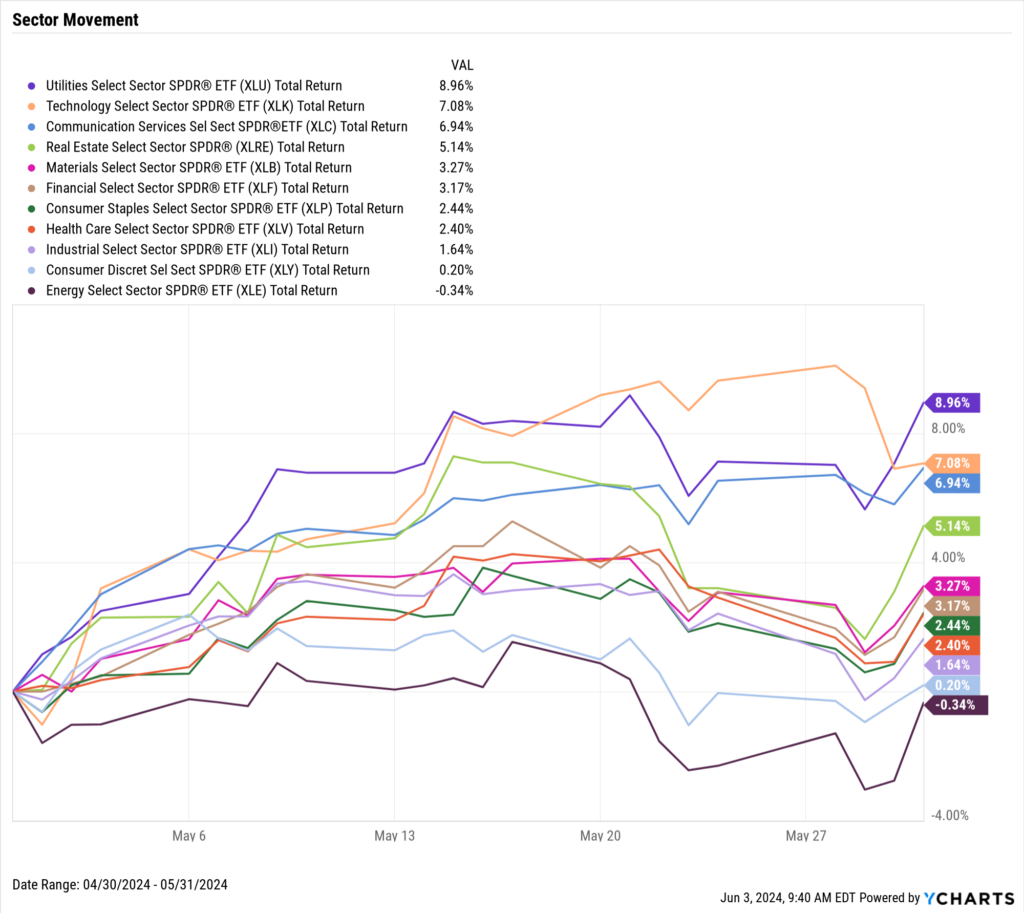
Utilities was the best-performing sector for the second straight month, jumping 9% in May. Technology and Communication Services followed with respective gains of 7.1% and 7%. The only negative sector in May was Energy, which slipped 0.3%.
Both new single-family home sales and existing home sales slumped in May; at the same time, the median existing home sales price advanced above $400,000. Inflation remained in the mid-three percent range for the tenth straight month, while US PPI increased to 2.17%. The unemployment rate increased to 3.9%, and April’s job gains were the lowest in seven months.
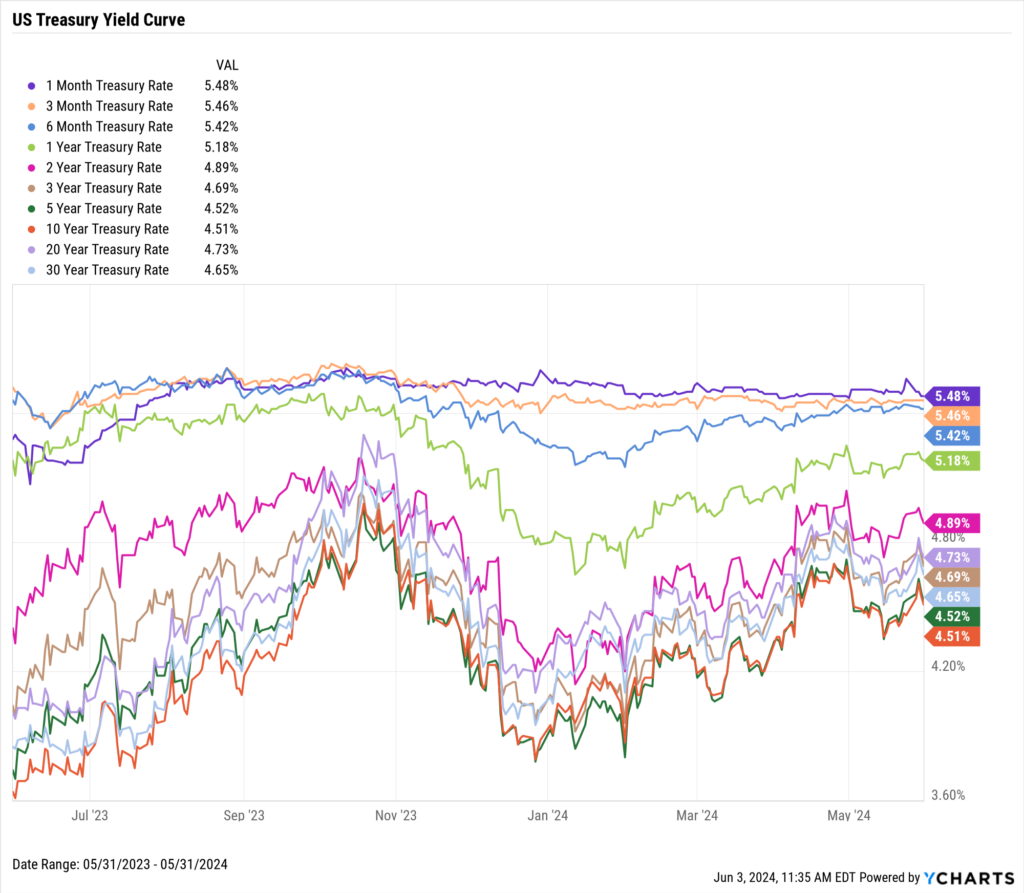
Yields on mid- to long-term Treasury bonds declined in May while T-Bill instruments saw minimal movement. For the second straight month, the 5-year Treasury note saw the largest movement of any duration on the curve, down 20 basis points. The 2-year, 3-year, 10-year, 20-year, and 30-year all decreased by double-digit basis points, while yields on the 1-month and 3-month T-Bills were unchanged.
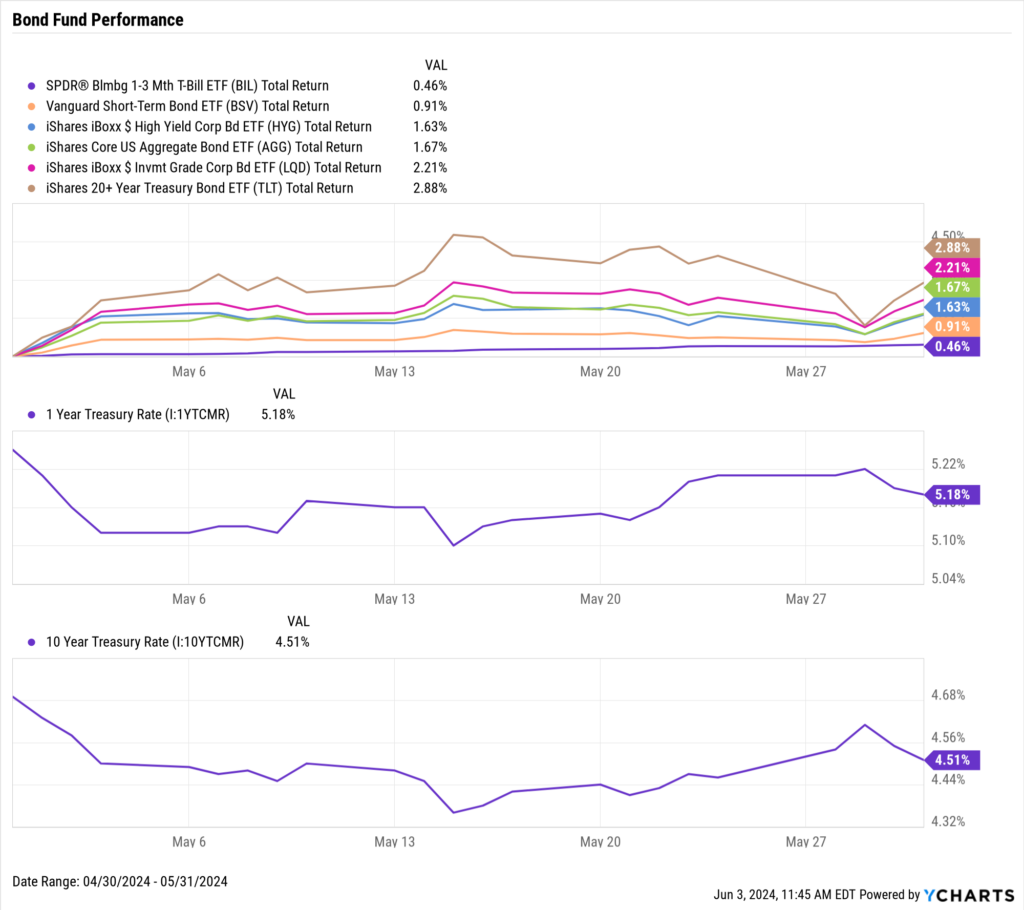
Bond funds saw some gains on the back of lower yields. The iShares 20+ Year Treasury Bond ETF (TLT) advanced 2.9%, the largest increase of any bond fund tracked on our chart (below).
Jump to Fixed Income Performance
Want to create your own monthly recap, complete with these charts in a presentation deck that contains your firm’s branding? Start a Free Trial →
Off the YCharts! Sell in May and Go Away?
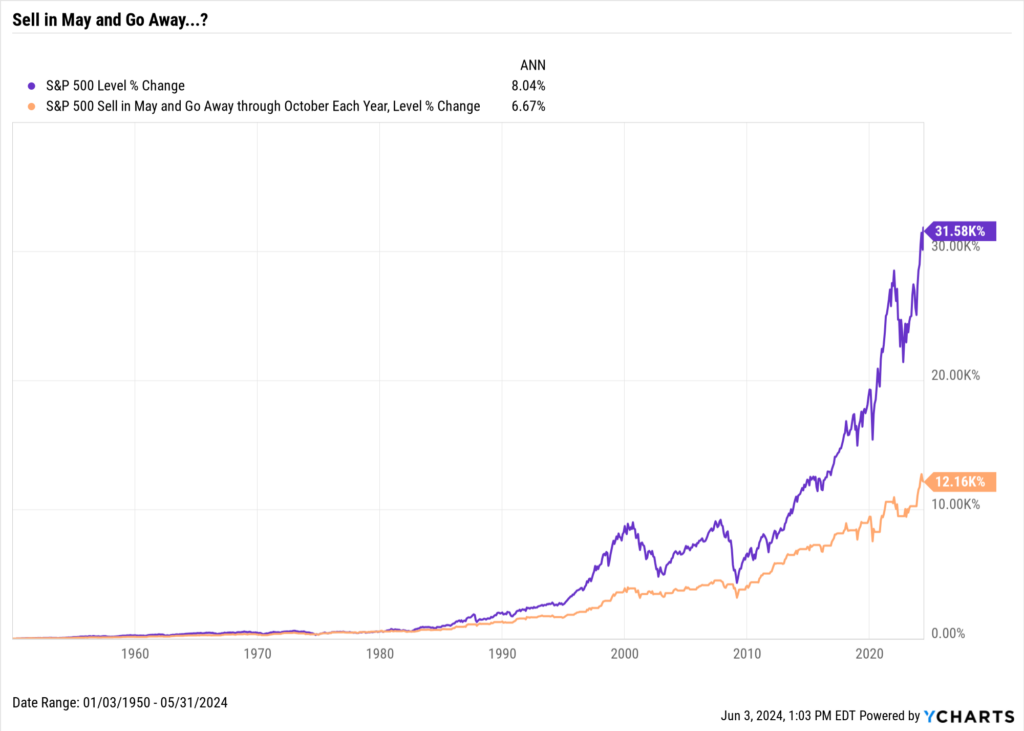
The old stock market adage of “Sell in May and Go Away” refers to an investing strategy that suggests pulling investments out of the market in May in order to miss the seasonally weaker stock market performance that occurs between May and October.
But to what extent is this adage actually true? And is being uninvested during this period beneficial or harmful over the long-term? We looked at the data behind “Sell in May and Go Away” to find out.
Below is a table showing average S&P 500 returns each month since 1950:
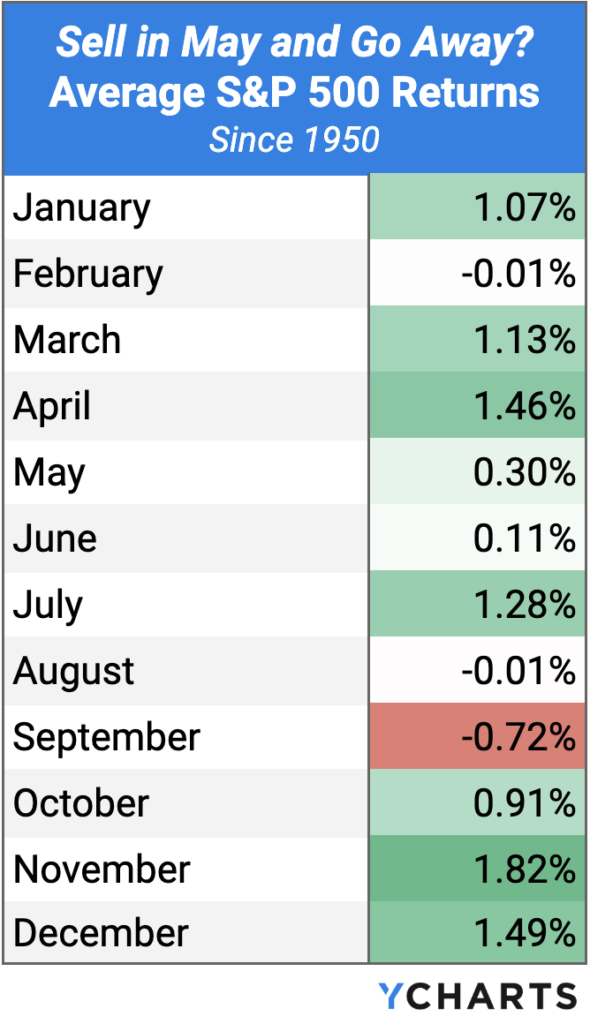
While it is true that most months between May and October have historically delivered lower stock market returns versus those between November and April, selling in May and moving to cash for six months each year produced significantly lower annualized returns over the long run as a result of less time in the market.
Download Visual | Modify in YCharts | Chart not loading? Get in touch to access
Equity Performance: Stocks Rebound Across the Board
Major Indexes
Download Visual | Modify in YCharts | View Below Table in YCharts
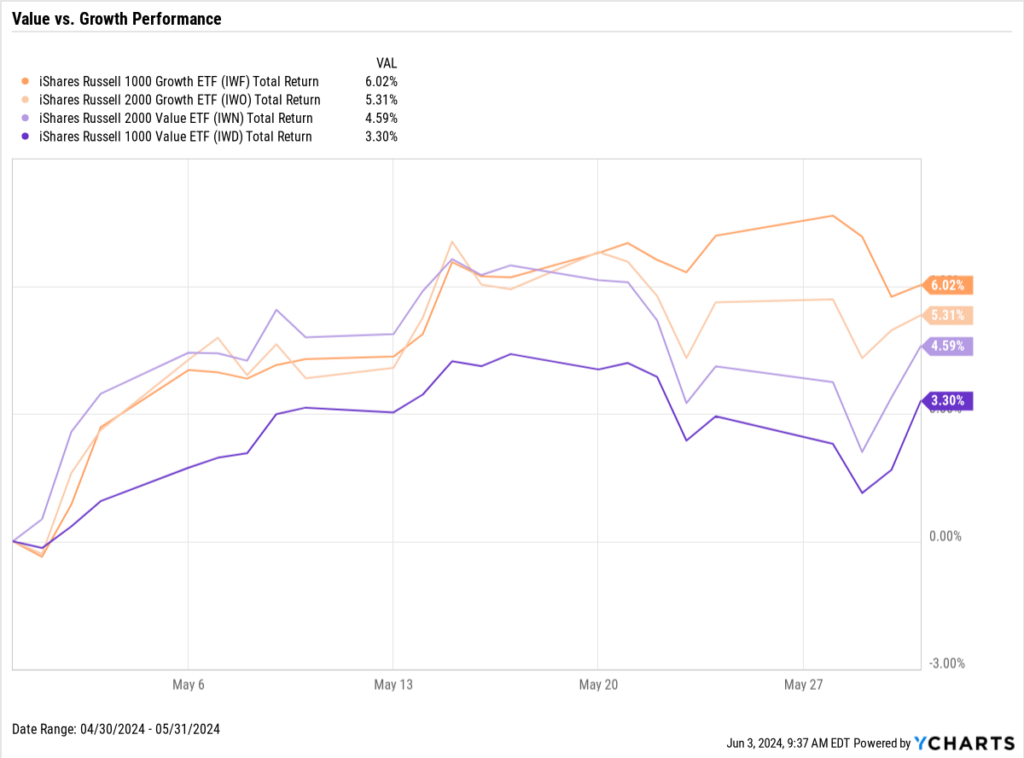
Value vs. Growth Performance
Download Visual | Modify in YCharts | View Below Table in YCharts
US Sector Movement
Download Visual | Modify in YCharts | View Below Table in YCharts
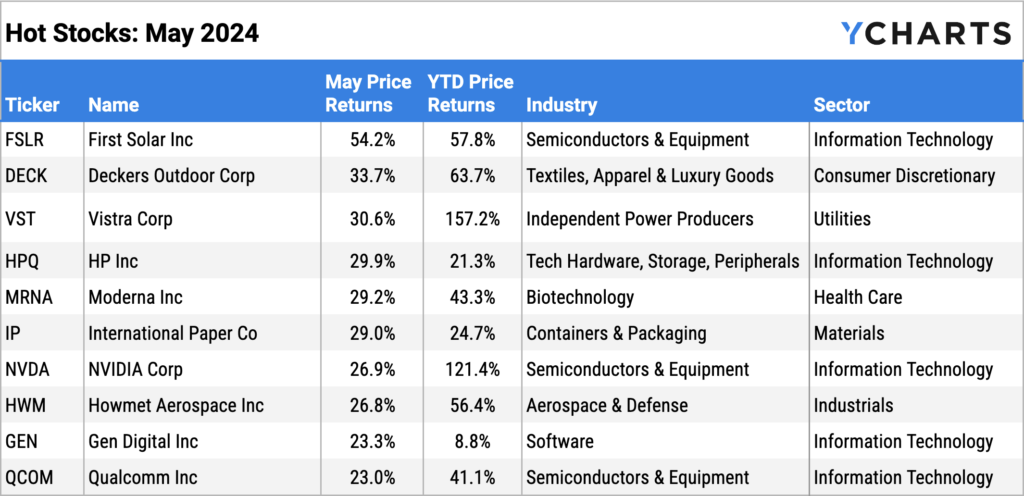
Hot Stocks: Top 10 S&P 500 Performers of May 2024
Download Visual | Modify in YCharts
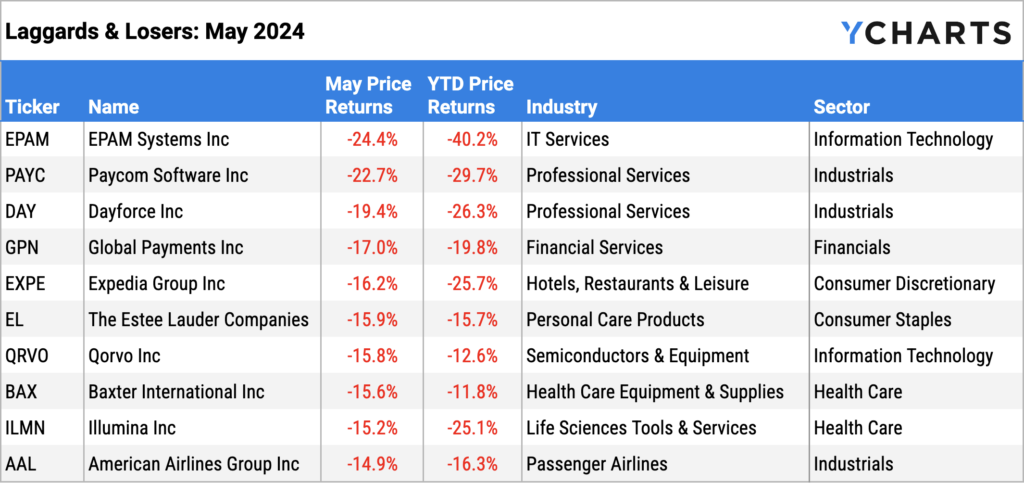
Laggards & Losers: 10 Worst S&P 500 Performers of May 2024
Download Visual | Modify in YCharts
Featured Market News and YCharts Insights
Big Investors Demand Hedge Funds Beat Cash Before Charging Fees (FA-Mag)
How Does the Stock Market Perform in an Election Year? with Nick Maggiulli (YCharts)
Record-breaking summer heat set to spark commodities volatility (InvestmentNews)
Introducing YCharts’ Tearsheet Builder: Customizable Reports for Advisors and Wholesalers (YCharts)
Banks Pump Billions More Into Private Credit as Frenzy Grows (WealthManagement.com)
7 Best Asset Classes to Hedge Against Inflation (YCharts)
Economic Data Overview: Inflation Persists, Home Sales Decline While Values Rise
Employment
April’s unemployment rate inched up to 3.9% while the labor force participation rate remained unchanged at 62.7%. Nonfarm payroll data showed 175,000 new jobs were added in April, the lowest level of job gains since October 2023 and below the expected value of 243,000 for the month.
Consumers and Inflation
April’s US inflation figure came in at 3.36%, marking the tenth consecutive month that YoY inflation has hovered in the 3 to 4 percent range. Core Inflation dropped to 3.61%, the lowest YoY rate since May 2021. The monthly US Consumer Price Index rose 0.31% in April, and US Personal Spending posted a small monthly increase of 0.20%. No changes have been made to the Fed Funds Rate of 5.50% since the most recent FOMC meeting on May 1st, 2024.
Production and Sales
After posting an expansion reading in March for the first time since October 2022, the US ISM Manufacturing PMI slipped another 0.5 points further into contraction territory in May to 48.70. The YoY US Producer Price Index for April came in at 2.17%, the first time above 2% since April 2023 and third consecutive monthly increase, while April US Retail and Food Services Sales were unchanged MoM.
Housing
US New Single-Family Home Sales fell 4.7% in April, while US Existing Home Sales slipped 1.9% MoM. Despite the reduced housing demand, the Median Sales Price of Existing Homes increased 3.7% in April to $407,600. Mortgage rates fell slightly in May; as of May 30th, the 15-year Mortgage Rate lowered to 6.36% and the 30-year came in just above 7% at 7.03%.
Commodities
The price of Gold rose slightly in May to $2,348.30 per ounce as of May 31st following several surges in 2024. Crude oil prices fell MoM; as of May 28th, the price of WTI slipped 3.1% to $80.90 per barrel while Brent recorded a 7.8% downturn to clock in at $81.34 per barrel. As a result, the average price of gas fell 8 cents to $3.70 per gallon.
Cryptocurrencies
Cryptocurrency prices rebounded in May. The price of Bitcoin increased 7.2% to $68,372 while Ethereum surged 16.7% to $3,749. Bitcoin is now up 61.9% so far in 2024, and Ethereum is 63.4% higher this year.
Fixed Income Performance: Insights into Bond ETFs and Treasury Yields
US Treasury Yield Curve
1 Month Treasury Rate: 5.48%
3 Month Treasury Rate: 5.46%
6 Month Treasury Rate: 5.42%
1 Year Treasury Rate: 5.18%
2 Year Treasury Rate: 4.89%
3 Year Treasury Rate: 4.69%
5 Year Treasury Rate: 4.52%
10 Year Treasury Rate: 4.51%
20 Year Treasury Rate: 4.73%
30 Year Treasury Rate: 4.65%
Download Visual | Modify in YCharts
Bond Fund Performance
Download Visual | Modify in YCharts | View Below Table in YCharts
Stay updated with the latest market trends, economic data, and financial analysis with YCharts, your go-to source for financial insights and advisor tools. Download the visual aids directly from YCharts, and contact us for customized access to these charts.
Have a great June! 📈
Whenever you’re ready, there are 3 ways YCharts can help you:
1. Looking for a communication tool to show the impact of monthly market events?
Send us an email at hello@ycharts.com or call (866) 965-7552. You’ll be directly in touch with one of our Chicago-based team members.
2. Want to test out YCharts for free?
Start a no-risk 7-Day Free Trial.
3. Download a copy of the Monthly Market Wrap slide deck:
Disclaimer
©2024 YCharts, Inc. All Rights Reserved. YCharts, Inc. (“YCharts”) is not registered with the U.S. Securities and Exchange Commission (or with the securities regulatory authority or body of any state or any other jurisdiction) as an investment adviser, broker-dealer or in any other capacity, and does not purport to provide investment advice or make investment recommendations. This report has been generated through application of the analytical tools and data provided through ycharts.com and is intended solely to assist you or your investment or other adviser(s) in conducting investment research. You should not construe this report as an offer to buy or sell, as a solicitation of an offer to buy or sell, or as a recommendation to buy, sell, hold or trade, any security or other financial instrument. For further information regarding your use of this report, please go to: ycharts.com/about/disclosure
Next Article
The Best Performing Large Cap Mutual Funds Of the Last 100 YearsRead More →