The Best Performing Large Cap Mutual Funds Of the Last 100 Years
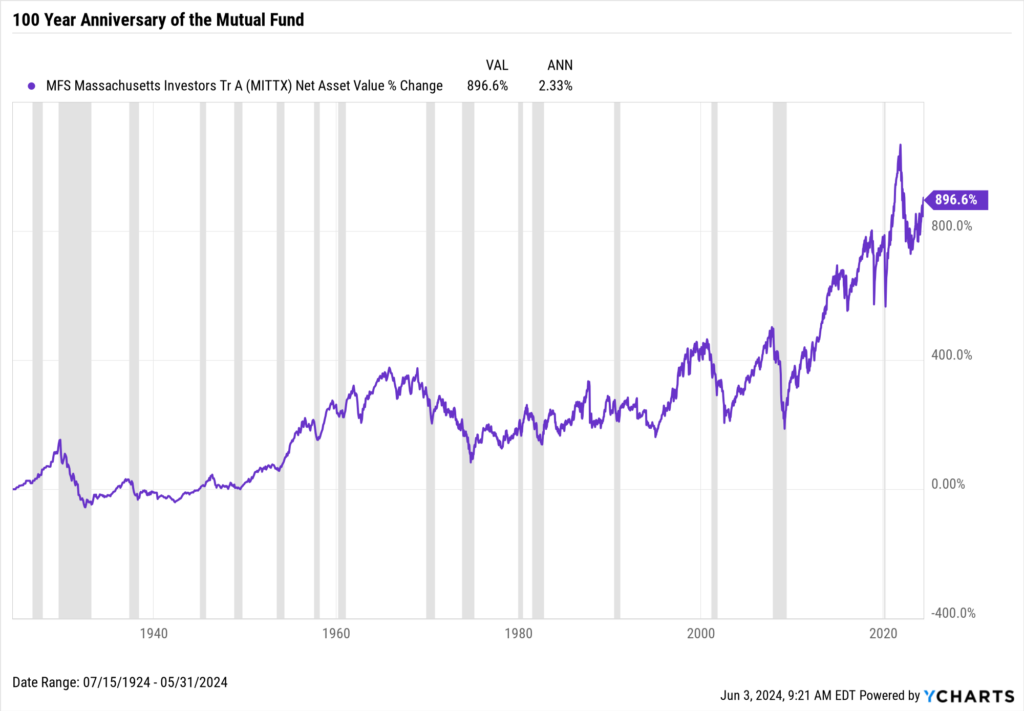
2024 marks the 100th anniversary of the first US-listed mutual fund. The MFS Massachusetts Investors Trust (MITTX) will turn 100 in July 2024. The industry has transformed from rather illiquid markets of the early 20th century to one where the mutual fund is currently being challenged by the real-time trading benefits of the exchange-traded fund (ETF).
Download Visual | Modify in YCharts
Though the investment landscape has changed, asset managers trying to create funds that outperform their benchmarks and competitors have not.
To celebrate the mutual fund’s centennial anniversary, we’ve compiled visuals of the best-performing large-cap funds across various periods and examined how they currently provide differentiated value to investors by looking at their unique holdings.
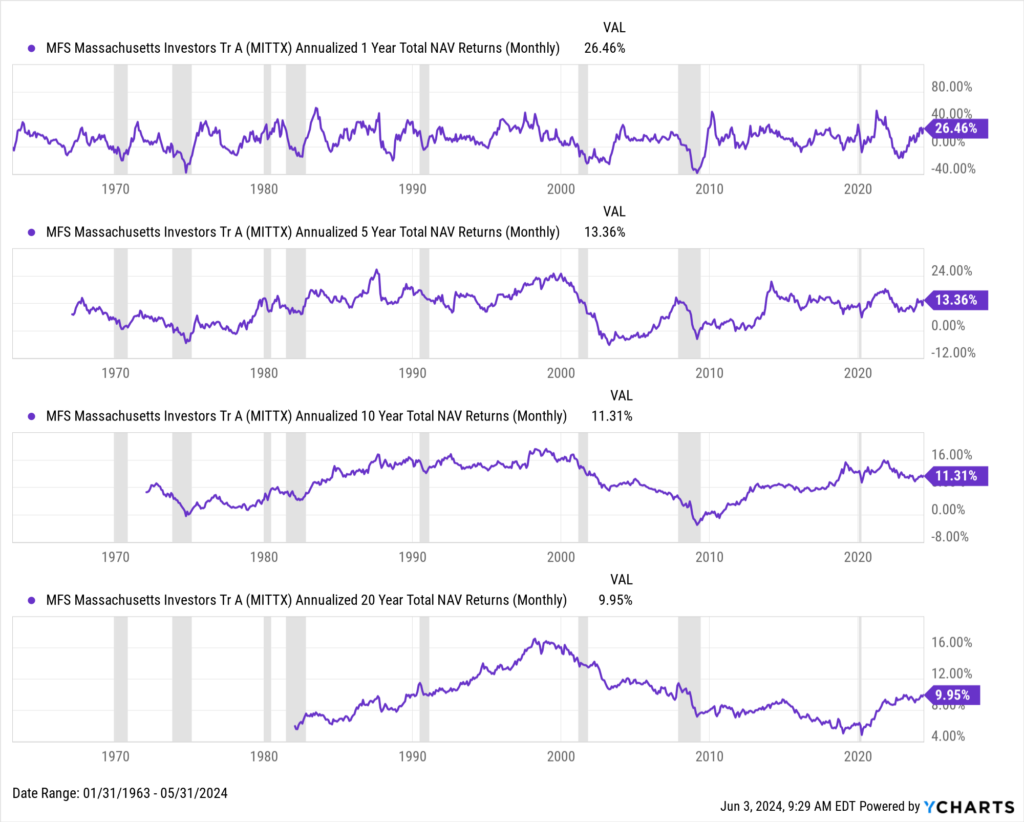
Leveraging YCharts’ Fund Screener, we identified the best-performing large cap mutual funds, ranking them by the best annualized NAV performance over 1-, 5-, and 10-year periods as of May 31, 2024. Each section includes a table of the best-performing funds, a rolling returns visual for the top strategies in each category, and a visual depicting the number of unique holdings in these funds relative to the passive benchmark strategy.
Download Visual | Modify in YCharts
Use the links below to navigate to a specific section:
Large Blend Mutual Fund Performance
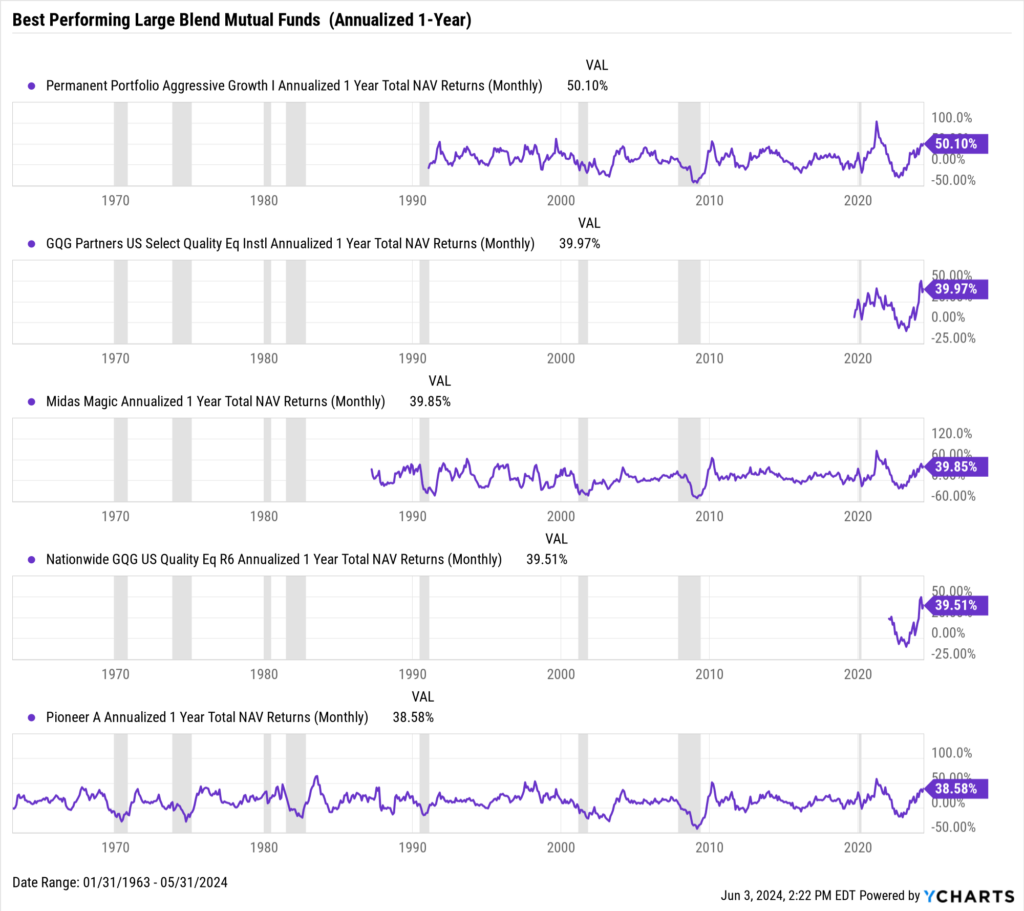
Best Performing Large Blend Mutual Fund on an Annualized 1-Year Basis
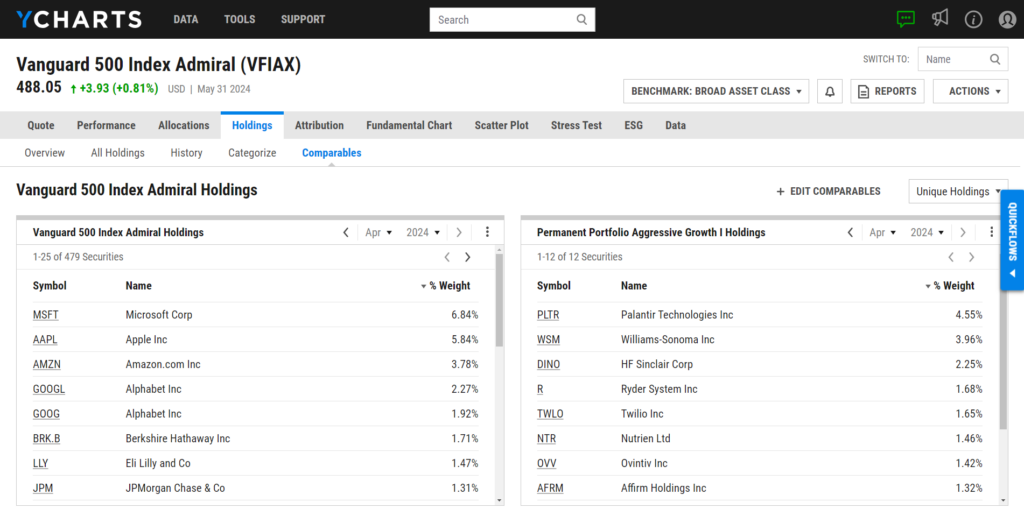
As of May 31, 2024, Permanent Portfolio Aggressive Growth I (PAGRX) was the best-performing large blend mutual fund on an annualized 1-year basis. Since the strategy’s inception (January 2, 1990), it has produced 50.1% annualized 1-year NAV returns.
Download Visual | Modify in YCharts
GQG Partners US Select Quality Equity Fund Institutional (GQEIX), Midas Magic (MISEX), Nationwide GQG US Quality Equity R6 (NWAVX), and Pioneer A (PIODX) rounded out the top five. View the complete list here.
Of the 38 securities held by PAGRX, 12, including Palantir Technologies Inc (PLTR), Williams-Sonoma Inc (WSM), and HF Sinclair Corp (DINO), were not held by Vanguard 500 Index Admiral (VFIAX) as of April 30, 2024.
Best Performing Large Blend Mutual Fund on an Annualized 5-Year Basis
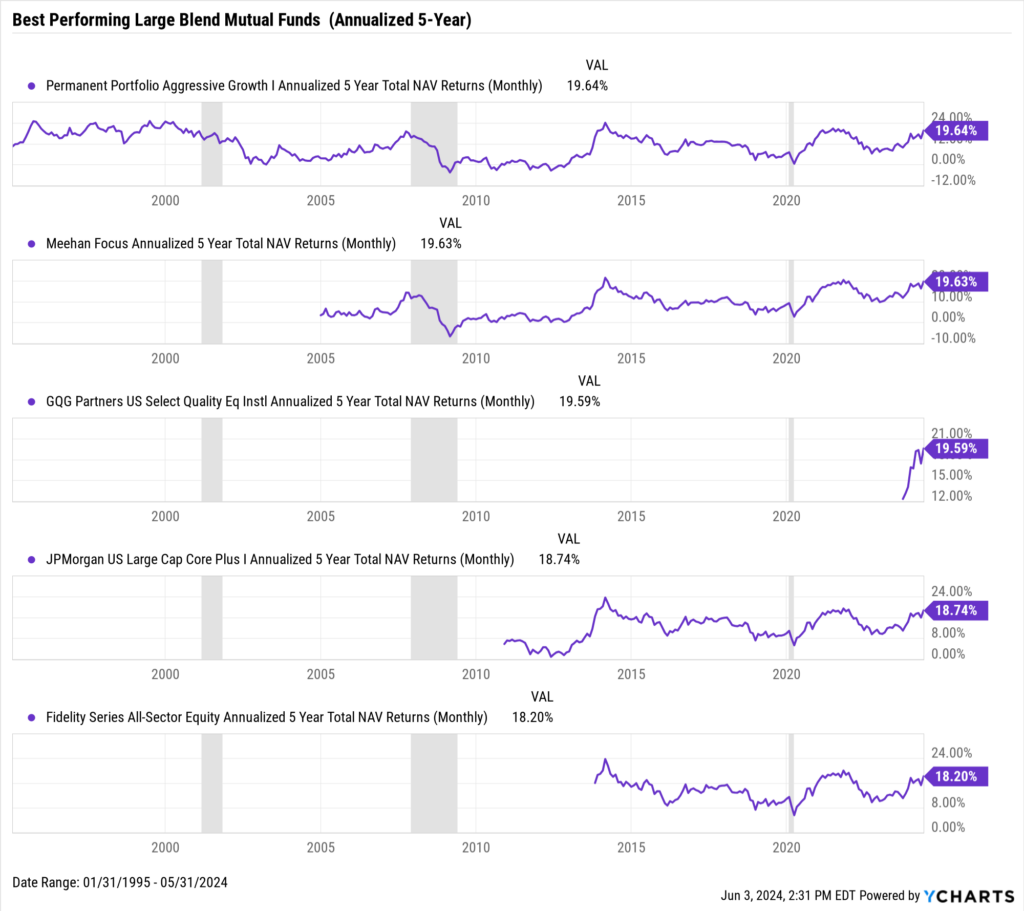
As of May 31, 2024, Permanent Portfolio Aggressive Growth I (PAGRX) was the best-performing large blend mutual fund on an annualized 5-year basis. Since the strategy’s inception (January 2, 1990), it has produced 19.6% annualized 5-year NAV returns.
Download Visual | Modify in YCharts
Meehan Focus (MEFOX), GQG Partners US Select Quality Equity Fund Institutional (GQEIX), JPMorgan US Large Cap Core Plus I (JLPSX), and Fidelity Series All-Sector Equity (FSAEX) rounded out the top five. View the complete list here.
Best Performing Large Blend Mutual Fund on an Annualized 10-Year Basis
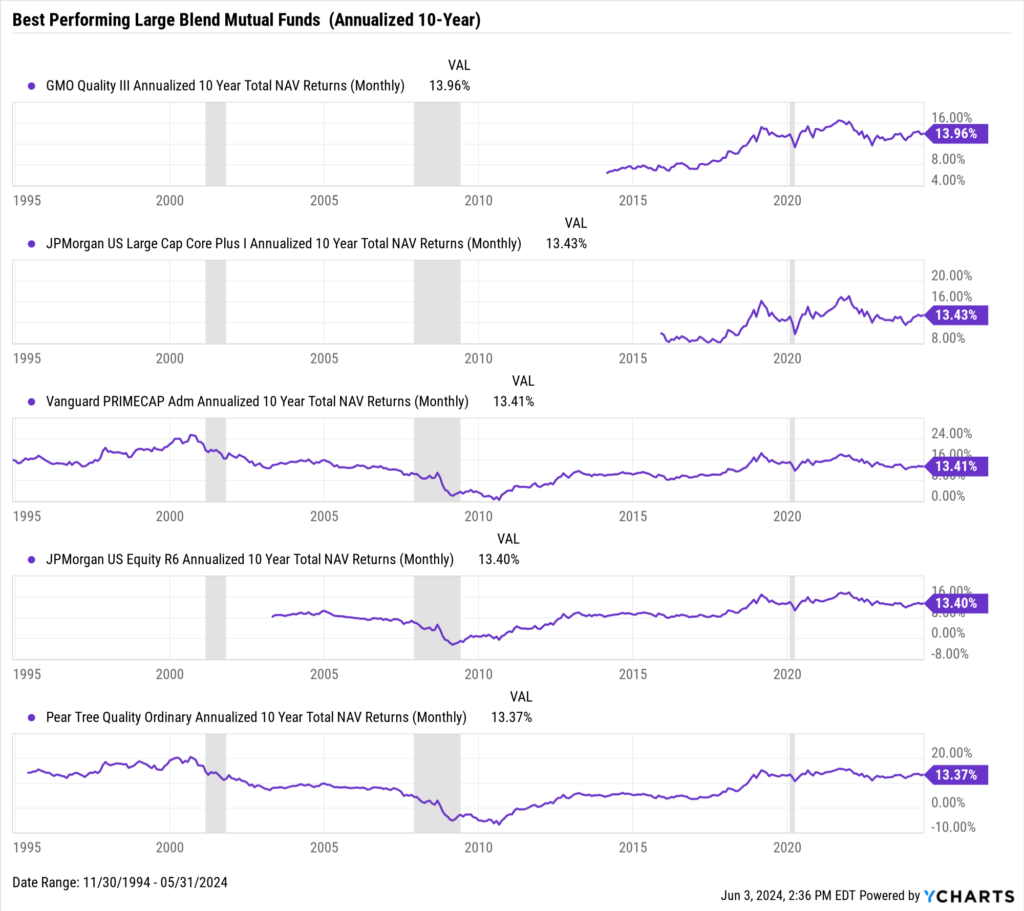
As of May 31, 2024, GMO Quality III (GQETX) was the best-performing large blend mutual fund on an annualized 10-year basis. Since the strategy’s inception (February 6, 2004), it has produced 14% annualized 10-year NAV returns.
Download Visual | Modify in YCharts
JPMorgan US Large Cap Core Plus I (JLPSX), Vanguard PRIMECAP Admiral (VPMAX), JPMorgan US Equity R6 (JUEMX), Pear Tree Quality Ordinary (USBOX), and rounded out the top five. View the complete list here.
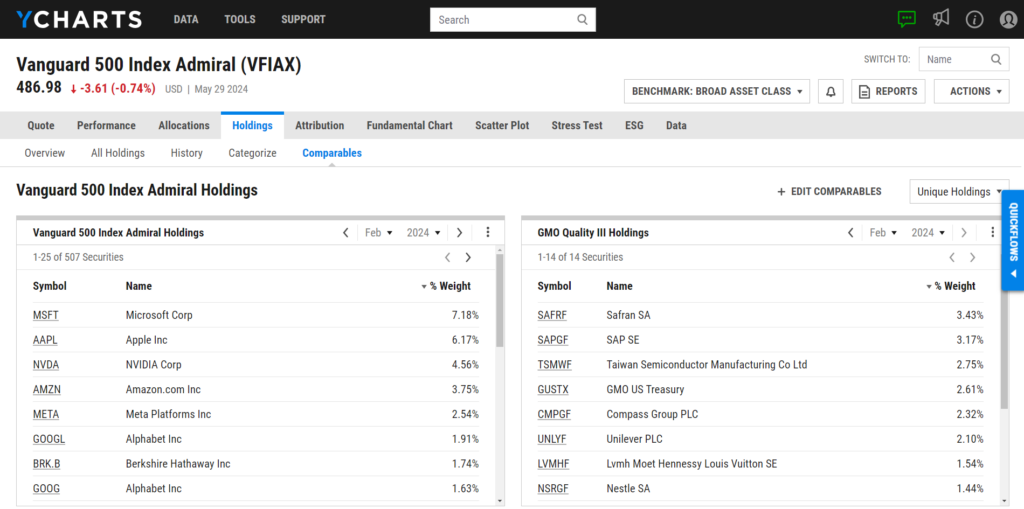
Of the 45 publicly traded equities held by GQETX, 14, including Safran SA (SAFRF), SAP SE (SAPGF), and Taiwan Semiconductor Manufacturing Co Ltd (TSMWF), were not held by Vanguard 500 Index Admiral (VFIAX) as of February 29, 2024.
Large Growth Mutual Fund Performance
Best Performing Large Growth Mutual Fund on an Annualized 1-Year Basis
As of May 31, 2024, Catalyst Insider Buying A (INSAX) was the best-performing large growth mutual fund on an annualized 1-year basis. Since the strategy’s inception (July 29, 2011), it has produced 48.6% annualized 1-year NAV returns.
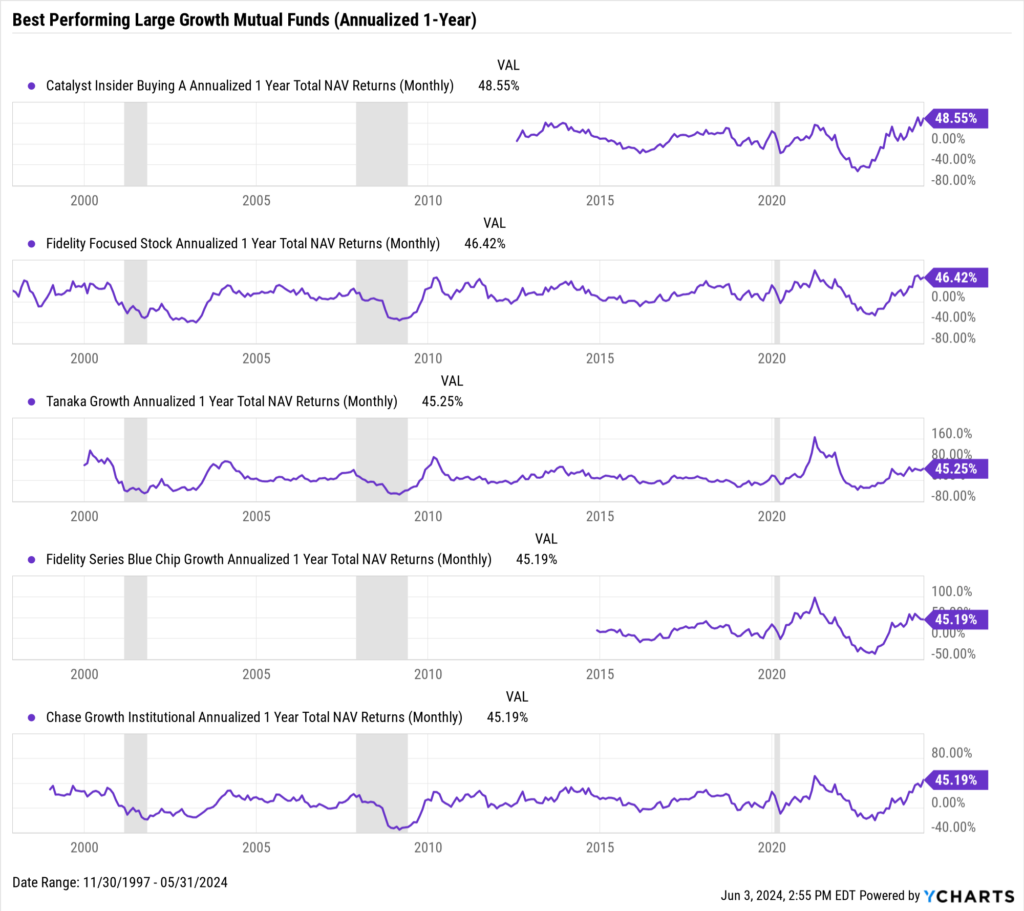
Download Visual | Modify in YCharts
Fidelity Focused Stock (FTQGX), Tanaka Growth (TGFRX), Fidelity Blue Chip Growth (FSBDX), and Chase Growth Institutional (CHAIX) rounded out the top five. View the complete list here.
Of the 33 publicly traded equities held by INSAX, 15, including Hims & Hers Health Inc (HIMS), Ensign Group Inc (ENSG), and Warrior Met Coal Inc (HCC), were not held by Vanguard Growth Index Admiral (VIGAX) as of December 31, 2023.

Best Performing Large Growth Mutual Fund on an Annualized 5-Year Basis
As of May 31, 2024, Fidelity Series Growth Company (FCGSX) was the best-performing large growth mutual fund on an annualized 5-year basis. Since the strategy’s inception (November 7, 2013), it has produced 24.8% annualized 5-year NAV returns.
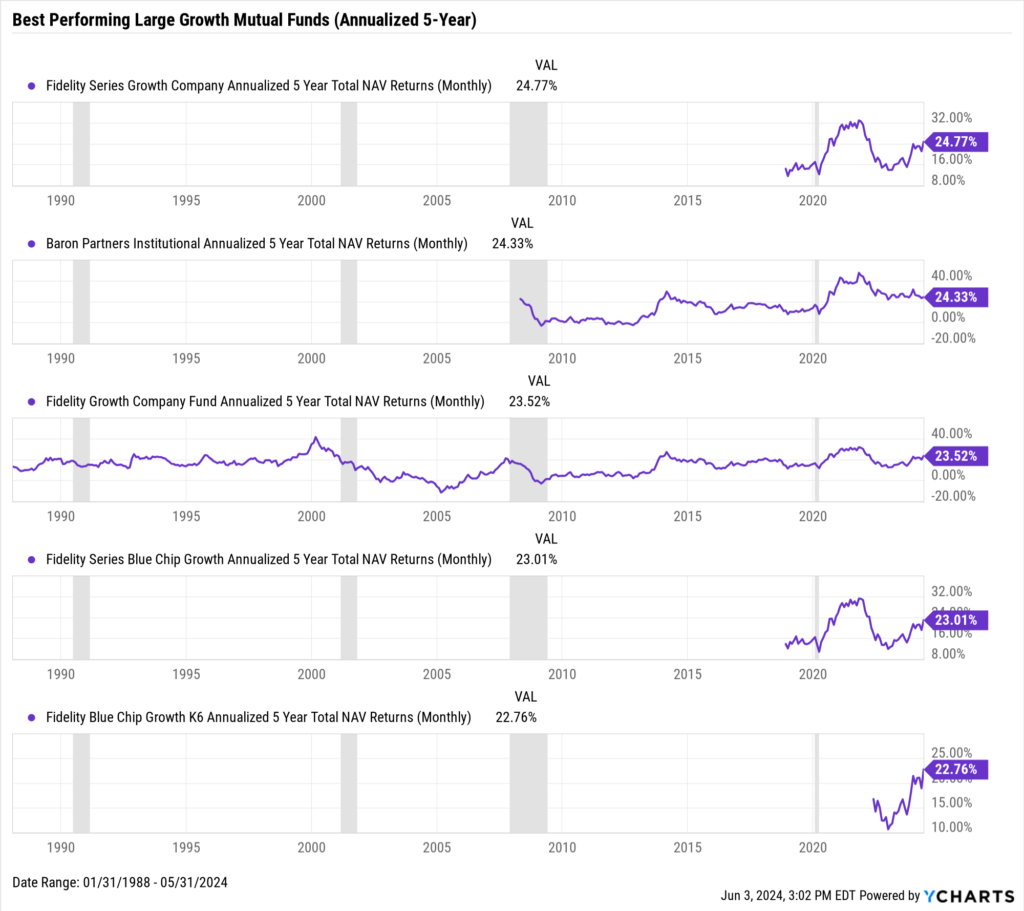
Download Visual | Modify in YCharts
Baron Partners Institutional (BPTIX), Fidelity Growth Company Fund (FDGRX), Fidelity Series Blue Chip Growth (FSBDX), and Fidelity Blue Chip Growth K6 (FBCGX) rounded out the top five. View the complete list here.
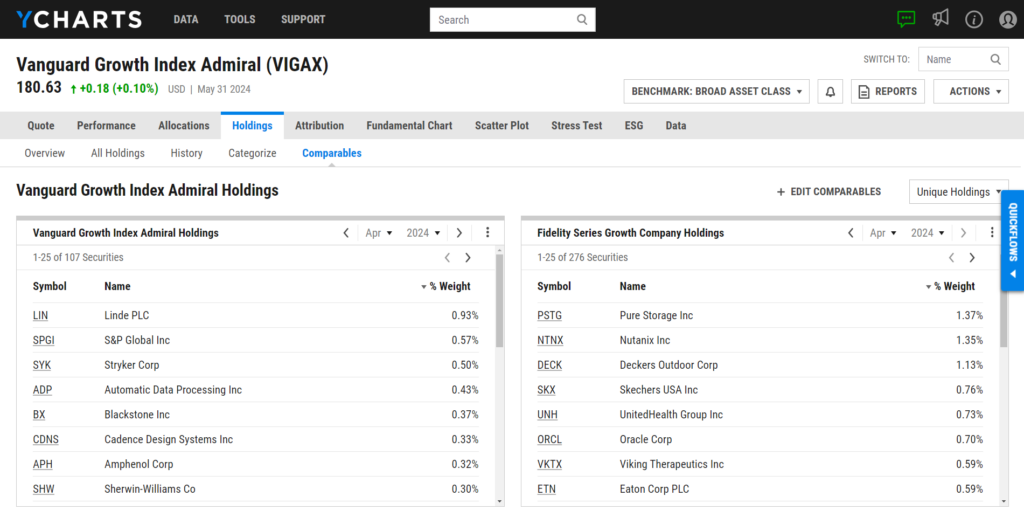
Of the 567 publicly traded equities held by FCGSX, 276, including Pure Storage Inc (PSTG), Nutanix Inc (NTNX), and Deckers Outdoor Corp (DECK), were not held by Vanguard Growth Index Admiral (VIGAX) as of April 30, 2024.
Best Performing Large Growth Mutual Fund on an Annualized 10-Year Basis
As of May 31, 2024, Fidelity Series Growth Company (FCGSX) was the best-performing large growth mutual fund on an annualized 10-year basis. Since the strategy’s inception (November 7, 2013), it has produced 19.3% annualized 10-year NAV returns.
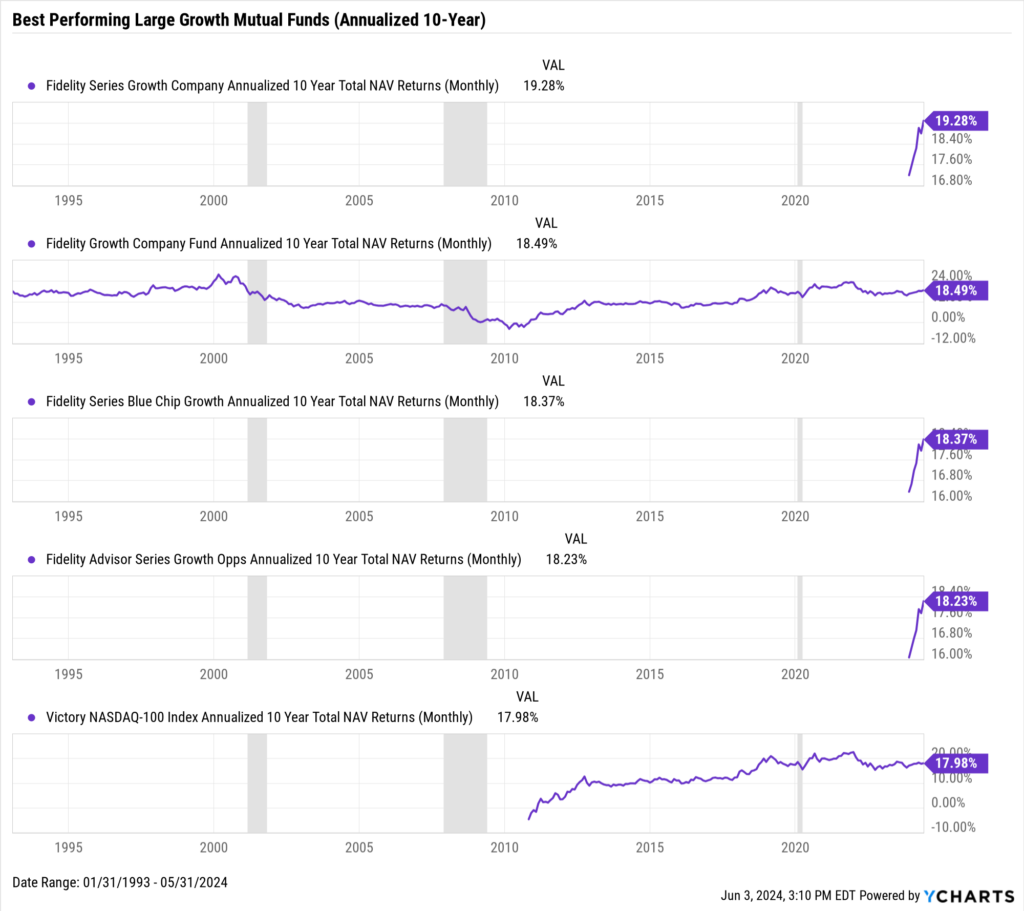
Download Visual | Modify in YCharts
Fidelity Growth Company Fund (FDGRX), Fidelity Series Blue Chip Growth (FSBDX), Fidelity Advisor Series Growth Opportunities Fund (FAOFX), and Victory NASDAQ-100 Index (USNQX) rounded out the top five. View the complete list here.
Large Value Mutual Fund Performance
Best Performing Large Value Mutual Fund on an Annualized 1-Year Basis
As of May 31, 2024, Upright Growth & Income (UPDDX) was the best-performing large value mutual fund on an annualized 1-year basis. Since the strategy’s inception (October 10, 2017), it has produced 47.9% annualized 1-year NAV returns.
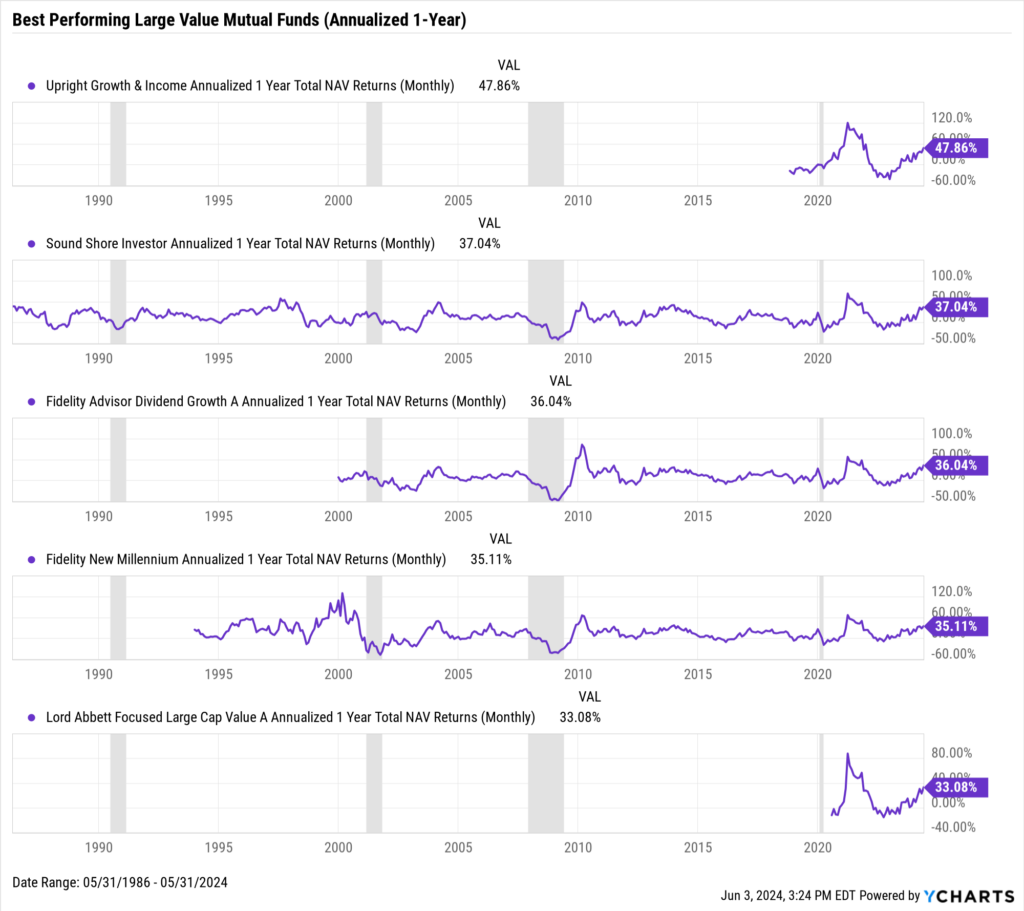
Download Visual | Modify in YCharts
Sound Shore Investor (SSHFX), Fidelity Advisor Dividend Growth A (FADAX), Fidelity New Millennium (FMILX), and Lord Abbett Focused Large Cap Value A (LAFLX) rounded out the top five. View the complete list here.
Of the 38 publicly traded securities held by UPDDX, 27, including Himax Technologies Inc (HIMX), NVIDIA Corp (NVDA), and Taiwan Semiconductor Manufacturing Co Ltd (TSM), were not held by Vanguard Value Index Adm (VVIAX) as of December 31, 2023.

Best Performing Large Value Mutual Fund on an Annualized 5-Year Basis
As of May 31, 2024, Upright Growth & Income (UPDDX) was the best-performing large value mutual fund on an annualized 5-year basis. Since the strategy’s inception (October 10, 2017), it has produced 19.1% annualized 5-year NAV returns.
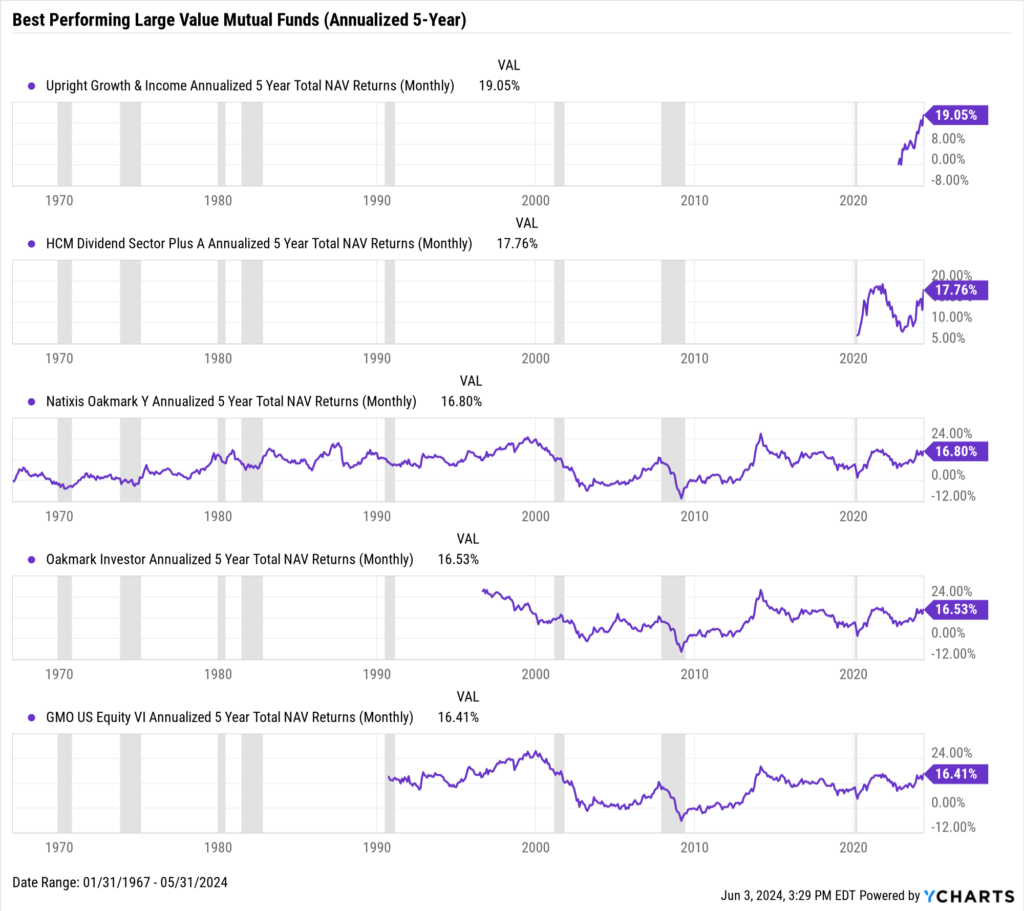
Download Visual | Modify in YCharts
HCM Dividend Sector Plus A (HCMNX), Natixis Oakmark Y (NEOYX), Oakmark Investor (OAKMX), and GMO US Equity VI (GMCQX) rounded out the top five. View the complete list here.
Best Performing Large Value Mutual Fund on an Annualized 10-Year Basis
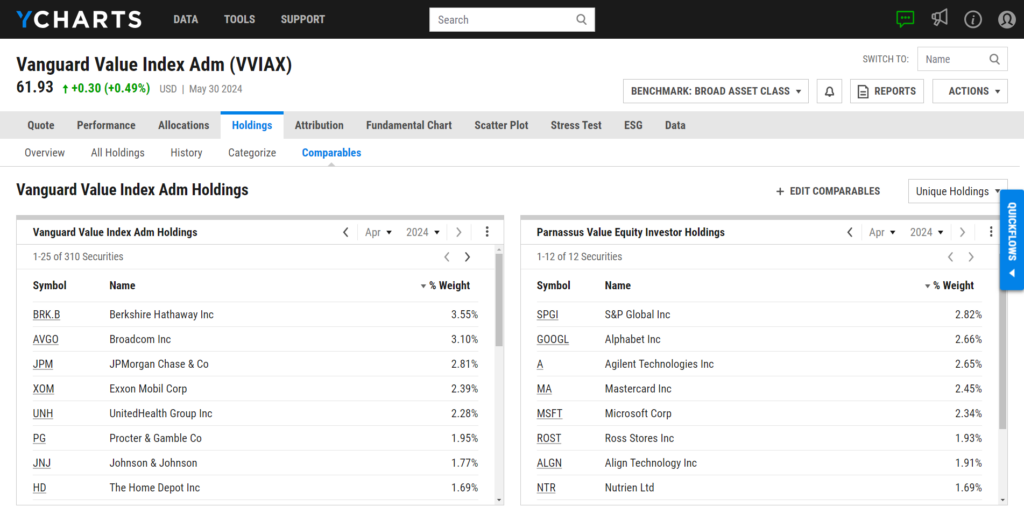
As of May 31, 2024, Parnassus Value Equity Investor (PARWX) was the best-performing large value mutual fund on an annualized 10-year basis. Since the strategy’s inception (April 29, 2005), it has produced 12.8% annualized 10-year NAV returns.
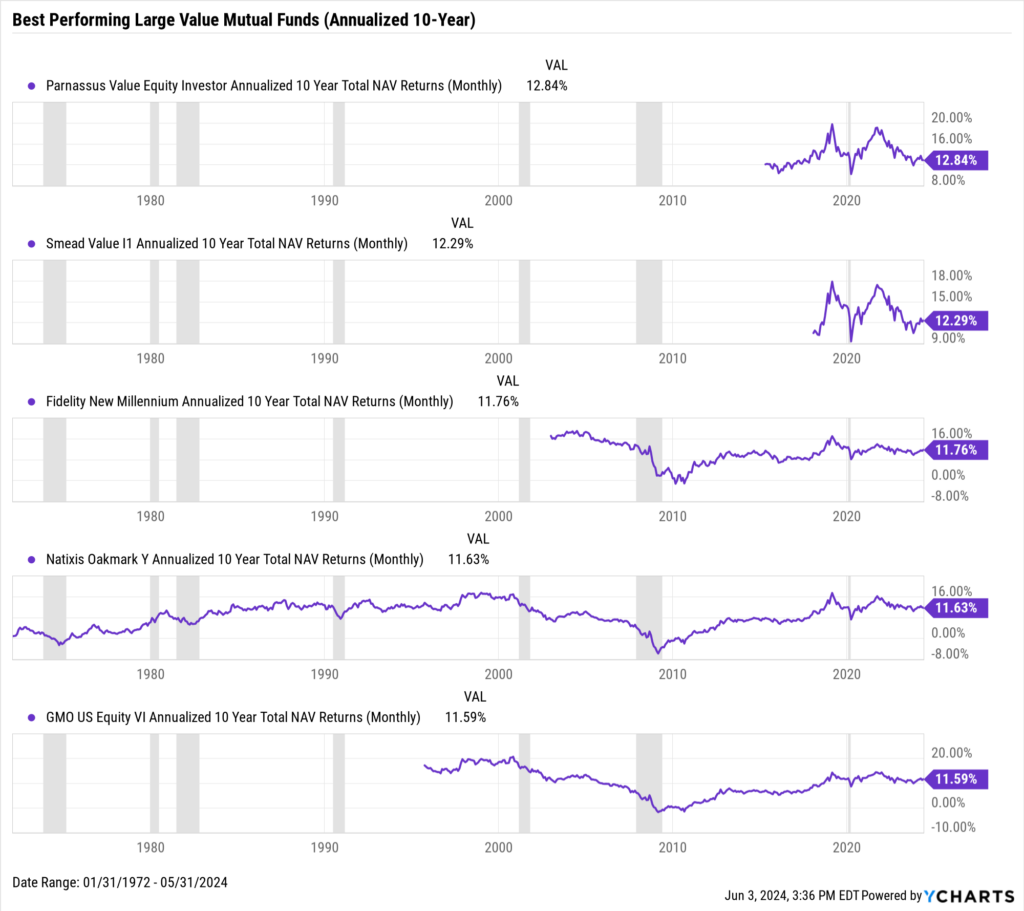
Download Visual | Modify in YCharts
Smead Value I1 (SVFFX), Fidelity New Millennium (FMILX), Natixis Oakmark Y (NEOYX), and GMO US Equity VI (GMCQX) rounded out the top five. View the full list here.
Of the 45 publicly traded equities held by PARWX, 12, including S&P Global Inc (SPGI), Alphabet Inc (GOOGL), and Agilent Technologies Inc (A), were not held by Vanguard Value Index Adm (VVIAX) as of April 30, 2024.

Using YCharts to Compare and Present Mutual Funds to Advisors
Over the last century, mutual funds have been pivotal in shaping the investment landscape, and asset managers have continually adapted their strategies to maximize AUM growth. YCharts represents a pivotal advancement in this ongoing evolution, offering powerful tools for asset managers to grow their AUM.
Before a meeting with financial advisors, asset managers can use a Comp Table or Fund Screener to understand their funds’ quantitative strengths and vulnerabilities. This can help better address potential advisor concerns and highlight competitive advantages.
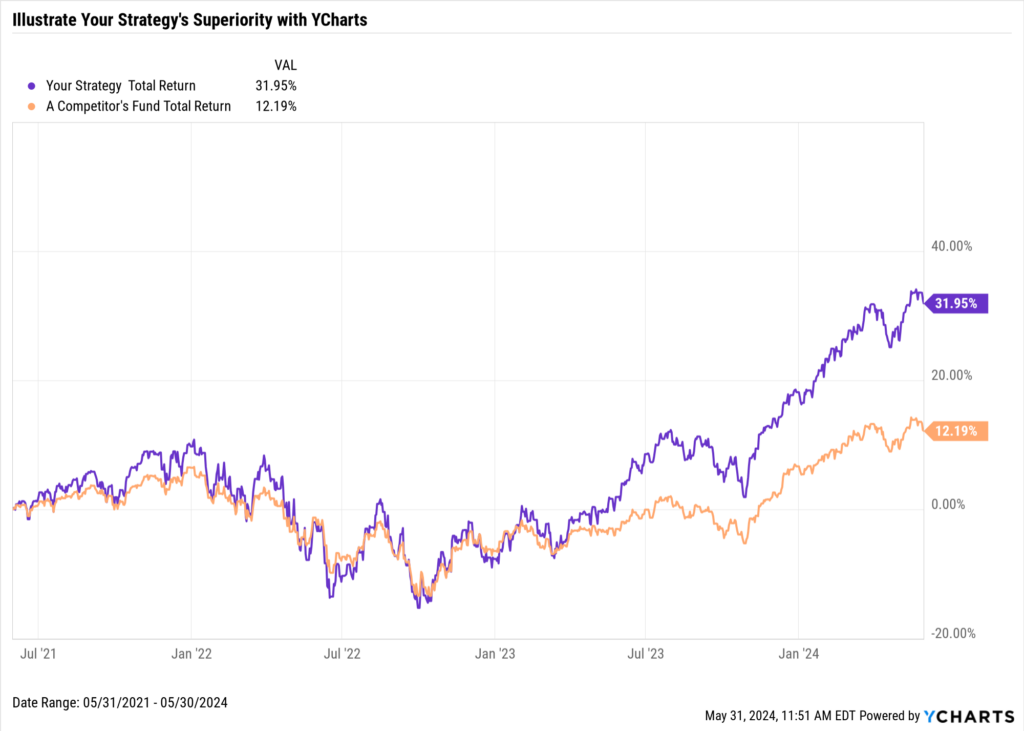
During discussions, wholesalers can employ Fundamental Charts in YCharts to visually demonstrate the superiority of their strategies over competitors.
Connect with an Asset Management Specialist
After personalizing visuals for one advisor, you can save and add them to your Dashboard. All visuals and Dashboards can be shared in YCharts so a regional director can create a centralized resource hub, ensuring consistency across all client interactions.
When dealing with advisors who already invest in similar funds, you can quickly toggle between the unique and common holdings of multiple mutual funds, ETFs, and Portfolios to differentiate your strategy in a crowded market.
Connect with an Asset Management Specialist
By incorporating an advisor’s holdings into Portfolios, asset managers can illustrate how their strategies enhance client portfolios. Whether it’s improving performance, enhancing risk mitigation, or lowering volatility, YCharts provides the tools to articulate, visualize, and quantify the specific benefits of your strategy tailored to the advisor’s client needs.
Whenever you’re ready, there are three ways YCharts can help you:
Have questions about leveraging YCharts to grow AUM in your Mutual Fund or ETF?
Email us at hello@ycharts.com or call (866) 965-7552. You’ll get a response from one of our Chicago-based team members.
Try out creating your own Visuals.
Dive into YCharts with a no-obligation 7-Day Free Trial now.
Talk to a member of our Asset Management team to see how YCharts can assist you in growing your business:
Disclaimer
©2024 YCharts, Inc. All Rights Reserved. YCharts, Inc. (“YCharts”) is not registered with the U.S. Securities and Exchange Commission (or with the securities regulatory authority or body of any state or any other jurisdiction) as an investment adviser, broker-dealer or in any other capacity, and does not purport to provide investment advice or make investment recommendations. This report has been generated through application of the analytical tools and data provided through ycharts.com and is intended solely to assist you or your investment or other adviser(s) in conducting investment research. You should not construe this report as an offer to buy or sell, as a solicitation of an offer to buy or sell, or as a recommendation to buy, sell, hold or trade, any security or other financial instrument. For further information regarding your use of this report, please go to: ycharts.com/about/disclosure
Next Article
7 Best Asset Classes to Hedge Against InflationRead More →