How to Use YCharts for Portfolio Management: Step-by-Step Guide

Introduction
Portfolio management is a cornerstone of financial advisory services, requiring a blend of strategic planning, market analysis, and effective client communication. YCharts offers a robust suite of tools designed to streamline portfolio management, helping advisors and wealth managers optimize their investment strategies and deliver exceptional client service. This step-by-step guide will walk you through the process of using YCharts for effective portfolio management, complete with screenshots and practical examples.
Step 1: Setting Up Your Portfolio
Importing Data
Begin by importing your existing portfolios into YCharts. You can upload holdings data or directly integrate with your existing CRM or brokerage systems. YCharts supports seamless integrations with platforms like Orion and Redtail, ensuring all your data is synchronized and up-to-date.
Example: A financial advisor working with multiple client portfolios can quickly import all relevant data into YCharts, eliminating manual data entry.
→ Learn more about YCharts Quick Extract which intelligently extracts data from both documents and images to create portfolios.
Portfolio Optimizer:
YCharts Portfolio Optimizer leverages advanced analytics and optimization techniques to give you a correlation analysis as well as an efficient frontier of different optimized portfolios. The optimizer allows you to use four different strategies including leveraging sharpe ratio, portfolio returns, and standard deviation as metrics to optimize by.
Step 2: Analyzing and Optimizing Portfolios
Portfolio Performance Analysis:
YCharts offers a comprehensive range of metrics that allow you to track and measure portfolio performance over time. Use the platform’s Timeseries Analysis to compare portfolio returns against benchmarks like the S&P 500 or a customized blend of indices.
Example: An advisor can compare a client’s portfolio against its benchmark to identify any underperforming assets, providing insights into necessary adjustments.
Conducting Risk Management with Stress Testing:
Use YCharts’ risk analysis tools to assess the volatility and risk-adjusted returns of your portfolios. The platform’s Stress Test feature lets you compare portfolio performance under different market conditions, helping you understand how portfolios might react to various economic scenarios.
Example: An advisor might use stress testing to demonstrate to a client how their portfolio would perform in a bear market recessionary environment, highlighting the importance of diversification.
→ Learn more about Stress Tests for Wholesalers to Amplify AUM

Continuous Optimization with Portfolio Optimizer:
YCharts’ Portfolio Optimizer is a powerful tool that suggests optimal asset allocations to maximize returns based on a client’s risk tolerance. Adjust asset weights, explore efficient frontiers, and implement changes that align with your client’s investment goals.
Example: Using the optimizer, an advisor can rebalance a portfolio to enhance returns without significantly increasing risk, thereby improving the client’s long-term outcomes.
Step 3: Reporting and Client Communication
Generating Custom Reports:
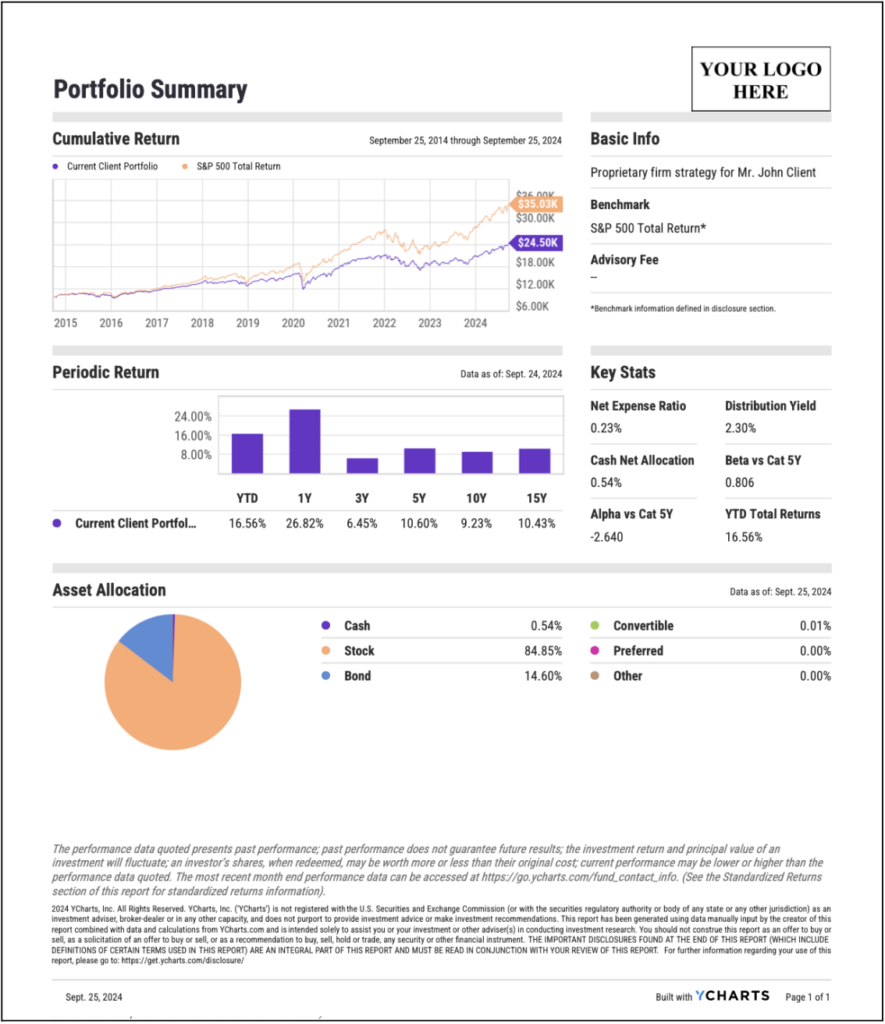
YCharts allows you to create custom reports that are both visually appealing and information-rich, with dozens of available modules including performance summaries, asset allocation graphs, and risk metrics. These reports can be branded with your firm’s logo and customized to meet the specific needs of each client.
Example: An advisor preparing for an annual review meeting can generate a comprehensive report that details the client’s portfolio performance, compares it to benchmarks, and provides actionable insights.

Download YCharts 2024 Client Communication Survey
Sharing Reports with Clients:
Once your reports are generated, you can easily share them with clients via email or through a client portal. YCharts also allows for the export of reports in PDF format, making it simple to distribute and store documentation.
Example: After a quarterly review, an advisor can email a client a detailed performance report, ensuring transparency and fostering trust in the advisor-client relationship.
Conclusion:
YCharts is an indispensable tool for financial professionals seeking to streamline their portfolio management processes. From setting up and analyzing portfolios to optimizing allocations and communicating with clients, YCharts provides all the tools necessary to manage portfolios effectively and efficiently. By following this guide, advisors can leverage YCharts to enhance their service offerings and deliver better outcomes for their clients.
Whenever you’re ready, there are 3 ways YCharts can help you:
1. Looking to better communicate the importance of economic events to clients?
Send us an email at hello@ycharts.com or call (866) 965-7552. You’ll be directly in touch with one of our Chicago-based team members.
2. Want to test out YCharts for free?
Start a no-risk 7-Day Free Trial.
3. Download a copy of the Quarterly Economic Update slide deck:
Download the Economic Summary Deck:Disclaimer
©2024 YCharts, Inc. All Rights Reserved. YCharts, Inc. (“YCharts”) is not registered with the U.S. Securities and Exchange Commission (or with the securities regulatory authority or body of any state or any other jurisdiction) as an investment adviser, broker-dealer or in any other capacity, and does not purport to provide investment advice or make investment recommendations. This report has been generated through application of the analytical tools and data provided through ycharts.com and is intended solely to assist you or your investment or other adviser(s) in conducting investment research. You should not construe this report as an offer to buy or sell, as a solicitation of an offer to buy or sell, or as a recommendation to buy, sell, hold or trade, any security or other financial instrument. For further information regarding your use of this report, please go to: ycharts.com/about/disclosure
Next Article
US ISM Manufacturing PMI Monthly UpdateRead More →
