New on YCharts: Portfolio Optimizer
Build the optimal allocation strategy to mitigate exposure to risk, maximize portfolio performance, and enhance data-driven decision-making for portfolio management using YCharts’ NEW Portfolio Optimizer. This powerful tool perfectly complements YCharts’ ever-popular Model Portfolios tool, offering an additional layer of analysis that focuses on risk and performance metrics to help streamline the development of the ideal asset allocation for your clients.
Whether you are refining an existing model strategy and then sharing with your team or preparing for an upcoming meeting, Portfolio Optimizer helps answer the question of WHY.
‣ For wealth management professionals engaging with clients, the optimizer offers a user-friendly format to communicate recommendations, allowing you to proactively address the expected benefits aligned with clients’ values and foster trust.
‣ For analysts and internal users, this tool facilitates a comprehensive understanding of why updating a model is essential, empowering them to present their findings to an investment committee confidently.
*Portfolio Optimizer is available to all YCharts Professional users.
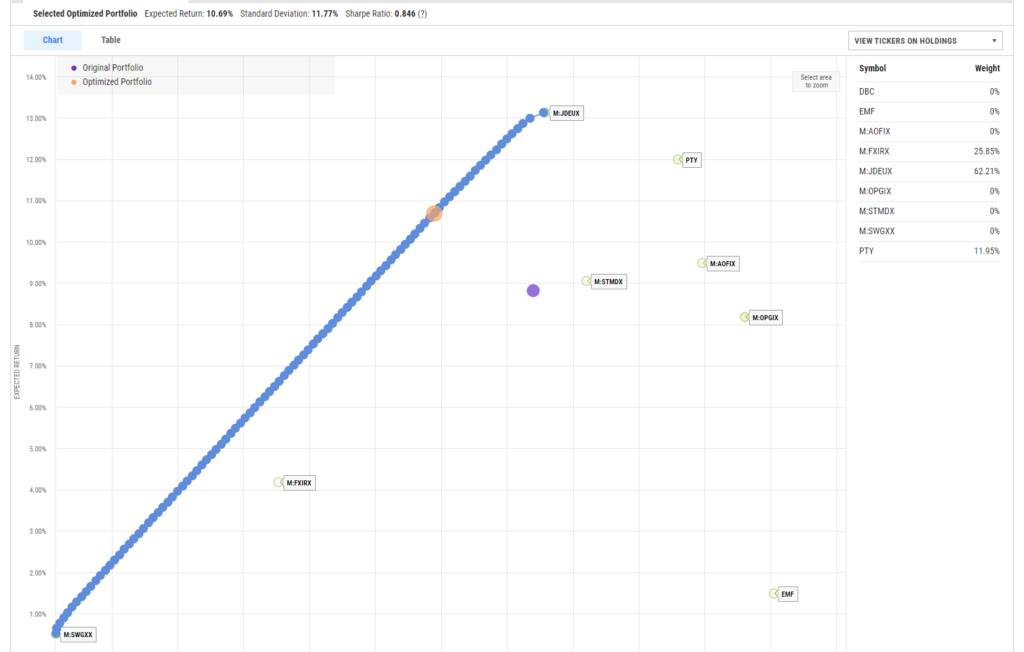
Utilize an efficient frontier to build the ideal strategy for your clients
Providing a tailored experience for each of your clients can oftentimes be cumbersome and time-consuming, but with YCharts’ Portfolio Optimizer, advisors will be able to develop an allocation strategy based on a client’s risk tolerance and long-term return goals in a matter of clicks. Select from four different strategies, including:
‣ Maximize Sharpe Ratio: This strategy aims to identify the portfolio allocation with the highest risk-adjusted return, also known as the tangency portfolio. The Sharpe ratio measures the return earned per unit of risk taken, allowing investors to find investments with the best risk-return tradeoff.
‣ Minimize Standard Deviation: This strategy aims to optimize the portfolio by minimizing its overall risk and reducing volatility to create a more stable and predictable portfolio.
‣ Target Return: This strategy aims to minimize your portfolio performance volatility for a user-defined target return.
‣ Target Standard Deviation: This strategy aims to maximize portfolio return for a user-defined target risk.
After running a strategy, advisors can analyze the optimized portfolio along an efficient frontier, enabling them to recommend the optimal security weights tailored to their client’s risk-reward preferences. While presenting a single option to clients can be sufficient in most cases, advisors can also provide real-time insights into additional allocation possibilities. This comprehensive approach ensures that clients receive a complete range of portfolio options. This offers clients choices and fosters more engaging discussions, positioning advisors as knowledgeable investment experts and enhancing their credibility as wealth management professionals.
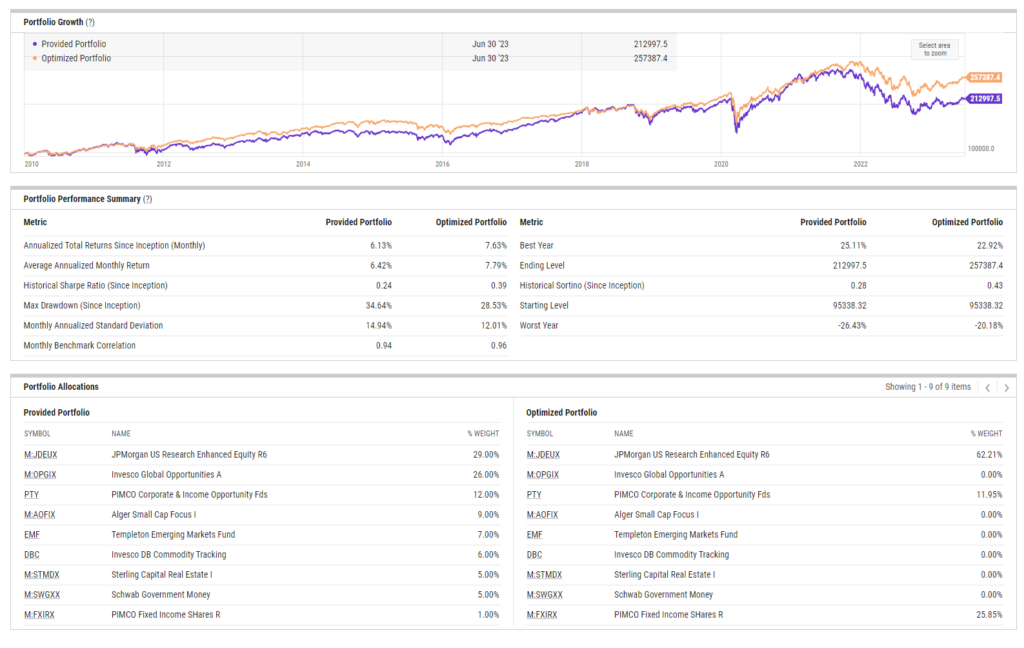
Illustrate the impact of an optimized portfolio
The Portfolio Optimizer offers a range of powerful features that enable comprehensive analysis and decision-making for portfolio management. Advisors can leverage a sandbox environment to test different strategies, gaining insights into the impacts on the portfolio during re-balancing. While the efficient frontier is a valuable tool for understanding these changes, the associated growth chart and metrics table allow for a direct comparison of portfolio performance before and after optimization and fundamental statistics, providing a clear overview of its potential.
Moreover, the optimizer dynamically adjusts based on the selected point on the efficient frontier, allowing for customized analysis and exploration of various risk-reward trade-offs. This flexibility is particularly useful for testing internal models and identifying necessary adjustments to achieve desired risk-return targets.
The tool’s compelling visuals make it suitable for both internal meetings, where it can effectively communicate key insights, and client/prospect-facing meetings, where its user-friendly interface ensures easy understanding.
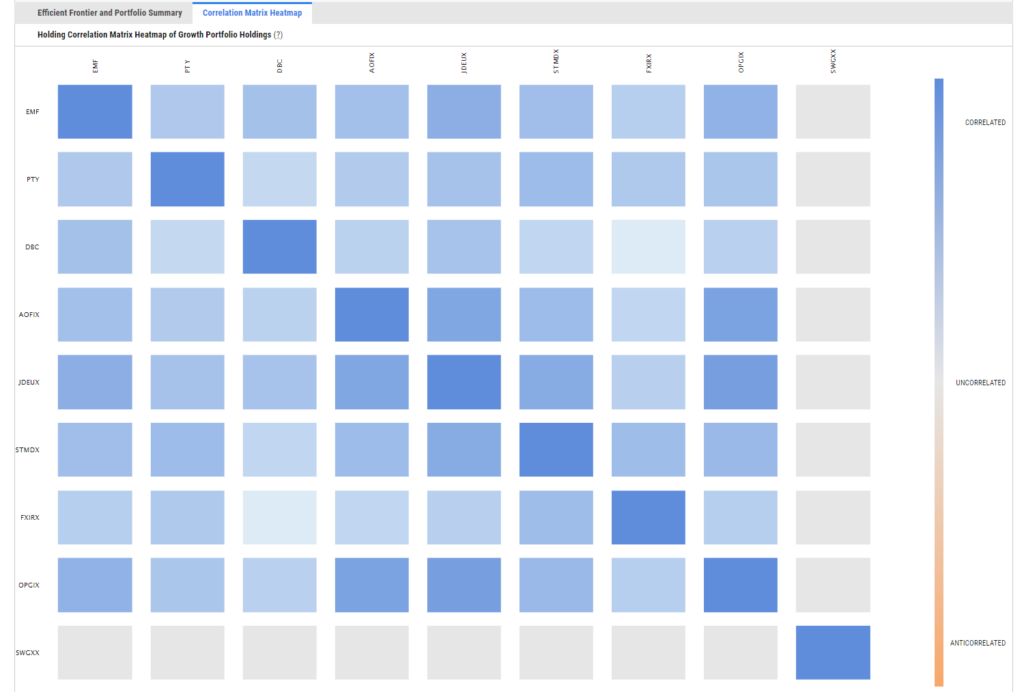
Leverage the Correlation Matrix for a more diversified, balanced portfolio
The Correlation Matrix provides insights into the interconnections between holdings, helping you identify potential areas of overlap or concentration. Armed with this information, you can make informed decisions to maintain a well-balanced and diversified portfolio, aligning with your client’s investment objectives and risk tolerance.
A valuable analytical tool, the Correlation Matrix uses correlation coefficients ranging from -1.0 to 1.0. A correlation coefficient of 1.0 indicates a perfect positive linear relationship between two holdings, while -1.0 signifies a perfect negative linear relationship. On the other hand, a correlation coefficient of zero suggests no linear relationship between the portfolio holdings. By utilizing the Correlation Matrix, you can assess the degree of performance similarity among securities and make informed decisions to maintain a diversified portfolio.
Streamline model creation & meeting prep
With the Portfolio Optimizer’s fully integrated functionality, advisors can efficiently streamline weight exports directly into YCharts’ Model Portfolios tool, saving time and enabling them to allocate their efforts towards meeting prep and other initiatives. Once models are updated, users can now share previously performed portfolio optimizations, enabling collaboration across teams. As with other YCharts tools, users can control access by designating permissions for team members to view or edit the shared optimizations.
From effectively managing their portfolios, generating impactful proposals, and leveraging visual analysis tools, this new addition to the platform reinforces YCharts’ commitment to being the all-in-one solution for wealth management professionals.
Look out for future enhancements to this new tool, including PDF report modules for the Correlation Matrix and Efficient Frontier within Report Builder, along with fully integrated Model Portfolio quote pages.
Connect with YCharts
To get in touch, contact YCharts via email at hello@ycharts.com or by phone at (866) 965-7552
Interested in adding YCharts to your technology stack? Sign up for a 7-Day Free Trial.
Disclaimer
©2023 YCharts, Inc. All Rights Reserved. YCharts, Inc. (“YCharts”) is not registered with the U.S. Securities and Exchange Commission (or with the securities regulatory authority or body of any state or any other jurisdiction) as an investment adviser, broker-dealer, or in any other capacity, and does not purport to provide investment advice or make investment recommendations. This report has been generated through application of the analytical tools and data provided through ycharts.com and is intended solely to assist you or your investment or other adviser(s) in conducting investment research. You should not construe this report as an offer to buy or sell, as a solicitation of an offer to buy or sell, or as a recommendation to buy, sell, hold or trade, any security or other financial instrument. For further information regarding your use of this report, please go to: ycharts.com/about/disclosure
Next Article
Winners & Losers from the Dot Com Bubble Rate Hike CycleRead More →