The Top Metrics Advisors Used in Portfolio Reports Last Year

Many advisors are conducting those all-important client portfolio reviews around this time of year.
Whether it’s reviewing portfolio performance, adjusting financial plans based on recent life changes, or simply catching up with valued clients, these meetings serve as critical touchpoints between advisors and clients.
To arm advisors with useful information and agenda items for portfolio review meetings, YCharts just published a brief guide to the top metrics that advisors used in portfolio reports last year. This guide contains the ten most popular financial metrics leveraged by advisors across all YCharts-generated reports last year.
This post will highlight the top ten Talking Points favored among users of YCharts’ reporting tools last year, provide example talk tracks for advisors to use in client conversations, and show how to generate client reports in just minutes with YCharts.
Download The Top Metrics Advisors Used in Portfolio Reports: 2024 here.
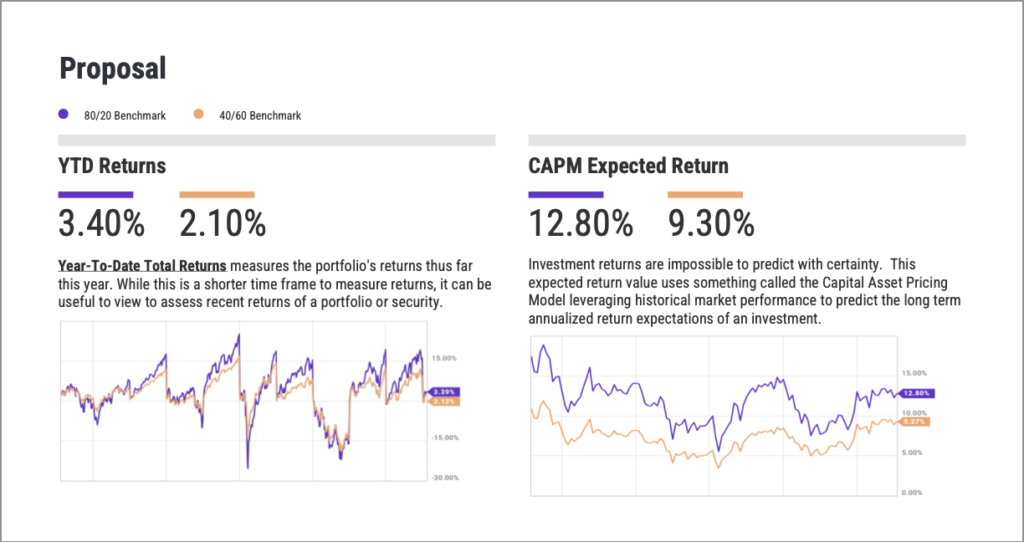
10. YTD Total Return
The Total Return is the change in price over a specific period of time, including dividends and distributions paid but less the expense ratio.
Previous year YTD Total Return will undoubtedly be an important metric to talk about when conducting annual portfolio reviews with clients; this metric will show how much their nest egg grew or contracted by over the last year, and current year YTD Total Return will give an idea the direction in which their portfolio has started the year off.
To get an exclusive look at 2024 total returns, advisors can use the 1Y Total Return (annual) metric.
9. CAPM Expected Return
The Capital Asset Pricing Model (CAPM) is a measure of the relationship between risk and the expected return of a security. The idea is that an investor should be compensated by the amount of risk they take on, in addition to the expected market return.
Investment returns are impossible to predict with certainty. But the CAPM leverages historical market performance to help predict the long term annualized return expectations of an investment – and give clients an idea of how they can expect their investments to perform.
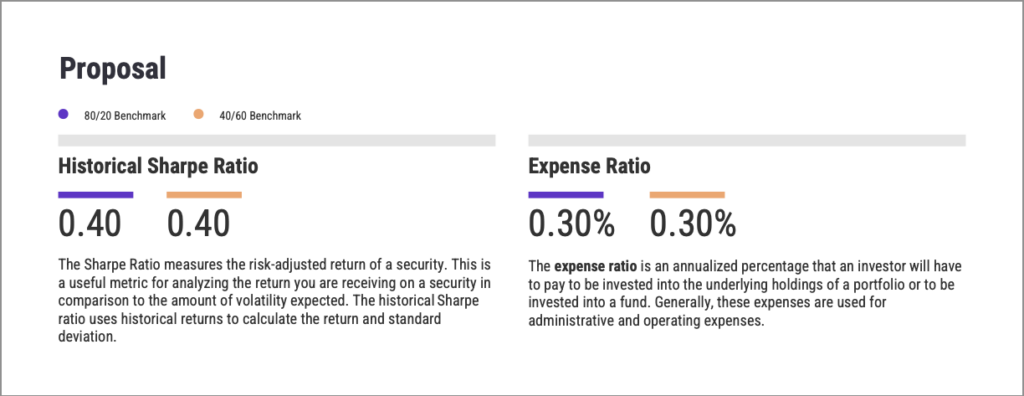
8. Historical Sharpe Ratio
The Sharpe ratio measures the risk-adjusted return of a security. This is a useful metric for analyzing the return received on a security in comparison to the amount of volatility expected. The historical Sharpe ratio uses historical returns to calculate the return and standard deviation.
Though not necessarily the most top-of-mind metric for clients, they might have an interest in what it represents: how efficiently their portfolio generates returns relative to risk.
7. Expense Ratio
The Expense ratio represents the cost of owning a fund.
Expense ratio expresses the percent of assets deducted each fiscal year to cover various fund expenses, including 12b-1 fees, management and administrative charges, operational expenditures, and all other costs tied to managing and operating a fund. The gross expense ratio is a measure of a fund’s total expenses before any adjustments, while the net expense ratio accounts for any fee waivers or other rebates.
Clients care about how much they are paying for their investments and how fees impact their returns. High expenses eat into returns over time; advisors aim to optimize net performance by selecting cost-effective investment options and can show clients how they are proactively minimizing the impact of fees using YCharts reports.
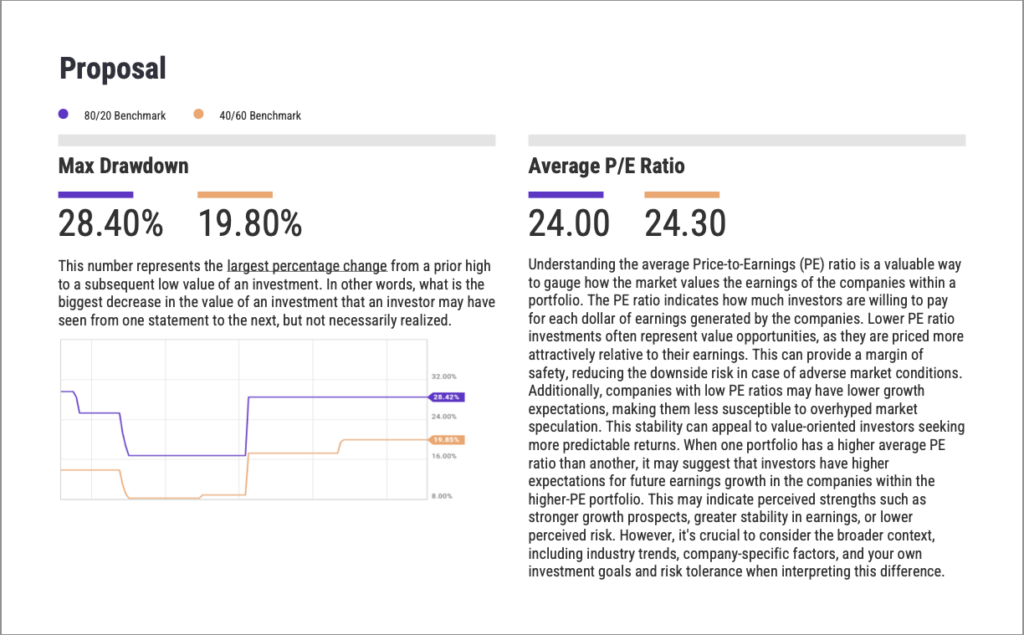
6. Max Drawdown
Max Drawdown is an indicator of the risk of a portfolio chosen based on a certain strategy. It measures the largest single drop from peak to bottom in the value of a portfolio before a new peak is achieved.
For example, if a portfolio starts being worth $100,000, increases in value to $150,000, decreases to $90,000, increases to $120,000, then decreases to $80,000, then increases back to $100,000, the max drawdown is ($150,000-$80,000)/$150,000 = 46.67%.
If a portfolio has a history of large drawdowns, an advisor may need to educate clients on the strategy or adjust holdings to prevent dissatisfaction during market downturns. Max drawdown reflects the worst-case historical loss a client could have experienced, which directly impacts their financial well-being and emotional comfort.
YCharts offers stress testing to compare security and portfolio max drawdowns to a benchmark, great for visualizing the robustness of an advisor’s model strategies.
5. Average P/E Ratio
The price-to-earnings ratio (PE Ratio) is the measure of the share price relative to the annual net income earned by the firm per share. The PE ratio shows current investor demand for a company share. A high PE ratio generally indicates increased demand because investors anticipate earnings growth in the future. The PE ratio has units of years, which can be interpreted as the number of years of earnings to pay back purchase price.
The PE ratio is often referred to as the “multiple” because it demonstrates how much an investor is willing to pay for one dollar of earnings. One talk track for client meetings could be for advisors to show how they are ensuring that clients are paying reasonable prices for the underlying holdings of their portfolio.
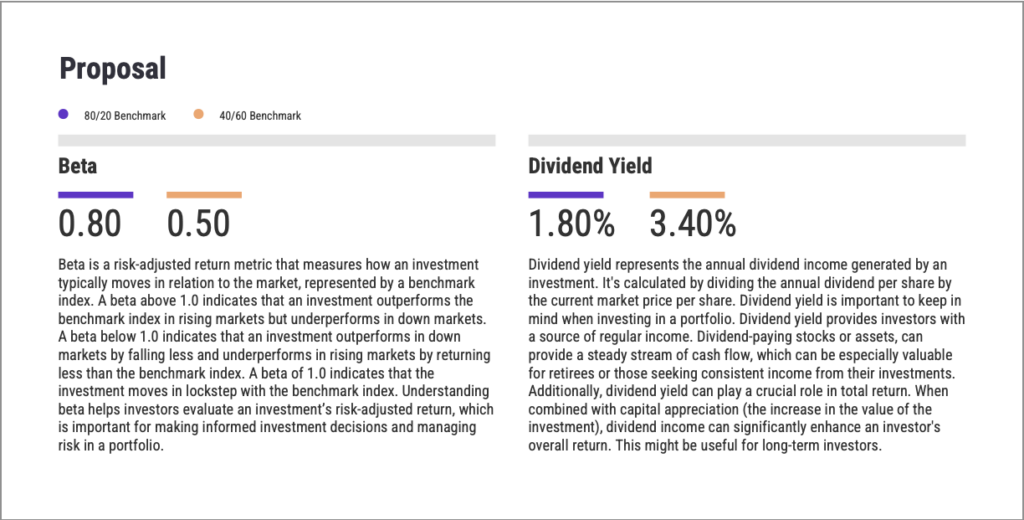
4. Beta
Beta is a measure of the risk of a stock when it is included in a well-diversified portfolio.
When Beta is positive, the stock price tends to move in the same direction as the market, and the magnitude of Beta tells by how much. If a stock’s Beta is greater than 1, that means that when the market index goes up 1%, the stock would be expected to go up by more than 1%. On the contrary, if the market goes down by 1%, the stock would be expected to go down by more than 1%. Negative betas signify a negative correlation. When the market goes up, a stock with a negative beta would be expected to go down.
Beta is a useful metric for advisors as it measures a portfolio’s sensitivity to market movements, helping with risk assessment and asset allocation. It also helps clients understand how much risk they are taking on and the level of the highs and lows to expect during market swings.
3. Dividend Yield
Dividend yield is a financial metric that measures the income from dividends relative to the value of an investment. It shows how much a company, fund, or portfolio has paid out in dividends each year relative to its price, net asset value (NAV), or level (for portfolios). Expressed as a percentage, it helps investors understand the return they can expect from dividends alone, without considering any changes in the price, NAV, or level. For example, if a stock trades at $36 and pays $1.80 in dividends over the course of one year ($0.45 per quarter), the company’s dividend yield is 5%.
Companies that pay dividends tend to have consistent positive net income, and companies with higher dividend yields often have business models that allow them to pay out more dividends from net income–for example, real estate and consumer defensive stocks. Dividend yield is an important pillar of long-term financial planning because it impacts income generation, portfolio stability, and total return potential for a client.
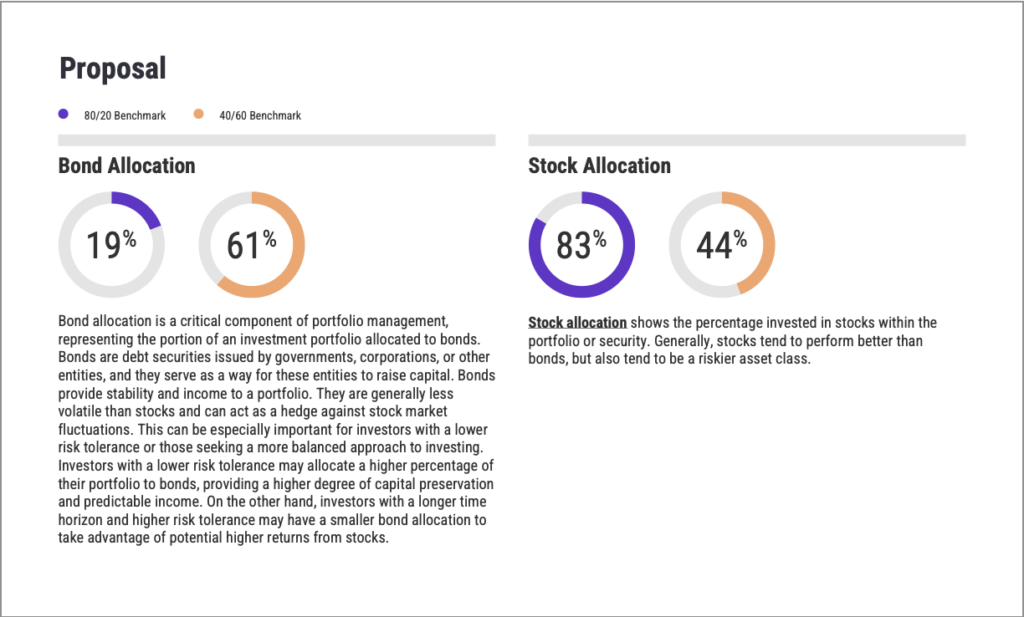
2. Bond Allocation
The amount of a fund or portfolio weighted towards fixed income positions. This figure would tend to be smaller earlier on in an investor’s time horizon, and increases with time as it becomes viewed as a less risky option.
1. Stock Allocation
The amount of a fund or portfolio weighted towards equity positions. This figure would tend to be larger earlier on in an investor’s time horizon, and decreases with time.
Whenever you’re ready, there are 3 ways YCharts can help you:
1. Looking for a best-in-class data & visualization tool?
Send us an email at hello@ycharts.com or call (866) 965-7552. You’ll be directly in touch with one of our Chicago-based team members.
2. Want to test out YCharts for free?
Start a no-risk 7-Day Free Trial.
3. Get your copy of The Top Metrics Advisors Used in Portfolio Reports: 2024
Disclaimer
©2025 YCharts, Inc. All Rights Reserved. YCharts, Inc. (“YCharts”) is not registered with the U.S. Securities and Exchange Commission (or with the securities regulatory authority or body of any state or any other jurisdiction) as an investment adviser, broker-dealer or in any other capacity, and does not purport to provide investment advice or make investment recommendations. This report has been generated through application of the analytical tools and data provided through ycharts.com and is intended solely to assist you or your investment or other adviser(s) in conducting investment research. You should not construe this report as an offer to buy or sell, as a solicitation of an offer to buy or sell, or as a recommendation to buy, sell, hold or trade, any security or other financial instrument. For further information regarding your use of this report, please go to: ycharts.com/about/disclosure
Next Article
Treasury Yields Edge Higher Amid Inflation Data and Tariff ConcernsRead More →