What Happened to the Magnificent Seven Stocks?
The Magnificent Seven stocks–Alphabet, Apple, Amazon, Microsoft, Meta Platforms, NVIDIA, and Tesla–have carried U.S. indices higher. Between 2023 and 2024, these seven names rose 156.1% as a collective, compared to 25.16% for the remaining 493 names and 57.88% for the S&P 500 index overall.
However, this cohort has fallen from grace to start the year, tumbling as much as 14.23% in 2025 and dragging the S&P 500 lower.
So…what exactly happened to the Magnificent Seven?
This post will explore performance differences between the Magnificent Seven and the rest of the S&P 500 index, examine how index concentration has fluctuated over the last two years, and provide ways to mitigate the effects of concentrated holdings.
What Have the Magnificent Seven Stocks Done This Year?
Despite recent struggles by the Magnificent Seven, the S&P 500 was up 1.44% through the first two months of the year. The remaining 493 constituents – the “S&P 493” – advanced 5.12% as a collective in the same time frame, helping keep the index afloat amid the S&P 7’s 5.7% decline.
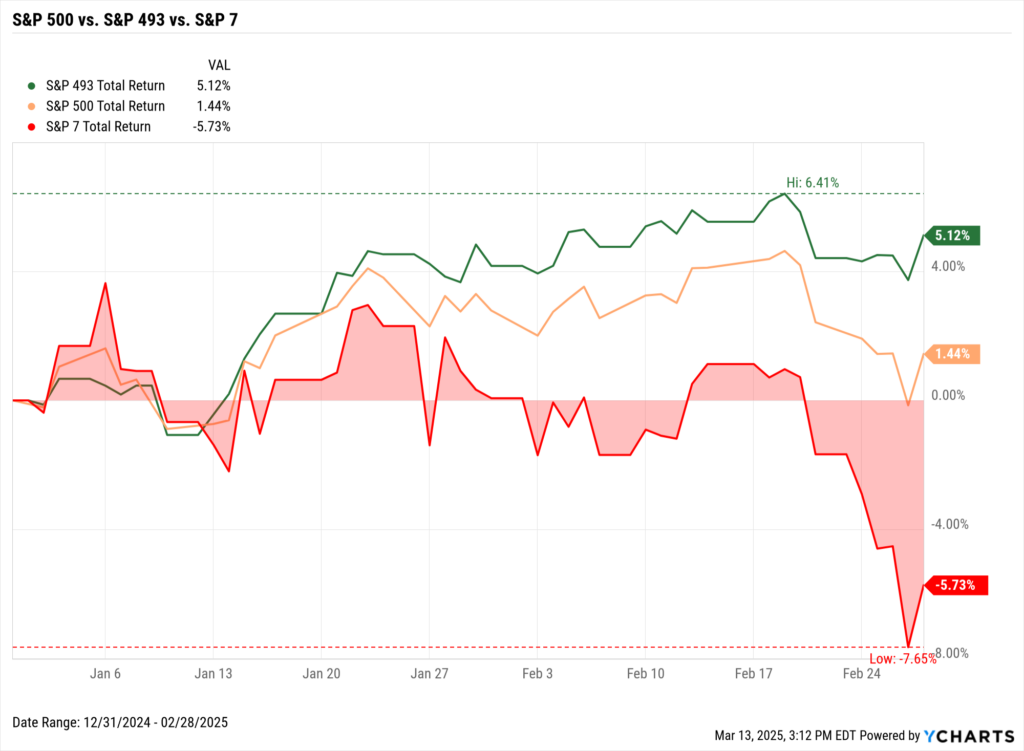
Download Visual | Modify in YCharts
However, the last two weeks have seen broader markets take a turn for the worst. As of March 15th, the S&P 493 has given up virtually all of its 2025 gains and the Magnificent Seven has more than doubled its YTD losses, pushing the S&P 500 down 3.85%. Still, the S&P 493 is barely positive so far in 2025.
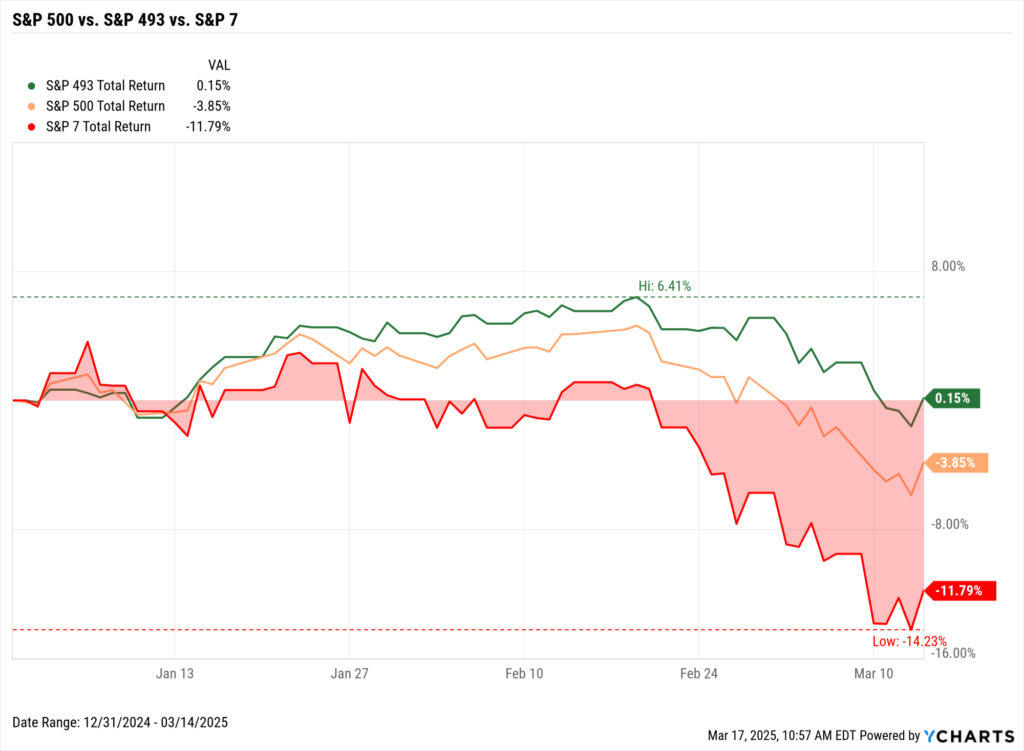
Download Visual | Modify in YCharts
Performance of Individual Magnificent Seven Constituents
Two and a half months into 2025, six of the seven Magnificent Seven stocks are down between 7 and 15 percent. The worst performer is Tesla, which has plummeted 38.1%, while Meta Platforms is the only positive constituent during the same time frame.
Magnificent Seven stock returns YTD through March 14th, 2025:
- Meta Platforms (META): 3.77%
- Microsoft (MSFT): -7.81%
- NVIDIA (NVDA): -9.40%
- Amazon.com (AMZN): -9.77%
- Alphabet (GOOG, GOOGL): -11.98%
- Apple (AAPL): -14.75%
- Tesla (TSLA): -38.10%
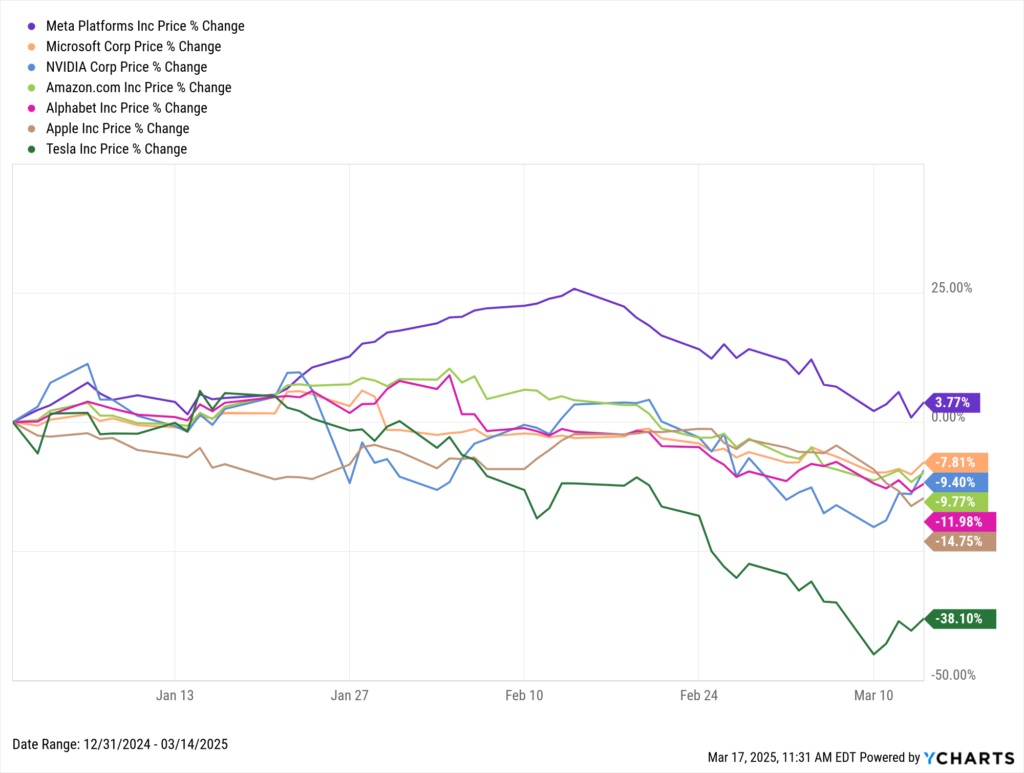
Download Visual | Modify in YCharts
Market capitalizations have also tumbled; Tesla has slipped below $1T, while Microsoft and NVIDIA have both fallen below $3T. Amazon and Alphabet now hover just above the $2T mark after punching above $2.5T earlier in the year.
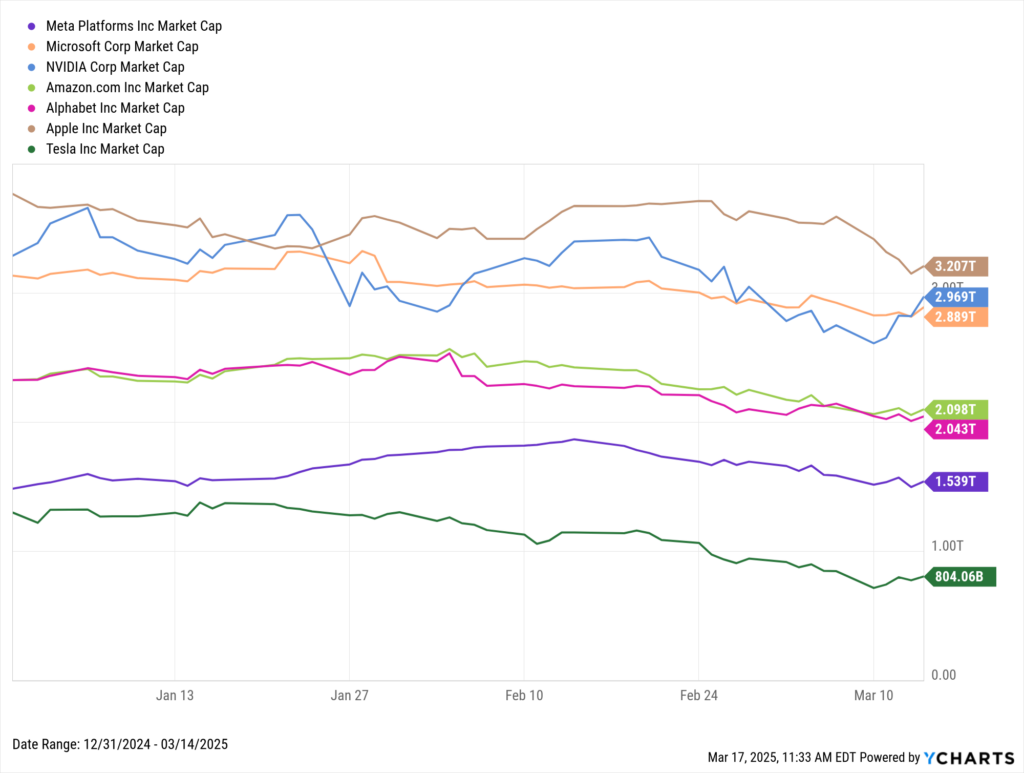
Download Visual | Modify in YCharts
How Have the Magnificent Seven Stocks Performed in Years Past?
The current state of the Magnificent Seven stocks is in stark contrast to the past couple of years, when this small cohort carried the index to one new all-time high after another. In the two years between 2023 and 2024, the S&P 7 outperformed the S&P 493 by sixfold.
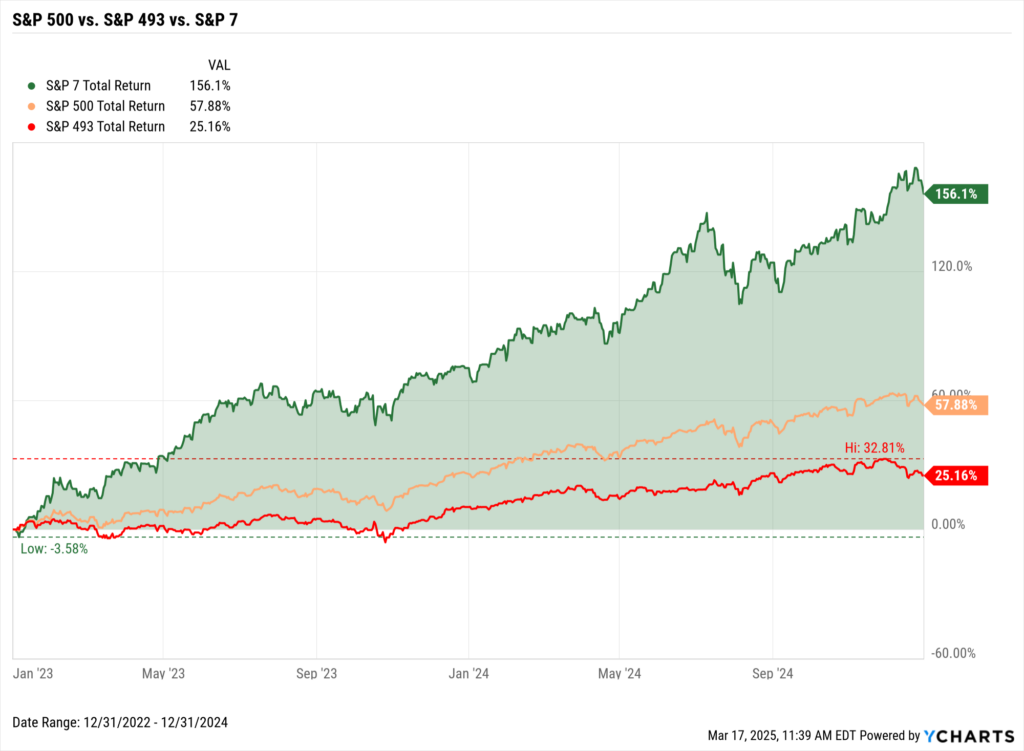
Download Visual | Modify in YCharts
Index Top 10 Holdings Over Time
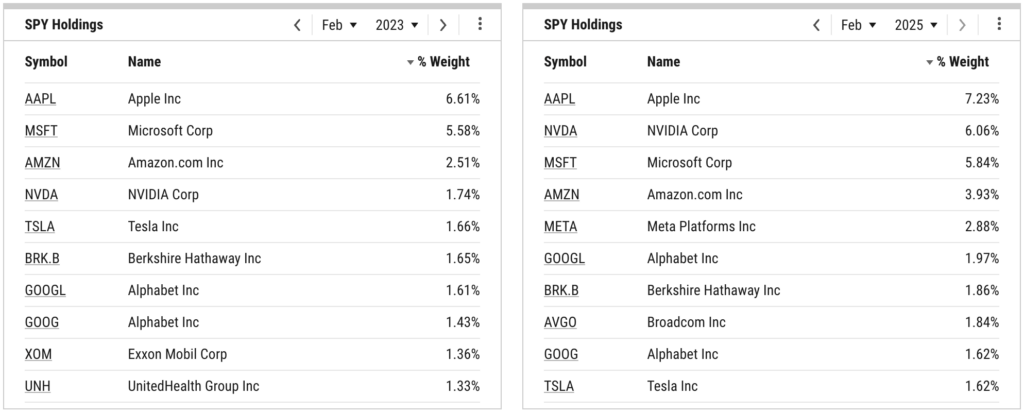
Index concentration has ballooned significantly over the past two years due to the rise of mega-cap stocks. Represented by SPY, the top 10 holdings comprised 25.43% of the S&P 500 in February 2023.
Fast forward two years, and that figure has grown to 34.85%.
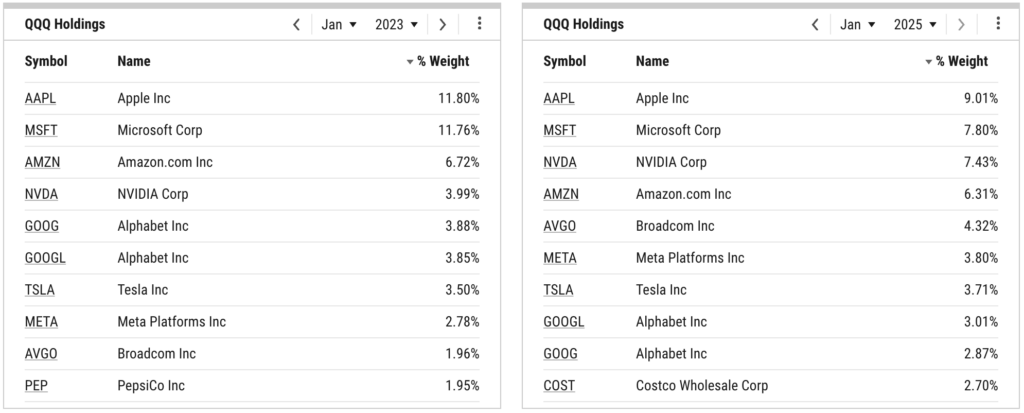
The Nasdaq-100 index has a higher concentration percentage among its top 10 holdings, but that level has declined from 52.19% in January 2023 to 50.96% as of January 2025. Still, over half of the index is concentrated in ten names.
How to Combat the Effects of Index Concentration
One of the ways to combat portfolio drift is by increasing rebalancing frequency so a portfolio returns to its target weights more often, though this will require additional time and an increasing number of buy/sell transactions which can result in capital gains taxes.
In YCharts, you can leverage the Fund Screener to identify equity funds where the top ten holdings collectively make up less than a certain percentage of the fund’s total weight–such as, less than 34.85% in this fund screen.
For advisors with clients who want or need to make a portfolio switch, the Transition Tax Analysis tool seamlessly identifies and generates a PDF plan outlining the necessary trades, streamlining the transition process from a client’s current portfolio to their desired vehicle.
Another method is to utilize equal-weight funds. Unlike market-cap-weighted funds that track an index on a market capitalization basis, equal-weight investment options assign each stock in the index the same weight regardless of company size.
Some equal-weight funds available on YCharts include:
- ALPS Equal Sector Weight ETF (EQL)
- Invesco S&P 500 Equal Weight ETF (RSP)
- Invesco Russell 1000 Equal Weight ETF (EQAL)
- iShares MSCI USA Equal Weighted ETF (EUSA)
- Invesco Equally-Weighted S&P 500 Fund A (VADAX)
Using Equal-Weight Funds to Combat Index Concentration
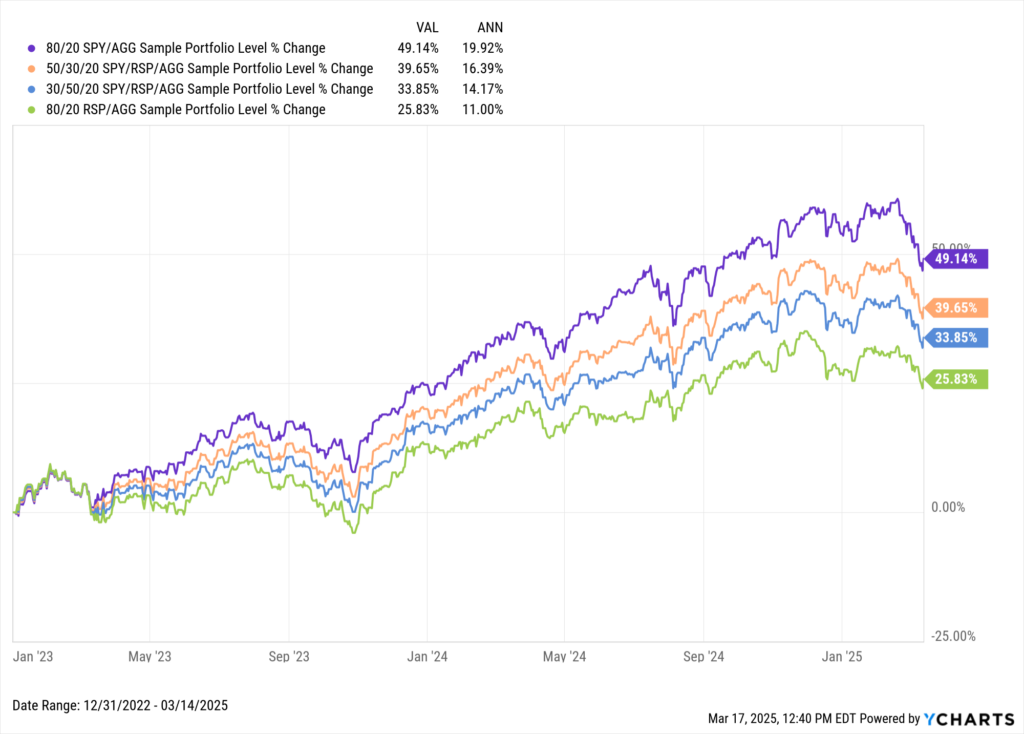
Since the start of 2023, an 80/20 SPY/AGG portfolio has risen 49.1%, while the same 80/20 portfolio with the equal-weighted RSP as the equity component has advanced only 25.8%.
This chart shows the benefits of being heavily concentrated when the largest underlying holdings are rising in price…but also the drawbacks of when they are not.
Download Visual | Modify in YCharts
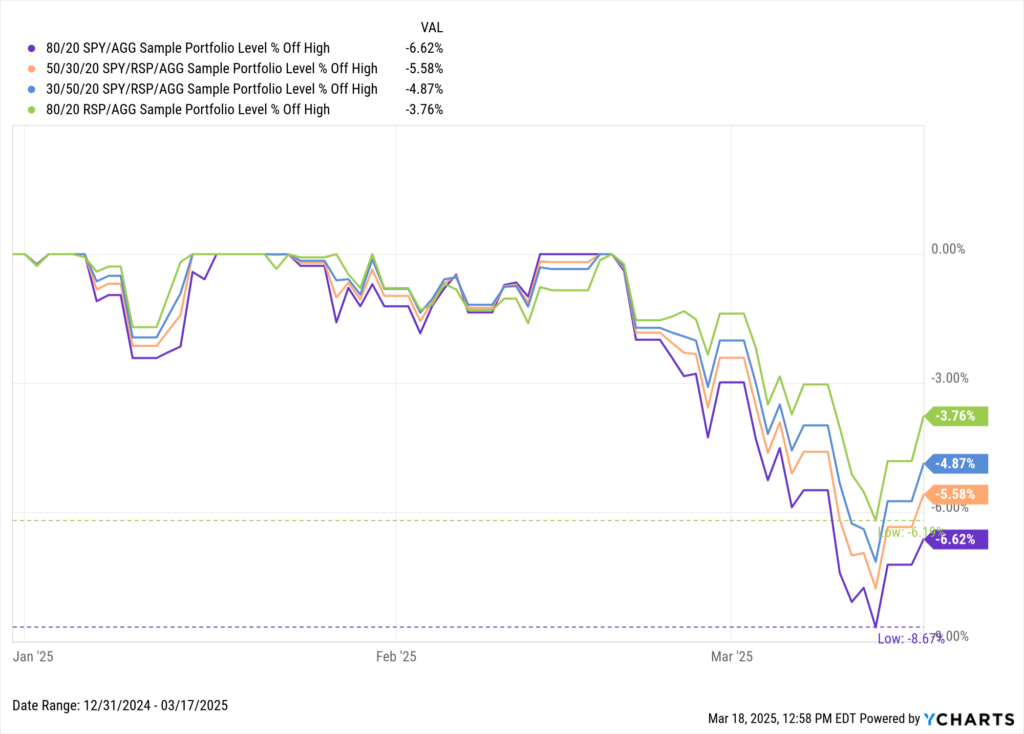
On the other hand, equal-weight funds have helped to mitigate downside caused by declining Magnificent Seven stocks. While an 80/20 SPY/AGG portfolio is down 7.21% this year, that figure becomes lighter with an increasingly higher allocation to RSP.
Download Visual | Modify in YCharts
Advisors and their clients alike have seen both the positives and negatives of index concentration over the past few years. What steps are you taking to guide portfolios through this latest stage of volatility?
Whenever you’re ready, here’s how YCharts can help you:
1. Looking to Move On From Your Investment Research and Analytics Platform?
2. Want to test out YCharts for free?
Start a no-risk 7-Day Free Trial.
Disclaimer
©2025 YCharts, Inc. All Rights Reserved. YCharts, Inc. (“YCharts”) is not registered with the U.S. Securities and Exchange Commission (or with the securities regulatory authority or body of any state or any other jurisdiction) as an investment adviser, broker-dealer or in any other capacity, and does not purport to provide investment advice or make investment recommendations. This report has been generated through application of the analytical tools and data provided through ycharts.com and is intended solely to assist you or your investment or other adviser(s) in conducting investment research. You should not construe this report as an offer to buy or sell, as a solicitation of an offer to buy or sell, or as a recommendation to buy, sell, hold or trade, any security or other financial instrument. For further information regarding your use of this report, please go to: ycharts.com/about/disclosure
Next Article
Federal Reserve Holds Rates Steady: Market Impacts and Investment Strategies for 2025Read More →