Q1 2025 Healthcare Sector Earnings: Live Updates & Market Reactions

Updated as of: May 1, 2025 @ 10:45AM CST
Introduction: Why Healthcare Earnings Matter This Quarter
As the Q1 2025 earnings season unfolds, healthcare companies are under the spotlight for more than just financial performance. In a sector deeply influenced by demographics, regulation, and innovation, this quarter’s results offer asset managers and advisors insights into the resilience of managed care, medtech growth trajectories, and pharma’s margin stability.
This live-updating blog summarizes the most relevant healthcare earnings reports and earnings calls from April 14 through April 22, 2025. Each entry highlights key results, strategic takeaways, and supporting YCharts visualizations—helping you stay informed and prepared as reporting season continues.
Latest Earnings Reports
YCharts users can view a full breakdown of all current and upcoming earnings calls and reports live here.
Not a YCharts user? Try a 7-Day Free Trial.
May 1, 2025 Earnings
CVS Health Corporation (CVS) Surpasses Q1 Expectations; Raises Full-Year Guidance
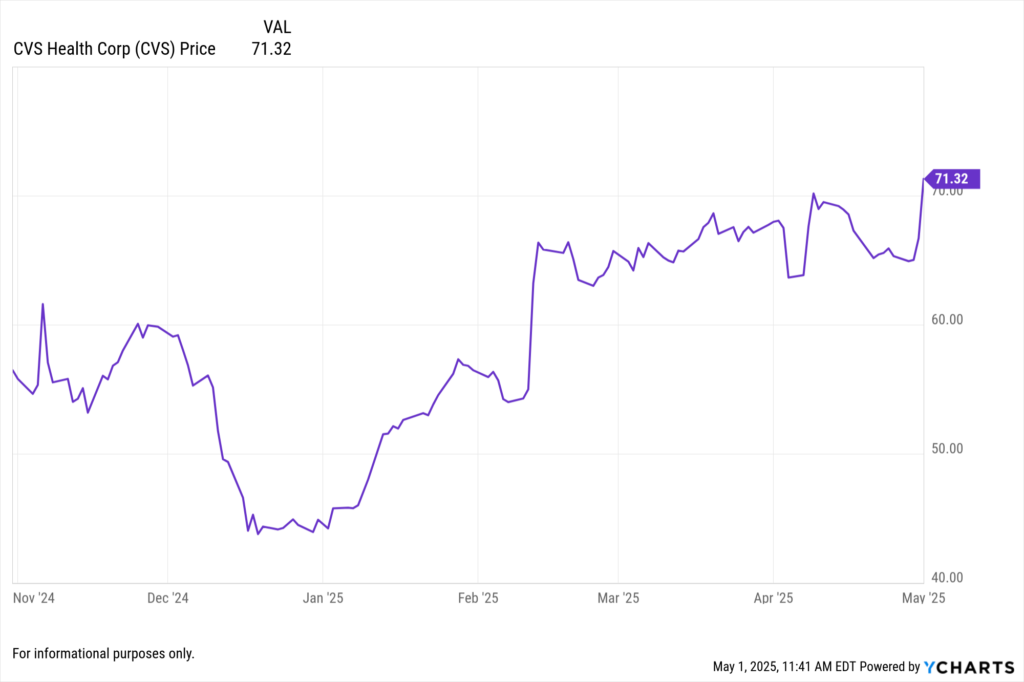
CVS Health reported Q1 2025 revenue of $94.6 billion, a 7% increase year-over-year, surpassing analyst expectations. Adjusted earnings per share (EPS) rose to $2.25, up from $1.31 in Q1 2024, driven by improved performance across all business segments. The Health Care Benefits segment saw adjusted operating income increase to $1.99 billion, reflecting favorable prior-year development and improved Medicare Advantage performance. The company also announced plans to exit the Affordable Care Act’s individual marketplaces in 2026 due to continued underperformance. Additionally, CVS Caremark will make Novo Nordisk’s Wegovy its preferred GLP-1 medication for weight management starting July 1, 2025. Following the earnings release, CVS shares rose over 8%, reaching a new 52-week high.
View CVS Health’s Earnings Report Here >
Cardinal Health Inc. (CAH) Reports Strong Q3 Fiscal 2025 Results; Raises Full-Year Outlook
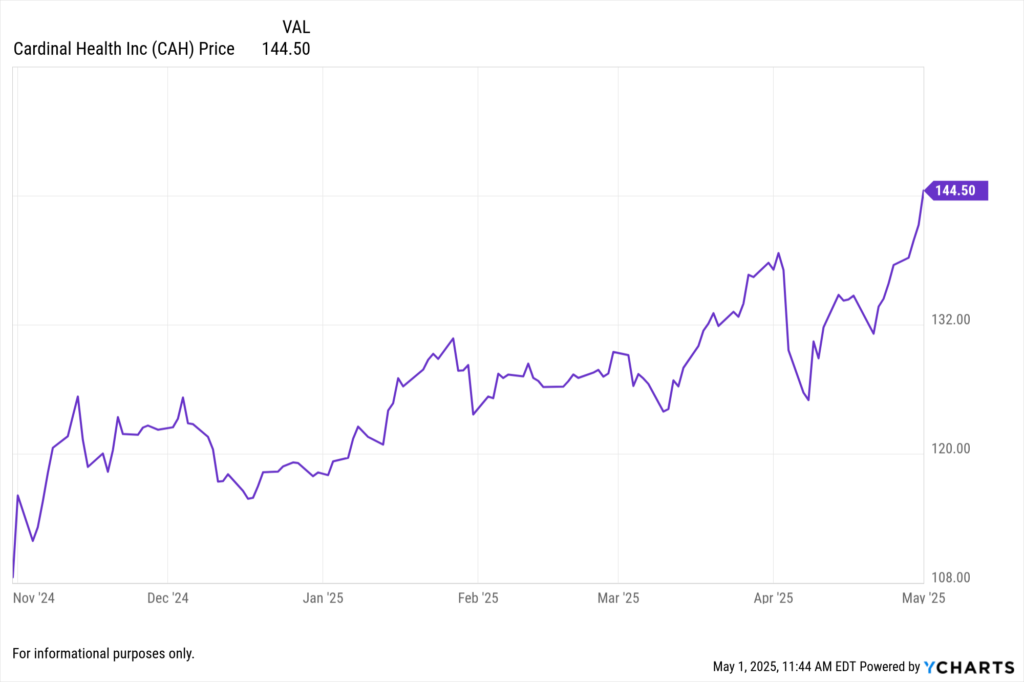
Cardinal Health reported fiscal Q3 2025 revenue of $54.88 billion, slightly below analyst expectations. However, adjusted EPS came in at $2.35, surpassing estimates of $2.17. The Pharmaceutical and Specialty Solutions segment contributed $530 million in profit, a 16% increase year-over-year. The company raised its fiscal 2025 adjusted EPS guidance to a range of $7.75 to $7.90, up from the previous range of $7.55 to $7.70. Following the announcement, Cardinal Health’s stock reached an all-time high, reflecting investor confidence in its operational performance.
View Cardinal Health’s Earnings Report Here >
April 30, 2025 Earnings
Humana Inc. (HUM) Surpasses Q1 Expectations and Reaffirms 2025 Outlook

Humana reported Q1 2025 adjusted earnings per share (EPS) of $11.58, exceeding analyst expectations. The company’s Insurance segment benefit ratio stood at 87.4%. Humana reaffirmed its full-year 2025 adjusted EPS guidance of approximately $16.25.
View Humana’s Earnings Report Here >
GSK PLC (GSK) Delivers Solid Q1 Performance and Maintains 2025 Guidance
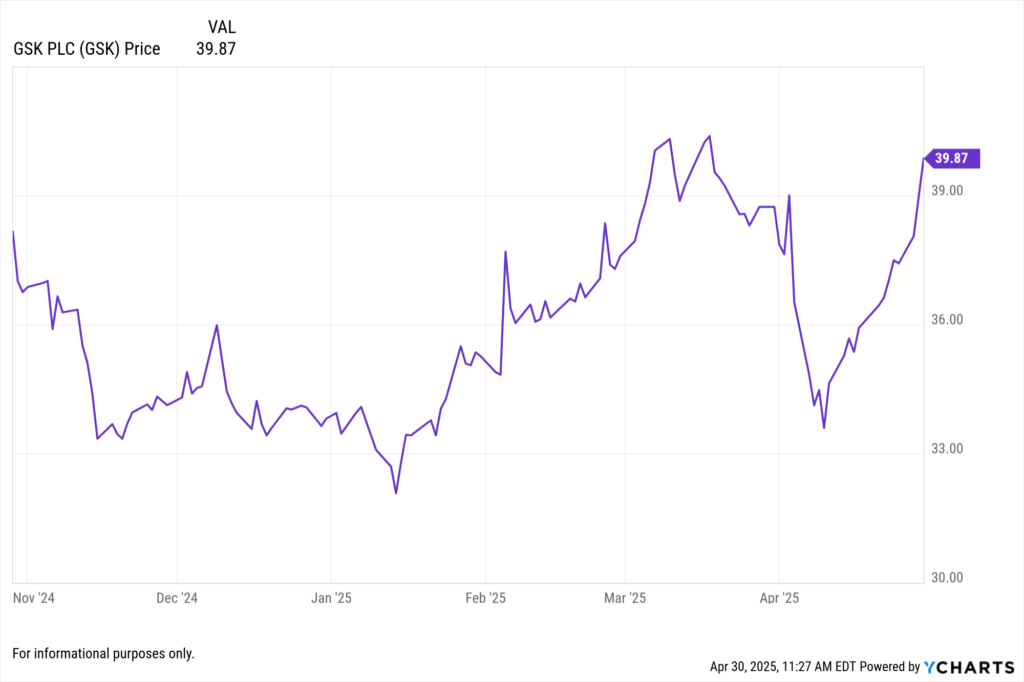
GSK reported Q1 2025 core EPS of $1.13, surpassing the consensus estimate of $1.08. The company reaffirmed its full-year 2025 guidance, anticipating turnover growth between 3% to 5% and core EPS growth between 6% to 8% at constant exchange rates.
View GSK’s Earnings Report Here >
GE HealthCare Technologies Inc. (GEHC) Beats Q1 Estimates but Lowers Full-Year EPS Forecast
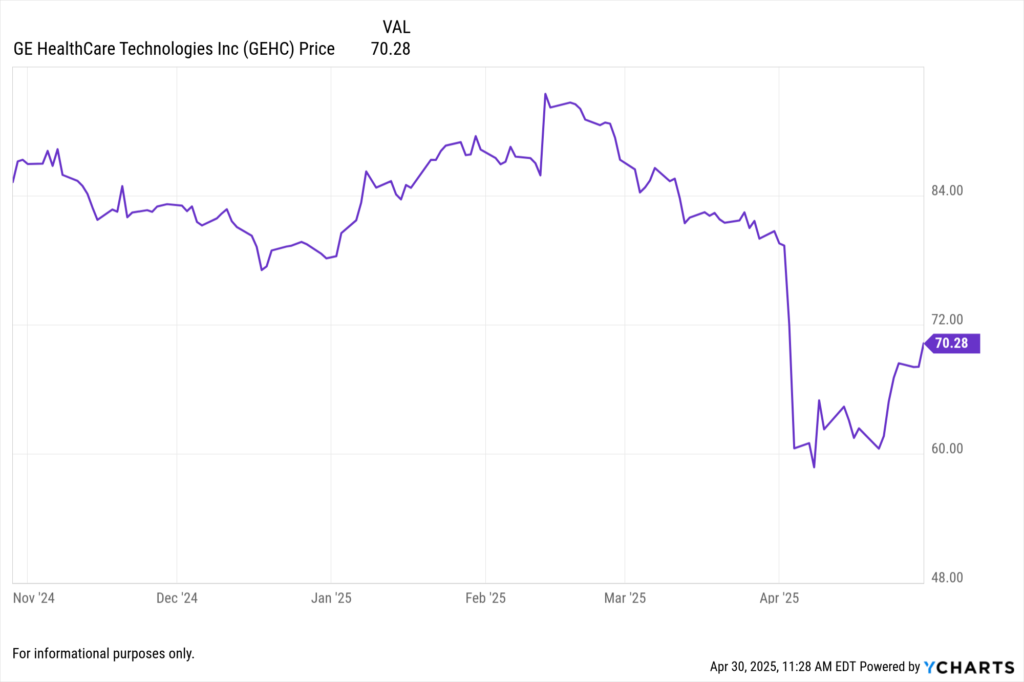
GE HealthCare reported Q1 2025 adjusted EPS of $1.01 on revenue of $4.78 billion, both exceeding analyst expectations. However, the company lowered its full-year adjusted EPS guidance to a range of $3.90–$4.10, citing a $0.85 per share negative impact due to new tariffs.
View GE HealthCare’s Earnings Report Here >
April 29, 2025 Earnings
Pfizer Inc. (PFE) Beats Q1 EPS Estimates Despite Revenue Decline
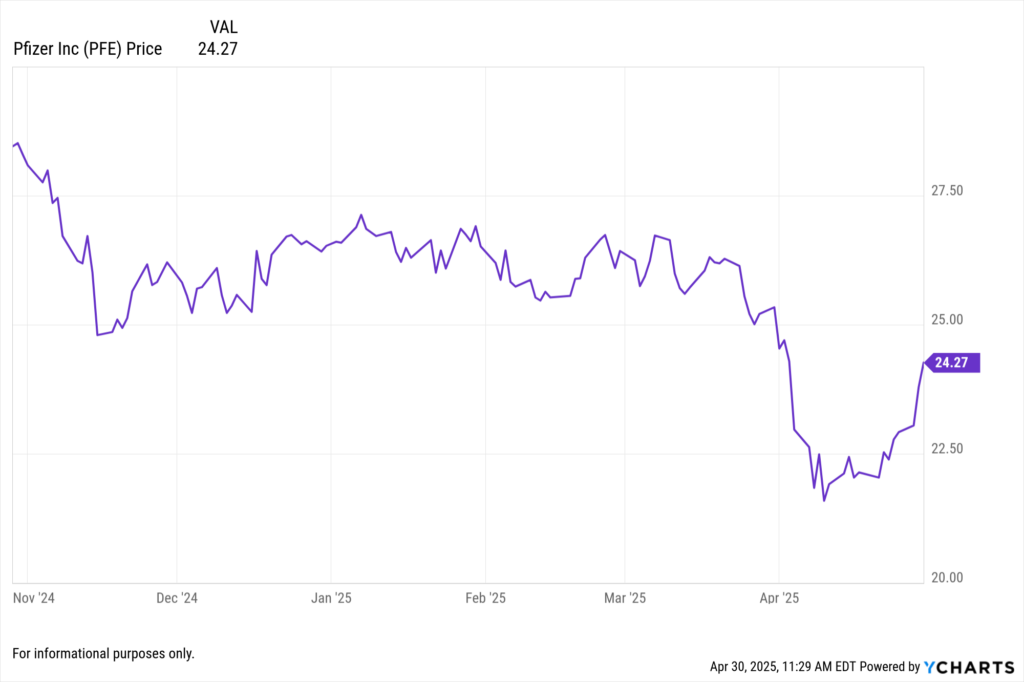
Pfizer reported Q1 2025 adjusted EPS of $0.92, surpassing analyst expectations, while revenue declined 8% year-over-year to $13.72 billion. The company reaffirmed its full-year 2025 guidance, projecting adjusted EPS between $2.80 and $3.00 and revenue between $61 billion and $64 billion.
View Pfizer’s Earnings Report Here >
Novartis AG (NVS) Reports Strong Q1 Growth and Raises 2025 Guidance
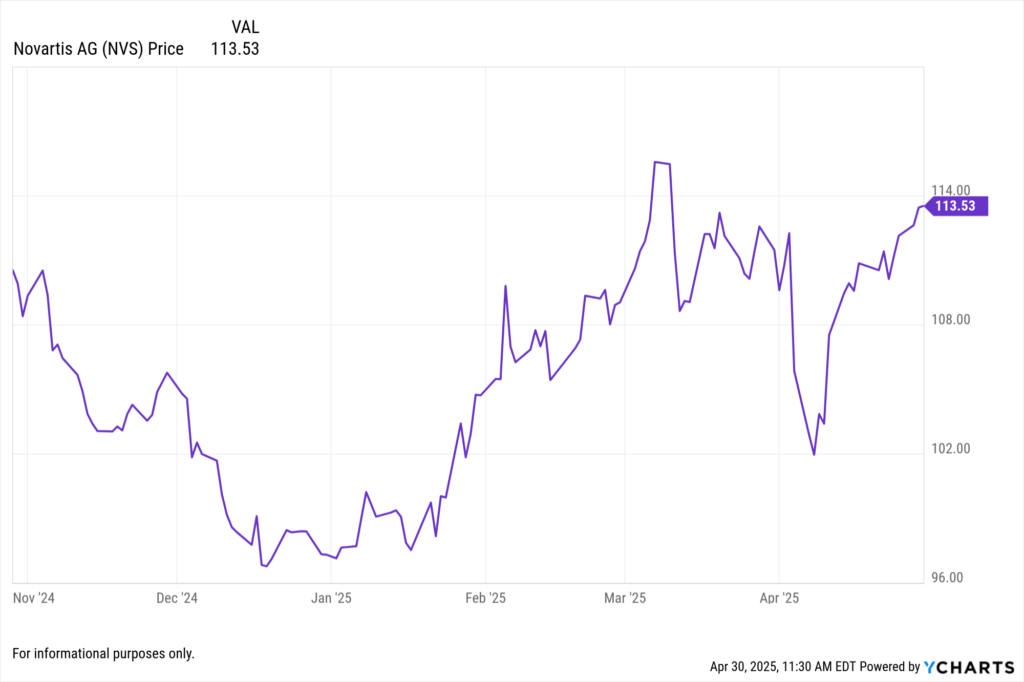
Novartis reported Q1 2025 net sales of $13.2 billion, a 12% increase year-over-year, with core EPS rising 27% to $2.28. The company raised its full-year 2025 guidance, now expecting operating income growth in the low double digits, up from the previous high single-digit to low double-digit projection.
View Novartis’s Earnings Report Here >
AstraZeneca PLC (AZN) Exceeds Q1 EPS Expectations; Maintains Full-Year Outlook
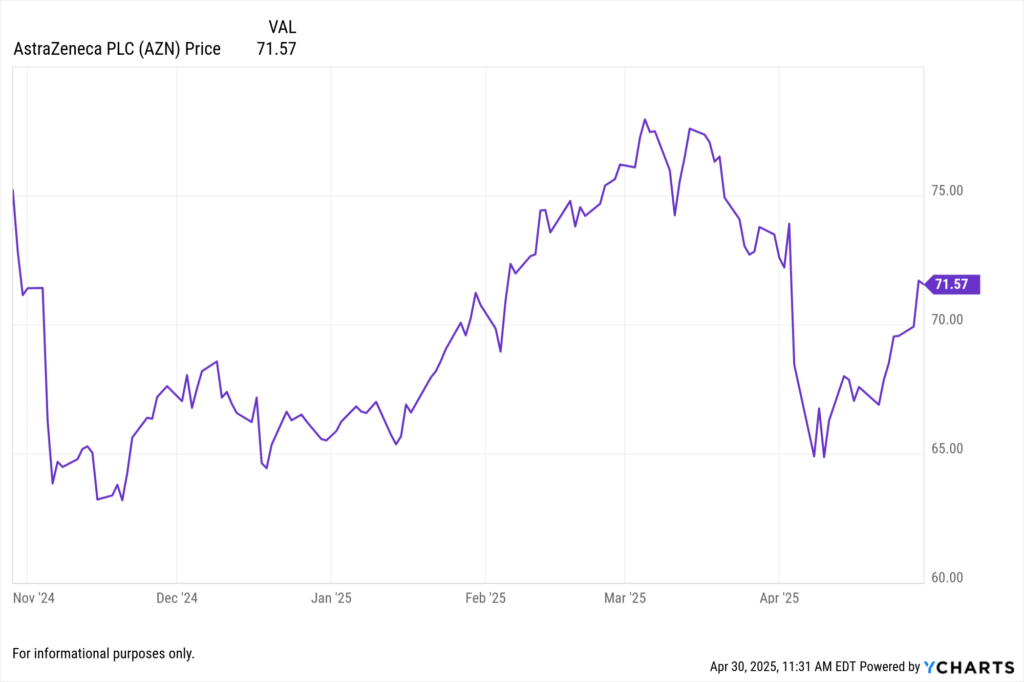
AstraZeneca reported Q1 2025 core EPS of $2.49, a 21% increase year-over-year, exceeding analyst expectations. Total revenue rose 10% to $13.59 billion. The company maintained its full-year guidance, anticipating high single-digit revenue growth and double-digit core EPS growth.
View AstraZeneca’s Earnings Report Here >
April 22, 2025 Earnings
Intuitive Surgical Inc. (ISRG) Reports Robust Q1 Growth Driven by da Vinci System Expansion
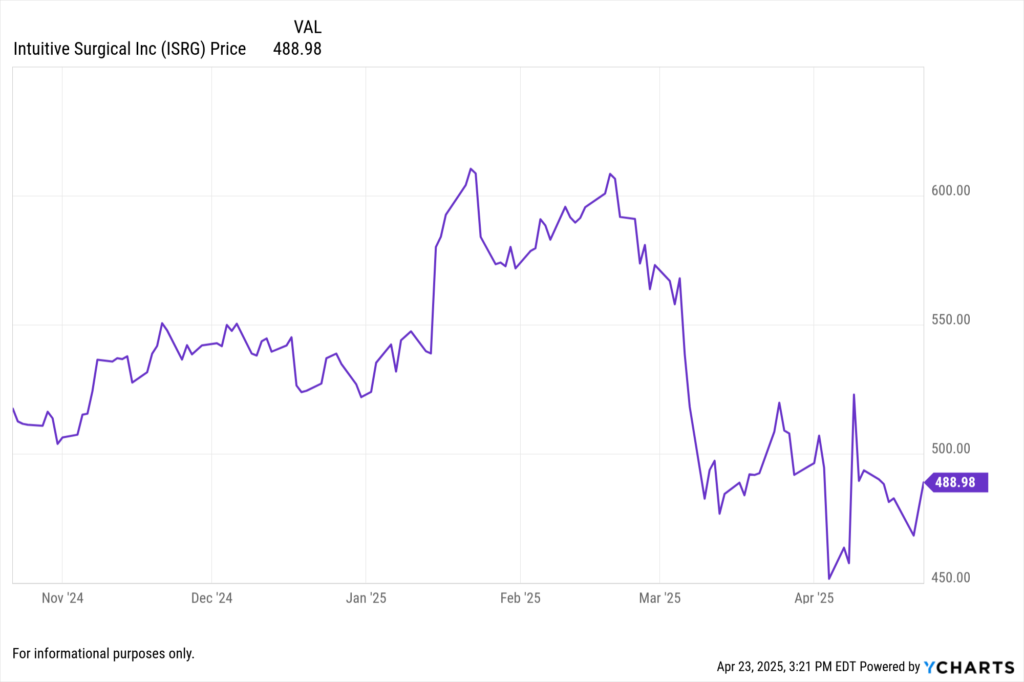
Intuitive Surgical announced Q1 2025 revenue of $2.25 billion, marking a 19% increase year-over-year. GAAP net income rose to $698 million, or $1.92 per diluted share, up from $545 million, or $1.51 per share, in Q1 2024. The company placed 367 da Vinci surgical systems during the quarter, including 147 of the advanced da Vinci 5 systems, contributing to a 17% increase in worldwide procedures. The installed base grew 15% to 10,189 systems. Looking ahead, Intuitive projects 15–17% growth in da Vinci procedures for the full year 2025.
View Intuitive Surgical Inc’s Earnings Report Here >
Elevance Health Inc. (ELV) Surpasses Q1 Expectations Amid Stable Medical Costs
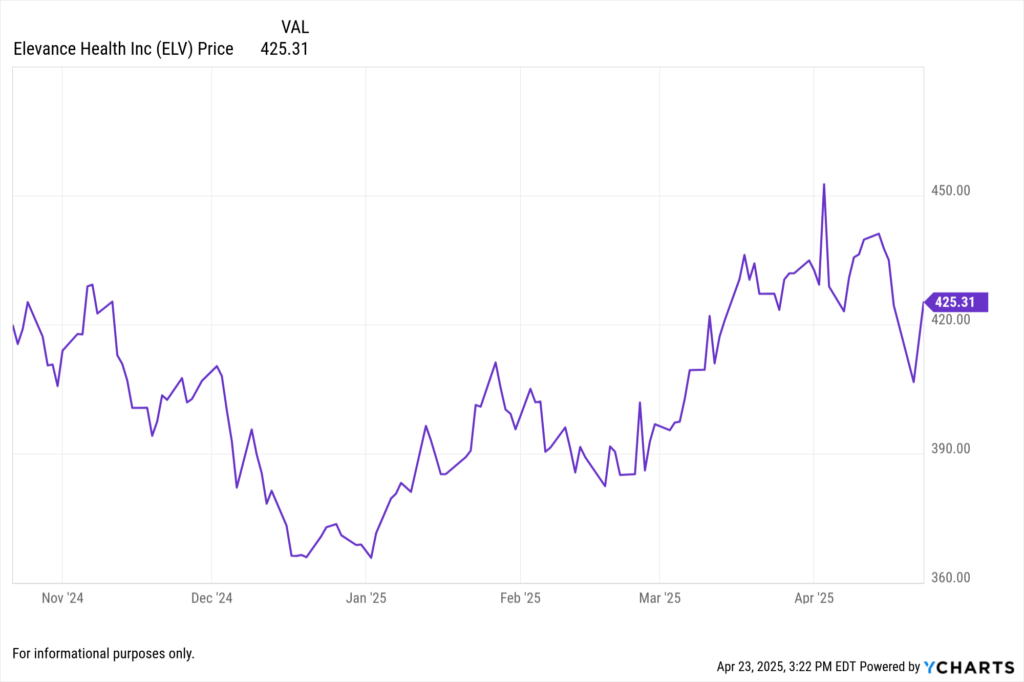
Elevance Health reported Q1 2025 operating revenue of $48.8 billion, a 15.4% increase from the prior year. Adjusted diluted EPS reached $11.97, exceeding analyst expectations of $11.38. The medical loss ratio stood at 86.4%, below the anticipated 86.8%, indicating effective cost management. Total membership grew to 45.8 million, driven by gains in Medicare Advantage and commercial plans. The company reaffirmed its full-year adjusted EPS guidance of $34.15 to $34.85.
View Elevance Health Inc’s Earnings Report Here >
Danaher Corp. (DHR) Delivers Solid Q1 Performance with $1.88 Adjusted EPS
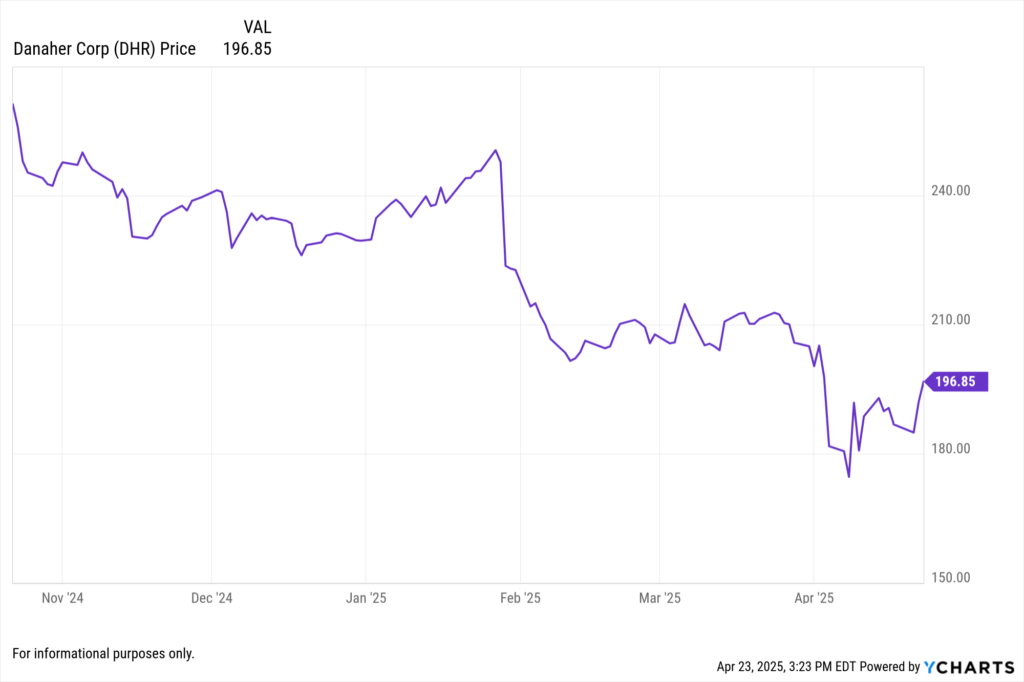
Danaher reported Q1 2025 net earnings of $1.0 billion, or $1.32 per diluted share. Non-GAAP adjusted diluted EPS was $1.88. The company’s performance reflects steady demand across its life sciences and diagnostics segments, with core revenue remaining flat year-over-year, exceeding expectations of a low-single-digit decline.
View Danaher Corp’s Earnings Report Here >
Quest Diagnostics Inc. (DGX) Achieves 12% Revenue Growth in Q1 2025
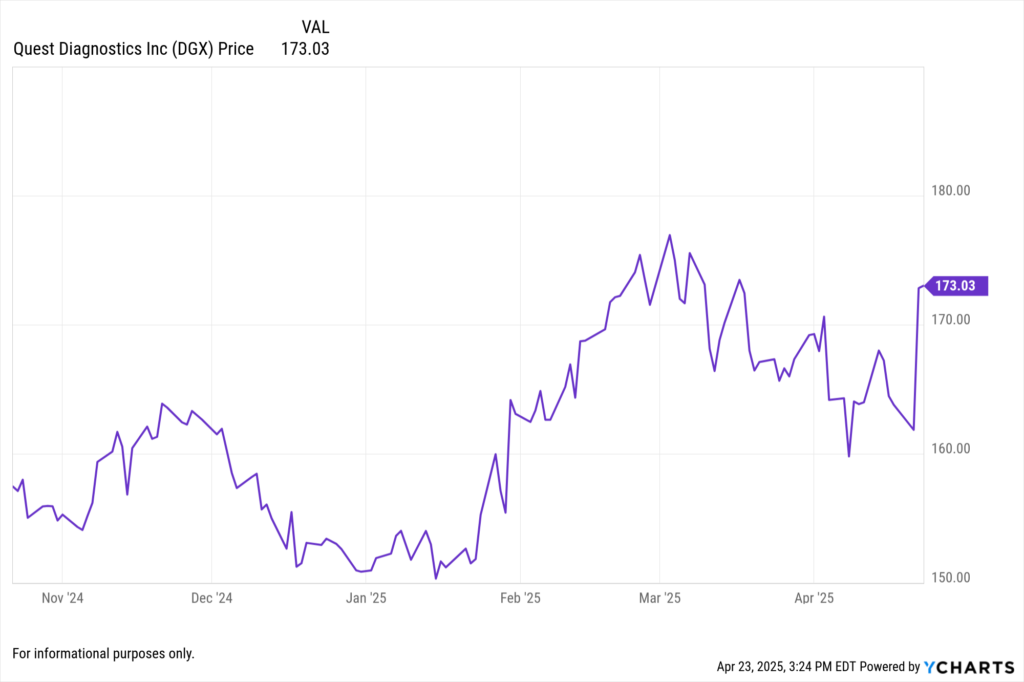
Quest Diagnostics posted Q1 2025 revenue of $2.65 billion, up 12.1% year-over-year. Adjusted EPS was $2.21, surpassing the consensus estimate of $2.16. The company reported net income of $220 million, with a profit margin of 8.3%. Quest reaffirmed its full-year revenue guidance of $10.7 to $10.85 billion and adjusted EPS guidance of $9.55 to $9.80.
View Quest Diagnostics Inc’s Earnings Report Here >
April 18, 2025 Earnings
Biomerica (BMRA) Reports Widening Losses as COVID Testing Fades
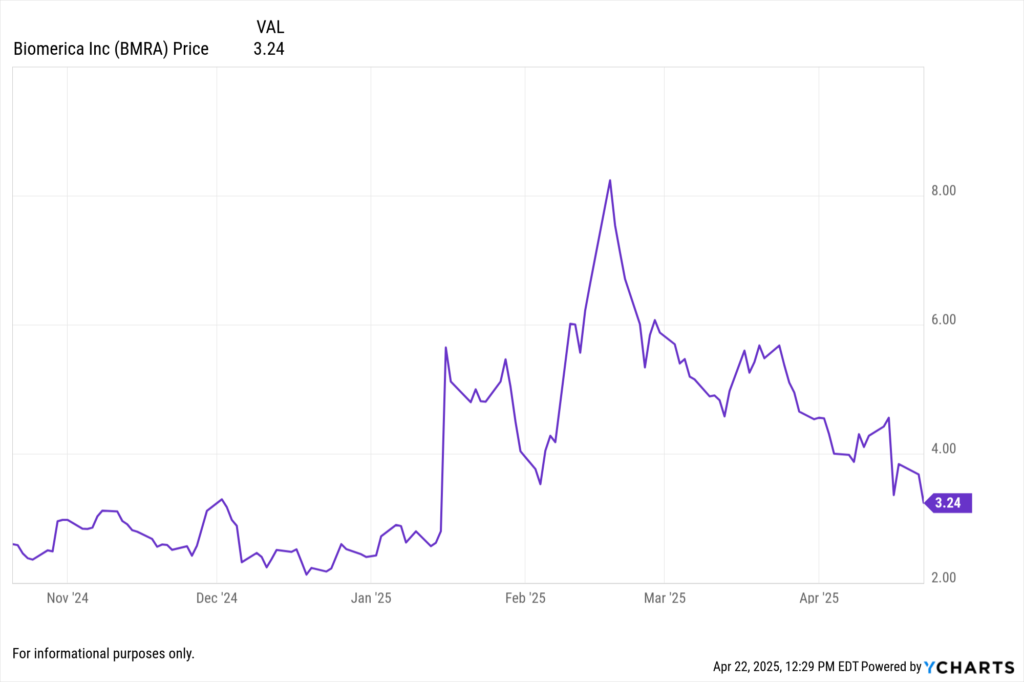
BMRA reported a Q1 net loss of ($2.6 million) and EPS of -0.23, with revenue down 12.5% YoY to $1.7 million. Legacy COVID testing revenue declined, and its GI diagnostic pipeline remains in early stages.
View Biomerica’s Earning Report >
April 17, 2025 Earnings
Johnson & Johnson (JNJ) Reaffirms 2025 Guidance Despite Consumer Weakness
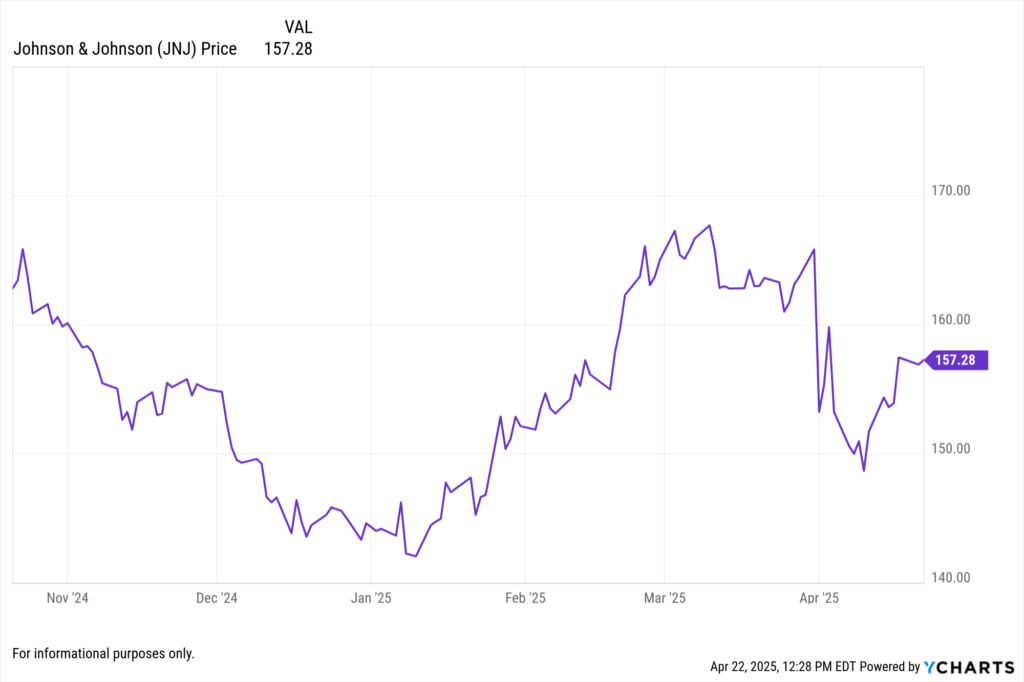
JNJ delivered Q1 net income of $5.76 billion (↓2.1% YoY), EPS of $2.68, and revenue of $21.6 billion (↑2.2% YoY). The Pharmaceutical segment continued to show strength, led by immunology and oncology.
View Johnson & Johnson’s Earnings Report Here >
April 16, 2025 Earnings
UnitedHealth Group (UNH) Delivers Strong Q1 Results with Medicare Advantage Tailwinds
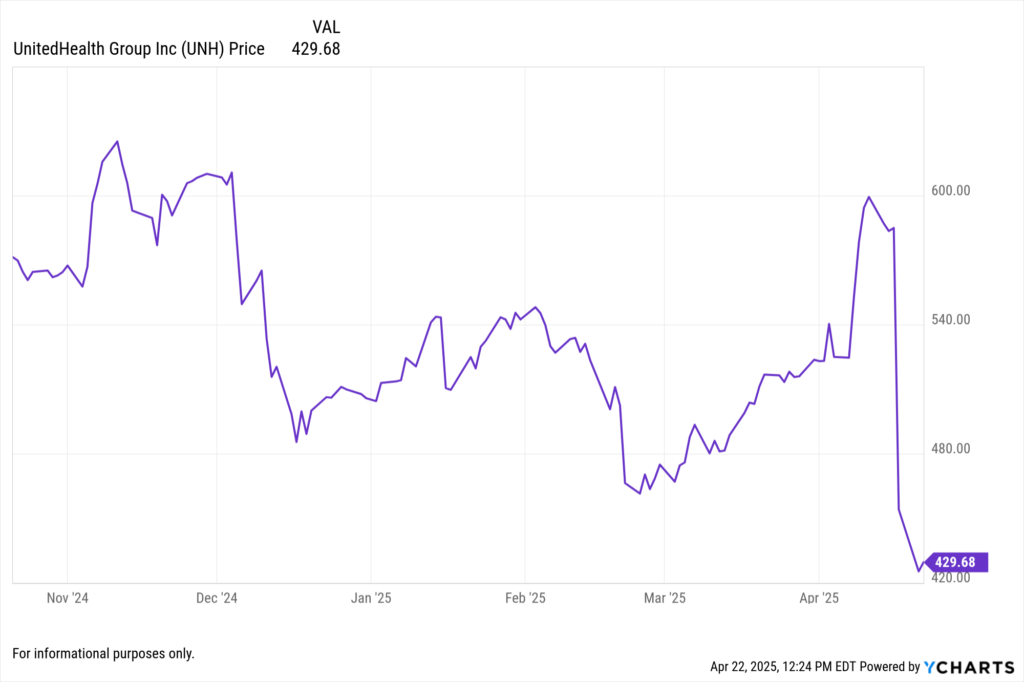
UnitedHealth reported Q1 2025 net income of $5.86 billion (↑7.3% YoY), EPS of $7.29 (↑5.5% YoY), and revenue of $111.5 billion (↑11.7% YoY). The Optum segment showed double-digit growth, while utilization trends remained favorable.
View UnitedHealth Group’s Earnings Report Here >
Abbott Laboratories (ABT) Sees Device Segment Lead Post-COVID Growth
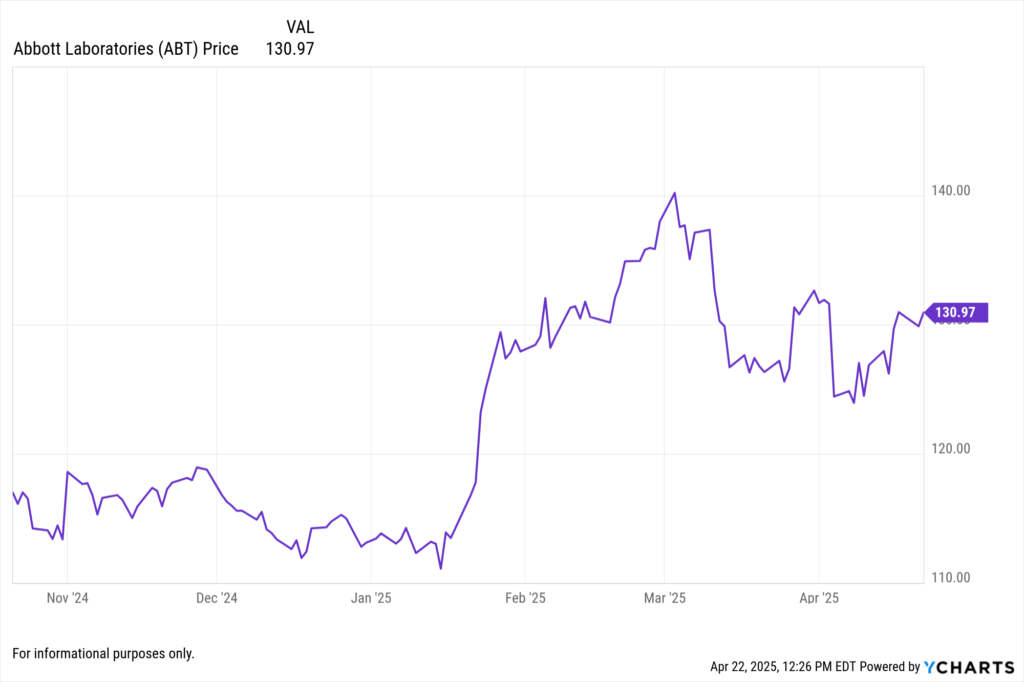
Abbott posted Q1 earnings net income of $2.22 billion (↑3.4% YoY), EPS of $1.03, and revenue of $10.9 billion (↑6.1% YoY). Cardiovascular and diabetes devices drove growth, particularly the FreeStyle Libre portfolio.
View Abbott Laboratories Earnings Report Here >
Sartorius Stedim Biotech (SRTOY) Holds Ground in Biotech Manufacturing Demand
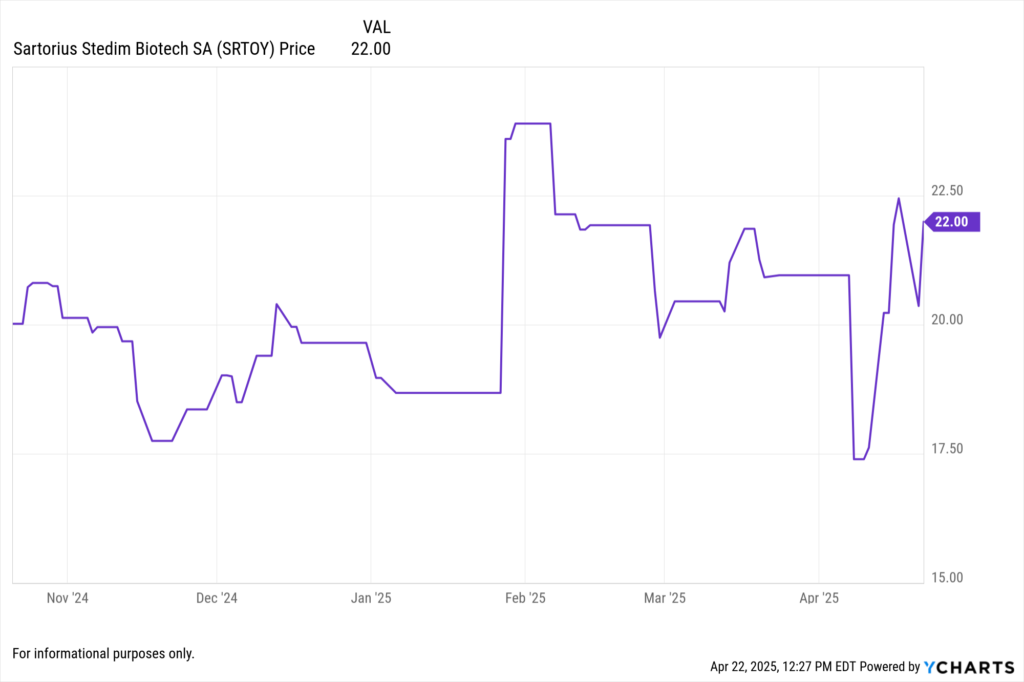
SRTOY reported Q1 earnings with net income of $217.98 million, EPS of $0.2251, and revenue of $3.07 billion. Strength in single-use technologies and global bioproduction capacity helped offset margin pressure.
View Sartorius Stedim Biotech’s Earnings Report Here >
How YCharts Can Help
Event Calendar: Monitor all upcoming healthcare earnings
Fundamental Charts: Visualize revenue, EPS, and segment growth over time
Stock Screeners: Identify high-performing stocks by EPS growth or surprise
Custom Reports: Build shareable earnings decks for client updates
Whenever you’re ready, here’s how YCharts can help you:
1. Looking to Move On From Your Investment Research and Analytics Platform?
2. Want to test out YCharts for free?
Start a no-risk 7-Day Free Trial.
Disclaimer
©2025 YCharts, Inc. All Rights Reserved. YCharts, Inc. (“YCharts”) is not registered with the U.S. Securities and Exchange Commission (or with the securities regulatory authority or body of any state or any other jurisdiction) as an investment adviser, broker-dealer or in any other capacity, and does not purport to provide investment advice or make investment recommendations. This report has been generated through application of the analytical tools and data provided through ycharts.com and is intended solely to assist you or your investment or other adviser(s) in conducting investment research. You should not construe this report as an offer to buy or sell, as a solicitation of an offer to buy or sell, or as a recommendation to buy, sell, hold or trade, any security or other financial instrument. For further information regarding your use of this report, please go to: ycharts.com/about/disclosure
Next Article
Q1 2025 Technology Sector Earnings: Live Updates & Market ReactionsRead More →