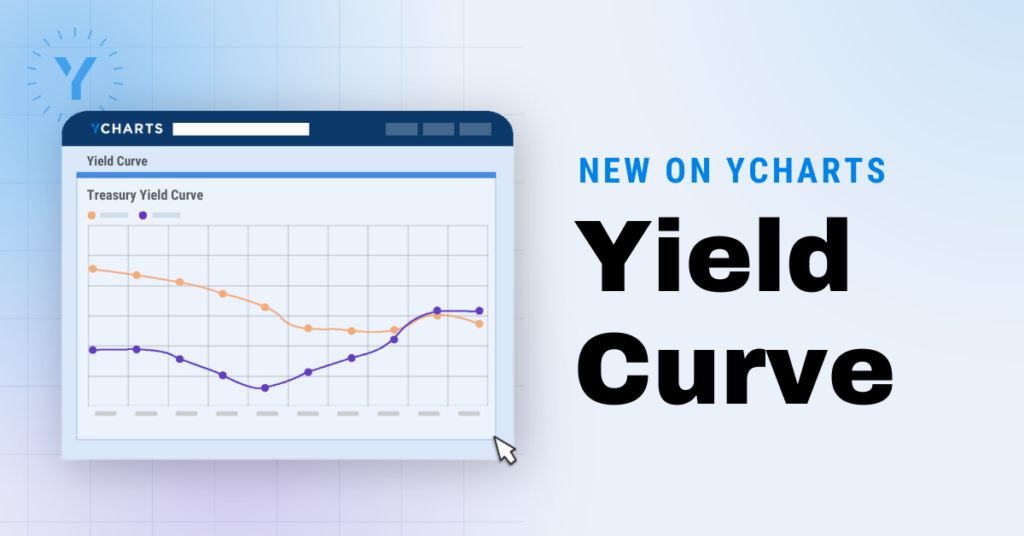
Introducing the New Yield Curve Tool on YCharts: Analyze Interest Rates with Clarity
Understanding Market Expectations Starts with the Yield Curve
With economic volatility, rate hike pauses, and a constant flow of macro data, interest rates remain at the heart of every asset manager and advisor’s outlook. Whether you’re forecasting potential recession risks or identifying income opportunities, one tool stands above the rest for clarity on the market’s outlook: the yield curve.
Now, YCharts users can harness a newly released Yield Curve Tool designed to give institutional-level yield analysis with visual ease. Whether comparing today’s rates to historical periods, assessing curve steepness, or measuring spreads like the 2Y-10Y, the Yield Curve Tool brings high-value macro analysis to your fingertips.
Exploring the YCharts Yield Curve Page
The Yield Curve page on YCharts offers a comprehensive, interactive view of U.S. Treasury rates and how their shape evolves over time—crucial for understanding economic signals, inflation expectations, and bond market dynamics. Here’s a breakdown of its key features and how each can be leveraged:
Treasury Yield Curve Comparison
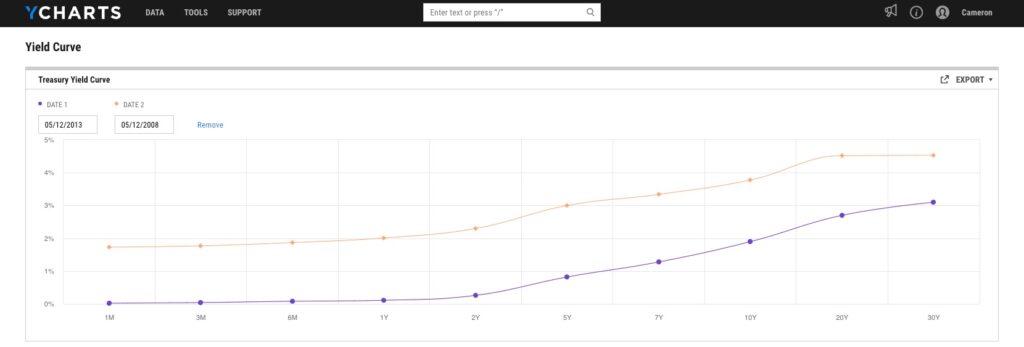
• Visualize and compare historical and current yield curves across any two dates.
Use Case: Track the steepening or flattening of the curve to gauge recession risk or monetary policy shifts.
➝ Compare Yield Curves Over Time
Core Treasury & Credit Rates Table
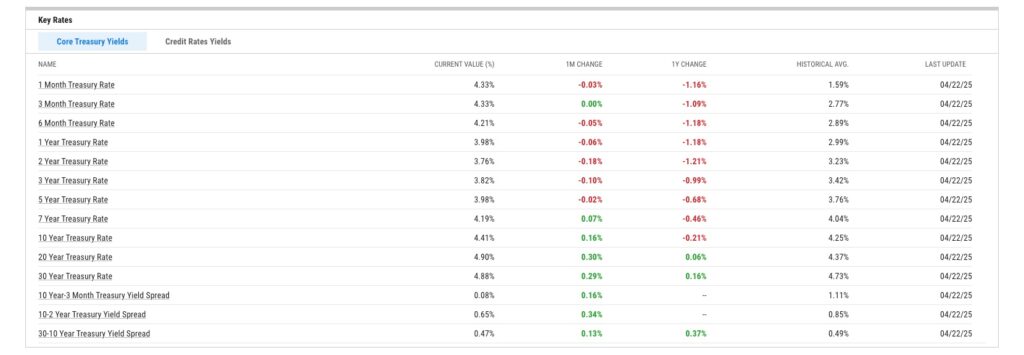
• 1M to 30Y Treasury yields
• Rate spreads (2-10Y, 10-30Y)
• 1M and 1Y changes
• Historical averages
Use Case: Pinpoint rate sensitivity for portfolio construction and bond laddering strategies.
➝ Track Treasury & Credit Yields in Real-Time
Intraday Rate Trends
• CBOE 5-Year Treasury Index
• CBOE 10-Year Treasury Index
• CBOE 30-Year Treasury Index
Use Case: Identify intraday volatility and market sentiment shifts based on rate movements.
➝ View Intraday Treasury Index Trends
Yield Curve-Related News Feed
• Stay updated with a live stream of macroeconomic news and interest rate insights.
• Includes earnings news, Fed commentary, and bond market summaries.
Use Case: Contextualize yield curve shifts with current events and analyst sentiment.
Curated Resources Sidebar
Links to timely YCharts resources such as:
• Sector & earnings decks
• Historical macroeconomic updates
• Relevant blogs (e.g., US-UK trade impacts, earnings sessions)
Use Case: Dig deeper into how yield curve dynamics affect sectors, companies, and your strategy.
These features allow advisors to gauge risk sentiment, track dislocations, and build yield-focused strategies aligned with market conditions.
Use Cases for Advisors & Asset Managers
1. Recession Forecasting & Allocation Shifts
With the 2Y-10Y spread recently inverted and macro signals flashing mixed, understanding curve dynamics helps advisors identify whether clients should lean defensive or lean into duration risk. Overlay past recessions or Fed decisions to detect patterns that signal regime shifts.
YCharts Tool Pairing:
• Use Scenario & Stress Testing to simulate rate curve normalization.
• Combine with Economic Indicators like CPI or GDP to create macro dashboards.
2. Fixed Income & Bond Ladder Construction
For advisors focused on generating income through bonds, the curve shape is a guide for where to invest. An upward-sloping curve may favor intermediate terms, while flat or inverted curves demand a reallocation strategy.
YCharts Tool Pairing:
• Filter strategies in the Mutual Fund Screener by average maturity or duration.
• Use Comparison Tables to line up funds by yield profile or treasury allocation.
How the Yield Curve Tool Enhances Portfolio Strategy
With real-time curve overlays and historic context, this page becomes a critical diagnostic for portfolio shifts. Whether building fixed income sleeves or timing cyclical allocations based on macro sentiment, this tool equips users to:
• Monitor recession probabilities
• Justify rate-sensitive tilts to clients
• Track yield curve normalization or deepening inversions
• Compare today’s environment to post-2008 or pandemic-related recoveries
No longer do you need to source treasury data from multiple sites or wrangle Excel—YCharts provides the full macro toolkit in one interactive view.
How YCharts Can Help
The Yield Curve Tool is just the beginning. YCharts offers a complete suite for macro and fixed income investors:
Scenario & Stress Testing: Model bond impacts under different yield scenarios
Custom Reports: Export yield visuals and spreads into branded client presentations
Fundamental Charts: Compare inflation breakevens or 10Y Treasury with equity valuations
Closing Thoughts: A Forward-Looking Yield Tool
As monetary policy pivots and long-duration assets react, yield curves remain one of the purest indicators of macro sentiment. The YCharts Yield Curve Tool empowers advisors to monitor real-time shifts, visualize regime changes, and communicate rate-driven insights to clients with confidence.
Start using the new Yield Curve Tool today and stay ahead of market inflection points.
Whenever you’re ready, here’s how YCharts can help you:
1. Looking to Move On From Your Investment Research and Analytics Platform?
2. Want to test out YCharts for free?
Start a no-risk 7-Day Free Trial.
Disclaimer
©2025 YCharts, Inc. All Rights Reserved. YCharts, Inc. (“YCharts”) is not registered with the U.S. Securities and Exchange Commission (or with the securities regulatory authority or body of any state or any other jurisdiction) as an investment adviser, broker-dealer or in any other capacity, and does not purport to provide investment advice or make investment recommendations. This report has been generated through application of the analytical tools and data provided through ycharts.com and is intended solely to assist you or your investment or other adviser(s) in conducting investment research. You should not construe this report as an offer to buy or sell, as a solicitation of an offer to buy or sell, or as a recommendation to buy, sell, hold or trade, any security or other financial instrument. For further information regarding your use of this report, please go to: ycharts.com/about/disclosure
Next Article
U.S.–China 90-Day Tariff Pause: Market Relief or Temporary Truce?Read More →