Annual Reviews, Reimagined: Household-Level Insights That Strengthen Client Relationships

The annual review is a chance to reset expectations, showcase progress, and reinforce your value. Yet for many advisors, it can feel like a check-the-box activity—an operational task rather than a strategic opportunity.
With the right tools, though, it becomes one of your most impactful client touchpoints. Still, prepping for these meetings often means gathering performance reports, juggling account-level data, and scrambling to tell a clear, compelling story.
YCharts simplifies that process, especially when you’re working with clients who have multiple accounts or family members under one household. With new Household Portfolio enhancements and smarter reporting tools, you can walk into every review with confidence and clarity.
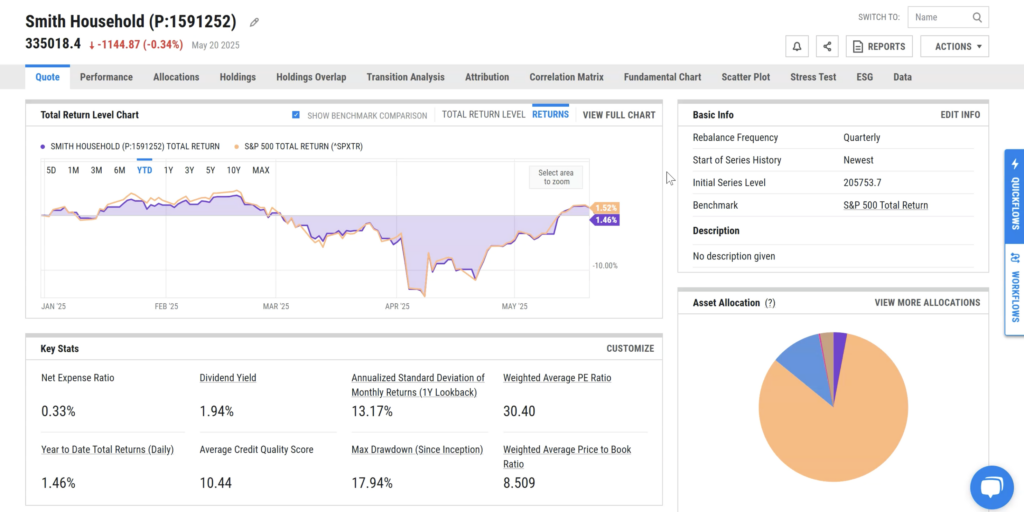
One View of the Entire Household
Imagine this: your client arrives for their annual meeting, and instead of juggling performance reports from different systems, you use YCharts to provide supporting context around allocation, positioning, and the “why” behind your investment decisions. You can:
• Break down asset allocation and underlying holdings by portfolio
• See which holdings are driving returns at the household level
• Reinforce how each account supports the overall strategy
This high-level view makes it easy to spot imbalances, support your recommendations, and answer the most important question: “How are we doing overall?”
Cleaner Reports, Clearer Conversations
With updated modules like Household Overview and Asset Allocation by Portfolio, YCharts reports are built for better client communication. You can highlight key metrics, add explanatory visuals, and avoid the need to piece together separate PDFs.
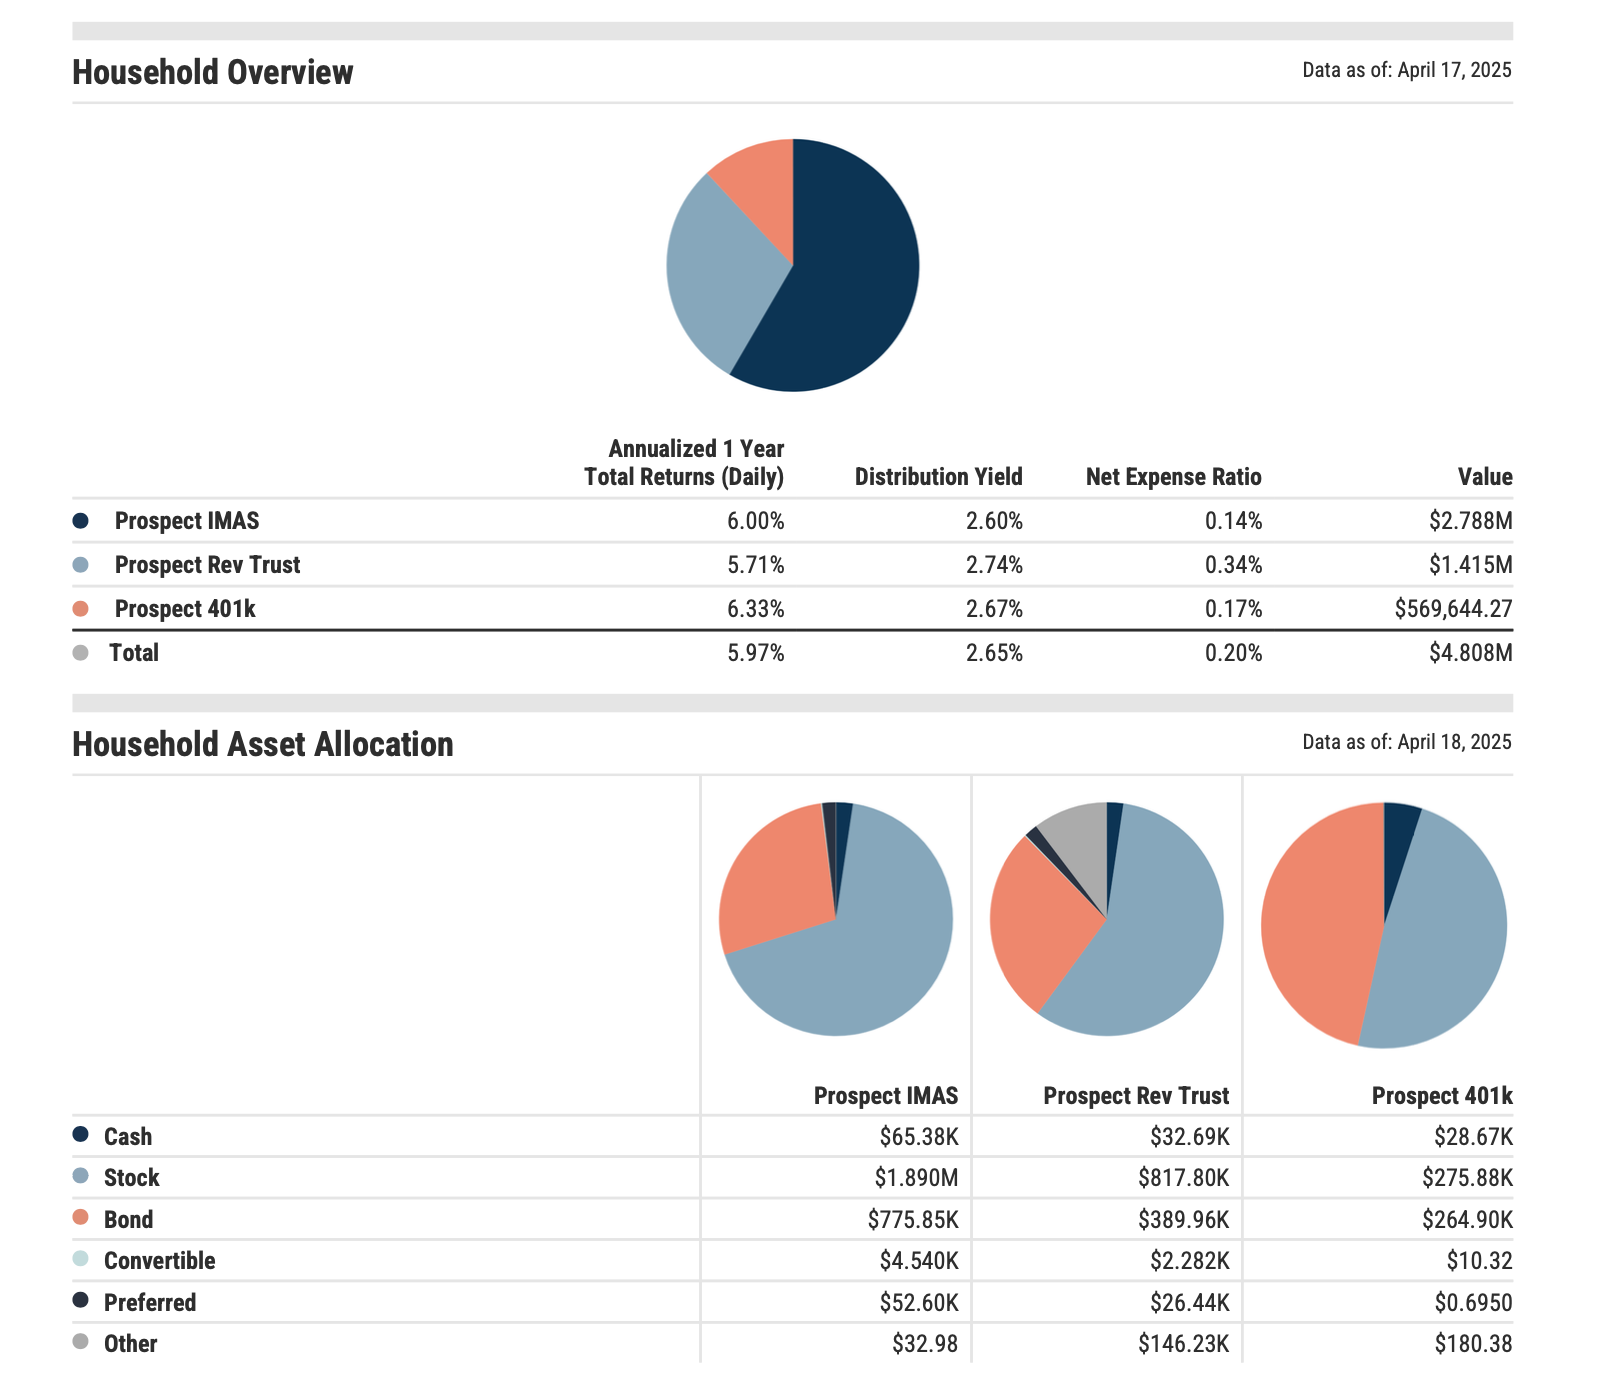
These reports don’t just look better—they make your message clearer. When clients can follow the story visually, they’re more likely to stay engaged and trust the strategy.
Want to make a change to the portfolio on the spot? Use Quick Extract to pull in updated holdings, then generate a revised proposal right in the meeting.
Add Depth with Risk & Attribution Analysis
Not all households are managed to a single risk profile. But with YCharts, you can still communicate how each account fits into the overall strategy. Bring in custom Risk Profiles and show alignment across accounts.
Use attribution analysis to spotlight what’s working and where adjustments could be made. Whether it’s a sector overweight or an underperforming strategy, these insights help drive smarter conversations.
Stay Organized Year-Round with Folders
Annual reviews don’t start with a meeting—they start with prep. Folders let you organize client documents, reports, and models throughout the year so you’re never scrambling the week before.
You can even create Public Folders for your team to collaborate on prep materials, standardize templates for common household structures, and ensure everyone is working from the same playbook.
Together, these tools turn the annual review into more than a look-back. They help advisors connect performance to goals, show accountability, and surface new planning opportunities.
Keep the Relationship Growing
The annual review is one of your best opportunities to deepen trust. It’s a chance to surface new goals and reinforce your value. YCharts gives you the tools to make those conversations clearer, more data-driven, and more personal.
Whenever you’re ready, here’s how YCharts can help you:
1. Want to know how much time you could save on proposals?
Calculate Your ROI with YCharts and see the impact for your business.
2. Looking to move on from your investment research and analytics platform?
3. Want to test out YCharts for free?
Start a no-risk 7-Day Free Trial.
Disclaimer
©2025 YCharts, Inc. All Rights Reserved. YCharts, Inc. (“YCharts”) is not registered with the U.S. Securities and Exchange Commission (or with the securities regulatory authority or body of any state or any other jurisdiction) as an investment adviser, broker-dealer or in any other capacity, and does not purport to provide investment advice or make investment recommendations. This report has been generated through application of the analytical tools and data provided through ycharts.com and is intended solely to assist you or your investment or other adviser(s) in conducting investment research. You should not construe this report as an offer to buy or sell, as a solicitation of an offer to buy or sell, or as a recommendation to buy, sell, hold or trade, any security or other financial instrument. For further information regarding your use of this report, please go to: ycharts.com/about/disclosure
Next Article
May 2025’s Top Market Movers: Stocks, ETFs, and Mutual Funds That Led the WayRead More →