June 2025’s Top Market Movers: Stocks, ETFs, and Mutual Funds That Led the Way
Why This Matters
For financial advisors and investors, keeping tabs on top-performing securities reveals where market momentum is building. Such insights can spot tactical opportunities or validate existing strategies. June 2025’s top market movers brought plenty of surprises but also kept the heat from May’s rally (as highlighted in May 2025’s Top Market Movers). In this edition, we break down the top market movers of June 2025 across stocks, ETFs, and mutual funds, and explore why they led the pack and how advisors can leverage these trends in portfolios.
Read here to see insight into the best performing stocks of the last 25 years.
Table of Contents
Top Performing Stocks in June 2025
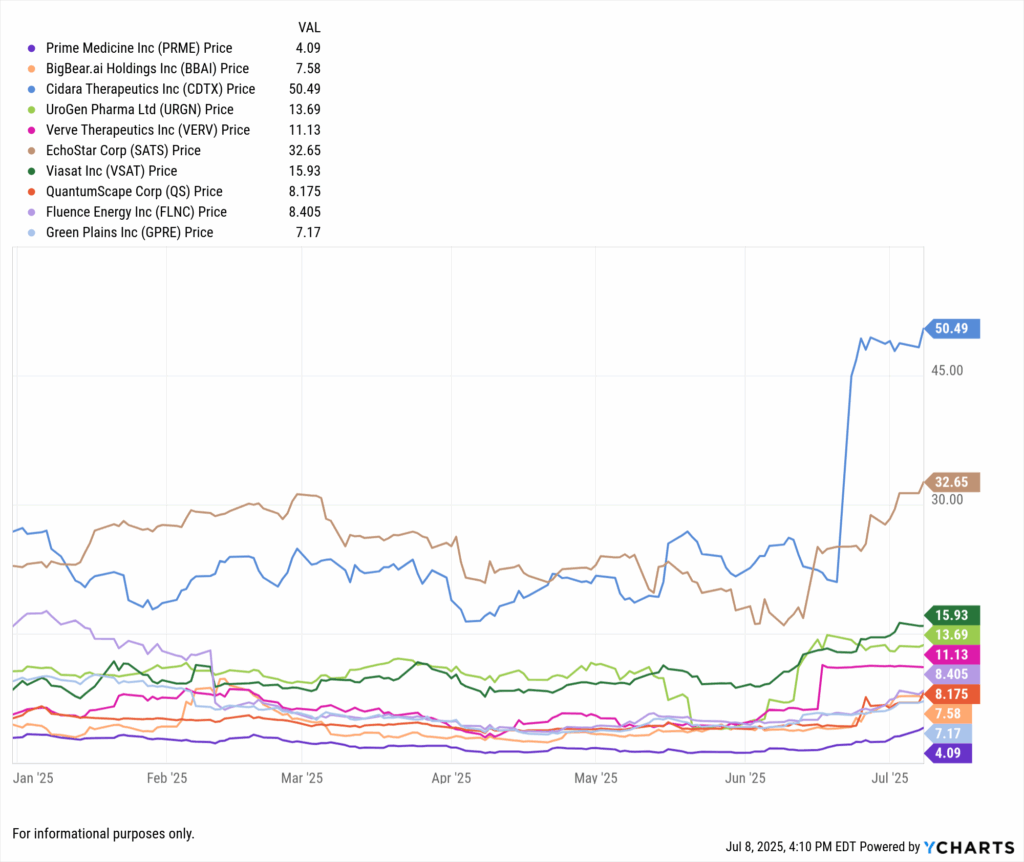
While the S&P 500 logged a strong +5.1% gain in June , even more explosive returns came from the Russell 3000, where small and mid-cap names dominated. Many of June’s top performers came from the Health Care and Technology sectors, with multiple names posting monthly gains of 70% or more. Below are the top 10 performers in the Russell 3000 for June:
| Symbol | Name | Sector | 1 Month Price Returns (Daily) |
|---|---|---|---|
| PRME | Prime Medicine Inc | Health Care | 124.9% |
| BBAI | BigBear.ai Holdings Inc | Information Technology | 102.1% |
| CDTX | Cidara Therapeutics Inc | Health Care | 91.51% |
| URGN | UroGen Pharma Ltd | Health Care | 83.04% |
| VERV | Verve Therapeutics Inc | Health Care | 80.15% |
| SATS | EchoStar Corp | Communication Services | 79.40% |
| VSAT | Viasat Inc | Information Technology | 72.96% |
| QS | QuantumScape Corp | Consumer Discretionary | 69.73% |
| FLNC | Fluence Energy Inc | Industrials | 69.07% |
| GPRE | Green Plains Inc | Energy | 67.87% |
Healthcare dominated, with 4 of the 10 top performers. Many of these companies had strong news catalysts or drug pipeline developments driving outsized returns:
- Prime Medicine Inc (PRME): Led the entire Russell 3000 with a +124.9% return in June. The company announced promising preclinical results for a rare disease gene therapy, attracting speculative capital and bullish analyst upgrades.
- BigBear.ai Holdings (BBAI): Surged over +100% following the announcement of a government AI analytics contract and renewed market enthusiasm for AI-focused small caps.
- Cidara Therapeutics (CDTX): Gained over 90% after reporting positive Phase 2 trial results for its antifungal pipeline, giving the biotech sector a rare clinical win.
Q: How do small-cap biotech and tech stocks gain so much in a single month?
A: These stocks tend to have high volatility and are sensitive to catalysts like FDA approvals, M&A speculation, or big contract wins. Using YCharts’ Stock Screener, you can quickly filter by performance and news metrics to track high-momentum names like these before they run.
From an advisor’s perspective, these types of stocks are often too risky for core allocations—but they’re critical to monitor for sector momentum, client curiosity, and macro risk appetite. The strong showing in biotech and AI-linked small caps suggests investor sentiment was risk-on in June.
YCharts Tools for Analysis:
- Fundamental Charts: Overlay stock performance with clinical trial timelines or news release markers to connect price movement with fundamental catalysts.
- Stock Screener: Filter Russell 3000 stocks by 1-month return, sector, or market cap to build repeatable workflows that catch monthly movers.
Q: Should advisors include volatile biotech names in client portfolios?
A: Not always. These stocks carry binary risk—often tied to a single product or trial. But they are useful as satellite positions for high-risk clients or model portfolios. Use YCharts’ risk metrics and 3Y volatility comparisons to help assess whether the reward justifies the risk.
Top Performing ETFs in June 2025
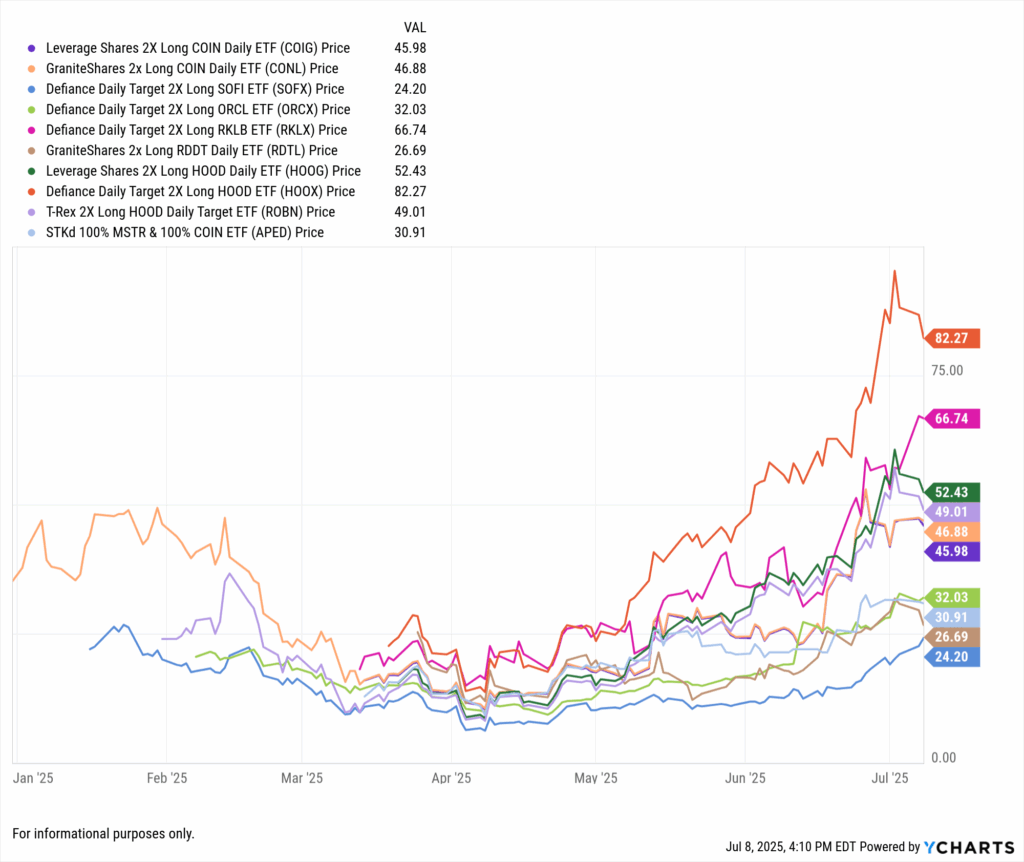
The best-performing ETFs in June tell a clear story: traders piled into leveraged bets on AI, meme stocks, and tech-focused names. While broad-market ETFs like SPY and QQQ posted solid gains, niche leveraged strategies dominated the leaderboard—often delivering double- or even triple-digit returns in just one month.
| Symbol | Name | Category Name | Total AUM($) | 1 Month Price Returns (Daily) |
|---|---|---|---|---|
| COIG | Leverage Shares 2X Long COIN Daily ETF | Trading--Leveraged Equity | 3.542M | 89.36% |
| CONL | GraniteShares 2x Long COIN Daily ETF | Trading--Leveraged Equity | 905.64M | 88.75% |
| SOFX | Defiance Daily Target 2X Long SOFI ETF | Trading--Leveraged Equity | 48.97M | 76.46% |
| ORCX | Defiance Daily Target 2X Long ORCL ETF | Trading--Leveraged Equity | 25.09M | 71.27% |
| RKLX | Defiance Daily Target 2X Long RKLB ETF | Trading--Leveraged Equity | 50.38M | 69.01% |
| RDTL | GraniteShares 2x Long RDDT Daily ETF | Trading--Leveraged Equity | 25.07M | 55.25% |
| HOOG | Leverage Shares 2X Long HOOD Daily ETF | Trading--Leveraged Equity | 30.78M | 49.40% |
| HOOX | Defiance Daily Target 2X Long HOOD ETF | Trading--Leveraged Equity | 15.13M | 49.07% |
| ROBN | T-Rex 2X Long HOOD Daily Target ETF | Trading--Leveraged Equity | 185.38M | 47.85% |
| APED | STKd 100% MSTR & 100% COIN ETF | Derivative Income | 1.558M | 45.63% |
This performance spike is closely tied to crypto and AI-related rallies. Leveraged exposure to Coinbase (COIN), Robinhood (HOOD), and Reddit (RDDT) proved particularly profitable. Notably, CONL and COIG, both tracking COIN, returned nearly 90% as Bitcoin hit $78,000 in late June.
Q: Why are leveraged ETFs topping the charts in 2025?
A: Speculation returned in force in Q2 2025, with retail momentum chasing AI, crypto, and meme tickers. These ETFs offer 2x or 3x exposure, amplifying gains (and losses). Use YCharts’ Fund Screener to filter by category, AUM, and return to analyze trends with precision.
From a portfolio construction standpoint, most of these ETFs remain unsuitable for core positions, but they reveal important risk-on signals. Several funds, including RKLX and ORCX, posted high double-digit returns with relatively moderate AUM, an indication of concentrated directional bets.
YCharts Tools for Analysis:
- Holdings Overlap Tool: Compare exposure across crypto-leveraged ETFs like COIG and CONL to avoid portfolio redundancy.
- Fund Screener: Segment by category, performance, and AUM to find liquid, high-beta strategies worth tracking.
Q: How should advisors explain the risks of leveraged ETFs to clients?
A: Clarity is key. These funds reset daily and don’t behave like traditional ETFs over longer periods. Use YCharts’ Return vs Risk visualization to model short- vs long-term performance for educational discussions.
Top Performing Mutual Funds in June 2025
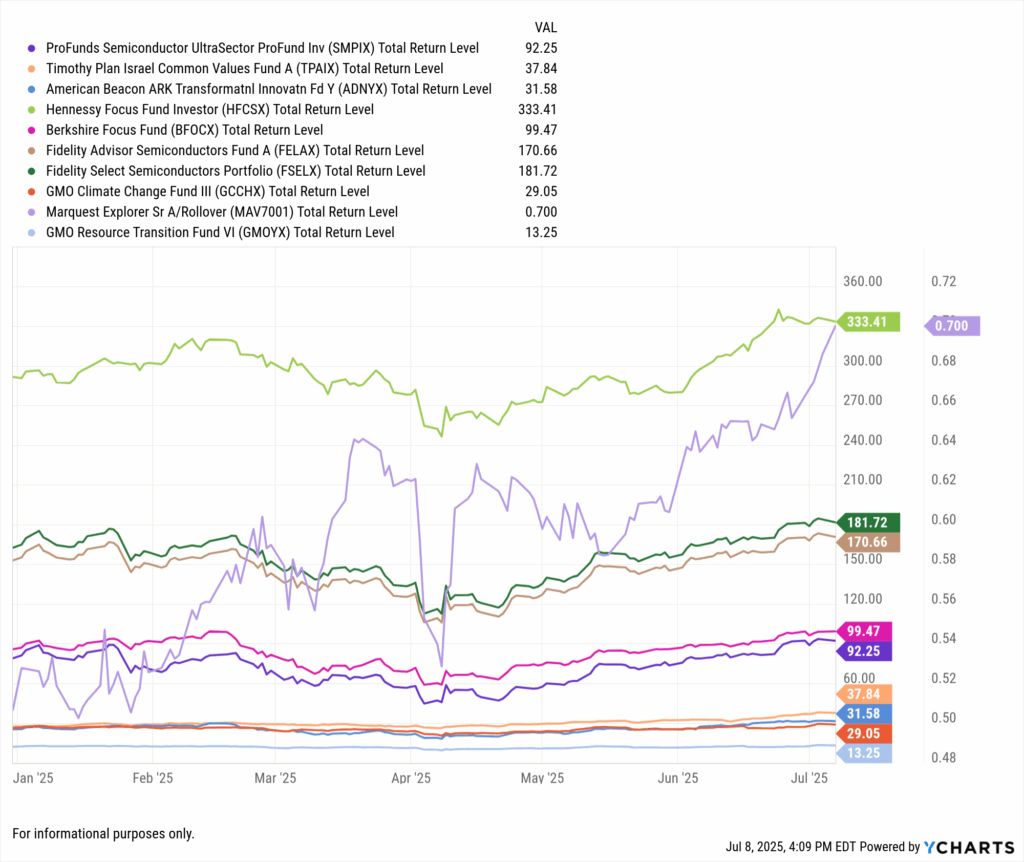
June’s mutual fund leaders highlighted a powerful combination of semiconductor strength, mid-cap resilience, and thematic conviction. While the broader equity market posted solid gains, several actively managed funds significantly outpaced their benchmarks, especially in tech-heavy or innovation-driven strategies.
| Symbol | Name | Category Name | Total AUM ($) | 1 Month Price Returns (Daily) |
|---|---|---|---|---|
| SMPIX | ProFunds Semiconductor UltraSector ProFund Inv | Trading--Leveraged Equity | 408.50M | 16.94% |
| TPAIX | Timothy Plan Israel Common Values Fund A | Miscellaneous Region | 147.63M | 15.69% |
| ADNYX | American Beacon ARK Transformatnl Innovatn Fd Y | Mid-Cap Growth | 203.25M | 15.06% |
| HFCSX | Hennessy Focus Fund Investor | Mid-Cap Blend | 545.26M | 12.10% |
| BFOCX | Berkshire Focus Fund | Technology | 286.89M | 11.67% |
| FELAX | Fidelity Advisor Semiconductors Fund A | Technology | 3.316B | 10.63% |
| FSELX | Fidelity Select Semiconductors Portfolio | Technology | 21.76B | 10.55% |
| GCCHX | GMO Climate Change Fund III | Global Small/Mid Stock | 442.24M | 10.01% |
| MAV7001 | Marquest Explorer Sr A/Rollover | Natural Resources Equity | 102.01M | 9.97% |
| GMOYX | GMO Resource Transition Fund VI | Natural Resources | 111.09M | 9.34% |
Semiconductors remained a dominant theme, with SMPIX, FELAX, and FSELX delivering impressive double-digit gains. As chip demand expands across AI, defense, and cloud computing, advisors are finding opportunity in both leveraged exposure and traditional tech mandates.
Q: Are semiconductor-focused mutual funds still attractive?
A: Yes, especially given persistent capex tailwinds. Mutual funds like FELAX and FSELX remain core active plays. Advisors can use YCharts’ Holdings data to analyze fund exposure to NVIDIA, Broadcom, and AI-linked growth names.
Beyond tech, the standout showing by TPAIX and ADNYX points to growing appetite for value-aligned and innovation-focused investing. Meanwhile, thematic strategies like GCCHX (climate) and GMOYX (resource transition) also showed relative strength in June.
YCharts Tools for Analysis:
- Fund Screener: Filter by category, AUM, and 1-month return to surface high-performing funds with advisor-appropriate liquidity.
Key Trends Behind June 2025’s Top Market Movers
Biotech and Health Care Surge
Five of June’s top 10 performing stocks came from the Health Care sector, led by Prime Medicine (PRME) with a staggering 124.9% monthly return. A wave of positive trial data, biotech M&A speculation, and institutional accumulation reignited investor interest across names like Cidara Therapeutics (CDTX) and UroGen Pharma (URGN). This underscores how targeted innovation and FDA optimism are fueling sector momentum.
Leverage and Crypto-Fueled ETF Gains
The top-performing ETFs in June, like Defiance Daily Target 2X Hood ETF (HOOX, +82.3%) and GraniteShares 2x Long COIN ETF (CONL, +88.8%), reflect a clear risk-on market environment. The standout performers were almost exclusively leveraged strategies tied to speculative themes, such as crypto equities (COIN), meme stocks (HOOD, SOFI), and high-beta tech. Even amidst volatility, flows into these instruments suggest traders are chasing momentum with conviction.
Mid-Cap Growth and Tech Fund Strength
Among mutual funds, active managers with focused exposure to tech and mid-cap growth stood out. Hennessy Focus Fund (HFCSX) surged 12.1%, while Fidelity Select Semiconductors Portfolio (FSELX) posted a 10.55% gain. Mutual funds tied to the semiconductor boom continued to benefit from AI infrastructure demand and resilient hardware spending.
Strategic Insights for Advisors
The Biotech Bounce
Advisors should take note of the outsized impact biotech and small/mid-cap health names had on June’s market leaders. These companies are prone to sharp moves based on trial results or policy shifts. Advisors can use YCharts’ Stock Screener to evaluate similar small-cap health names by sector, volatility, or earnings trend.
Q: What’s the risk of chasing biotech winners post-rally?
A: Biotech names can be volatile post-spike. Advisors should view large gains (like PRME’s +124.9%) as potential inflection points, not entry signals.
Leveraged Products Require Guardrails
While high-return ETFs like HOOX, CONL, and RKLBX are eye-catching, their volatility can be dangerous in client portfolios. Advisors should review risk-adjusted returns and stress test portfolios. Consider comparing these funds to standard alternatives using YCharts’ Comp Table tool.
Q: How do I educate clients on leverage risk without killing optimism?
A: Visuals help. Use YCharts’ Historical Return charts to show how leverage cuts both ways. Clients may be more receptive when they see past drawdowns relative to market corrections.
Semiconductor Momentum Continues
The best-performing mutual funds leaned heavily into chip exposure. ProFunds Semiconductor UltraSector (SMPIX), Fidelity Advisor Semiconductors (FELAX), and FSELX all rode the AI build-out wave. Use this as a conversation starter about AI infrastructure’s broader impact on portfolios, and whether current allocations already reflect the opportunity.
Q: Are mutual funds still competitive against ETFs in tech exposure?
A: Yes, especially when managers are nimble or sector-specific.
Positioning for the Next Rotation
June’s winners were heavily concentrated in tech, healthcare, and leverage-driven momentum trades. Advisors should review client exposures and rebalance if necessary, ensuring diversified exposure in anticipation of sector rotation or cooling sentiment.
Final Thoughts: Turning June’s Gains Into Forward-Looking Strategy
June 2025’s top market movers revealed a dynamic blend of health care leadership, leveraged optimism, and targeted innovation. From biotech breakouts like Prime Medicine to the dominance of leveraged crypto and semiconductor ETFs, advisors saw clear signals that investors are chasing growth, regardless of volatility.
But momentum isn’t a strategy on its own. The presence of high-risk names across all three segments (stocks, ETFs, and mutual funds) calls for deeper due diligence. Advisors should treat these results as a lens into current market sentiment and a prompt to review portfolio exposures for risk, sector overweights, and thematic alignment.
Rather than reacting to short-term outperformance, advisors can use YCharts to dig into the “why” behind these gains. Whether it’s comparing leveraged ETF flows, evaluating biotech balance sheets, or charting mutual fund allocations over time, the right tools make it easier to turn hindsight into insight, and insight into client-ready action.
Looking ahead to Q3, the winners of June may not hold the same ground. But they’ve provided a crucial clue about what the market values most right now: innovation, narrative strength, and bold positioning. It’s up to advisors to translate that into real, risk-aware portfolio strategy.
Whenever you’re ready, here’s how YCharts can help you:
1. Looking to Move On From Your Investment Research and Analytics Platform?
2. Want to test out YCharts for free?
Start a no-risk 7-Day Free Trial.
Disclaimer
©2025 YCharts, Inc. All Rights Reserved. YCharts, Inc. (“YCharts”) is not registered with the U.S. Securities and Exchange Commission (or with the securities regulatory authority or body of any state or any other jurisdiction) as an investment adviser, broker-dealer or in any other capacity, and does not purport to provide investment advice or make investment recommendations. This report has been generated through application of the analytical tools and data provided through ycharts.com and is intended solely to assist you or your investment or other adviser(s) in conducting investment research. You should not construe this report as an offer to buy or sell, as a solicitation of an offer to buy or sell, or as a recommendation to buy, sell, hold or trade, any security or other financial instrument. For further information regarding your use of this report, please go to: ycharts.com/about/disclosure
Next Article
Tariff Countdown: Copper and USD to JPY React to Trade UncertaintyRead More →