Trade War Winners: Who Benefits from Tariffs as Deadline Looms
Equity Sectors Shifting Under Tariffs (April–July 2025)
The U.S. stock market’s reaction to Tariff Day on April 2, 2025, was dramatic but temporary. Indices like the Nasdaq entered correction or bear territory amid fears of a slowdown. But by July, the S&P 500 reached new highs, driven by improving sentiment, resilient earnings, and strategic sector rotations, prompting advisors to reassess who benefits from tariffs in today’s evolving market landscape. With the next major tariff escalation deadline looming on August 1, 2025, when U.S. import duties on EU autos and electronics are set to double unless a deal is reached, the question of who benefits from tariffs has never been more urgent for portfolio positioning.
TL;DR: Who Benefits from Tariffs in 2025?
- Industrials emerged as key tariff-era winners, rebounding sharply as investors favored domestic manufacturing and reshoring trends.
- Semiconductors staged a volatile but strong comeback, aided by CHIPS Act support and demand from AI, despite early trade shocks.
- Agriculture faced mixed impacts—small farms struggled with exports, while large agribusinesses and input suppliers gained ground.
- Steel producers like Nucor outperformed thanks to import duties, while steel consumers saw margin compression.
- Commodities reacted unevenly: gold soared as a safe haven, oil remained volatile, and prices in tariff-sensitive sectors spiked.
- Inflation and trade data now reflect tariff-driven pressures, reshaping CPI, PPI, and GDP trends.
- Advisors must evaluate sector exposure, explain macro shifts, and use YCharts tools to identify both winners and hidden risks tied to tariffs.
Need a Tariff refresh? Take a look at the market’s assessment of the US’s 2025 Tariffs when first announced.
Table of Contents
Industrials Emerge as a Tariff-Era Winner
Industrials took a heavy hit in early April, with the Industrials Select Sector SPDR (XLI) falling nearly 9%. However, the sector rebounded strongly, finishing the first half of 2025 up nearly 12%. As of mid-July, XLI had posted a +5% YTD gain, outpacing the S&P 500, a sign of investor confidence in domestic production.
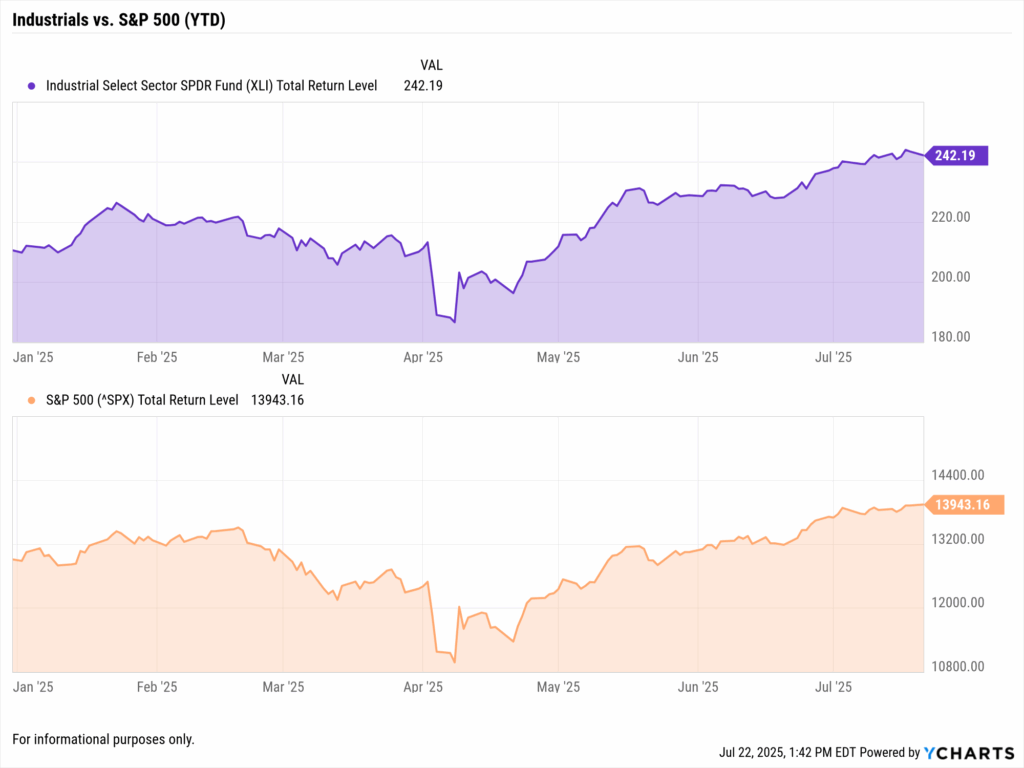
This outperformance stems from expectations of reshoring, protectionist advantages, and tariff-driven market share shifts. Advisors can leverage YCharts’ Sector Performance data to highlight how industrials have led the rebound since Tariff Day.
Q: Why have industrial stocks outperformed since tariffs began?
A: Tariffs raised import costs, giving domestic manufacturers a pricing edge. Investors rewarded firms less exposed to global supply chains. Tools like YCharts’ Sector Performance charts help advisors show how industrials rebounded post-tariff headlines, supporting discussions about overweighting domestic cyclicals.
Semiconductor Volatility Reveals Tech Sector Strength
Technology stocks, particularly semiconductors, were among the most sensitive to tariff shocks. The VanEck Semiconductor ETF (SMH) fell over 30% in early April. However, by July, SMH had rallied back with an 18% YTD gain, fueled by easing trade tensions and sustained demand from AI, data centers, and chips.
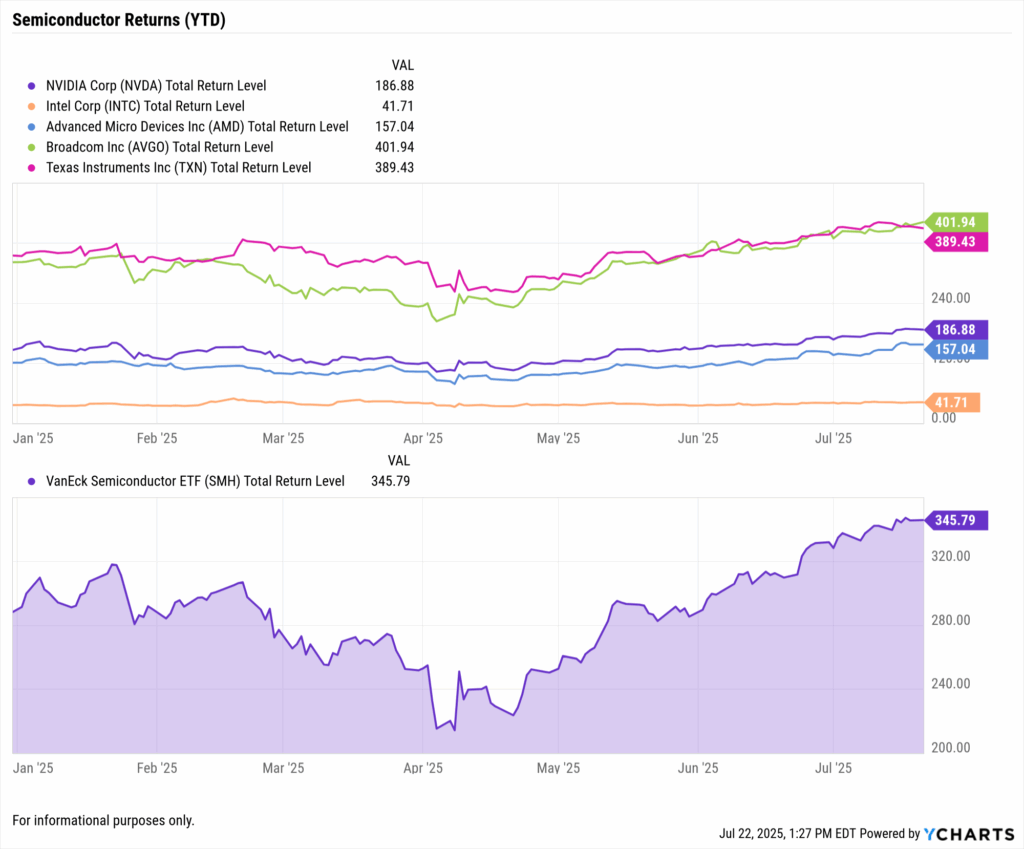
Notably, Nvidia and domestic chipmakers benefited from CHIPS Act funding and local production incentives. The broader Technology sector also rebounded, swinging from a -22% YTD low to +9% by midyear. Advisors should use YCharts comparison charts to illustrate the roundtrip recovery for clients skeptical of volatility.
Agriculture Faces Mixed Outcomes Under Trade Tensions
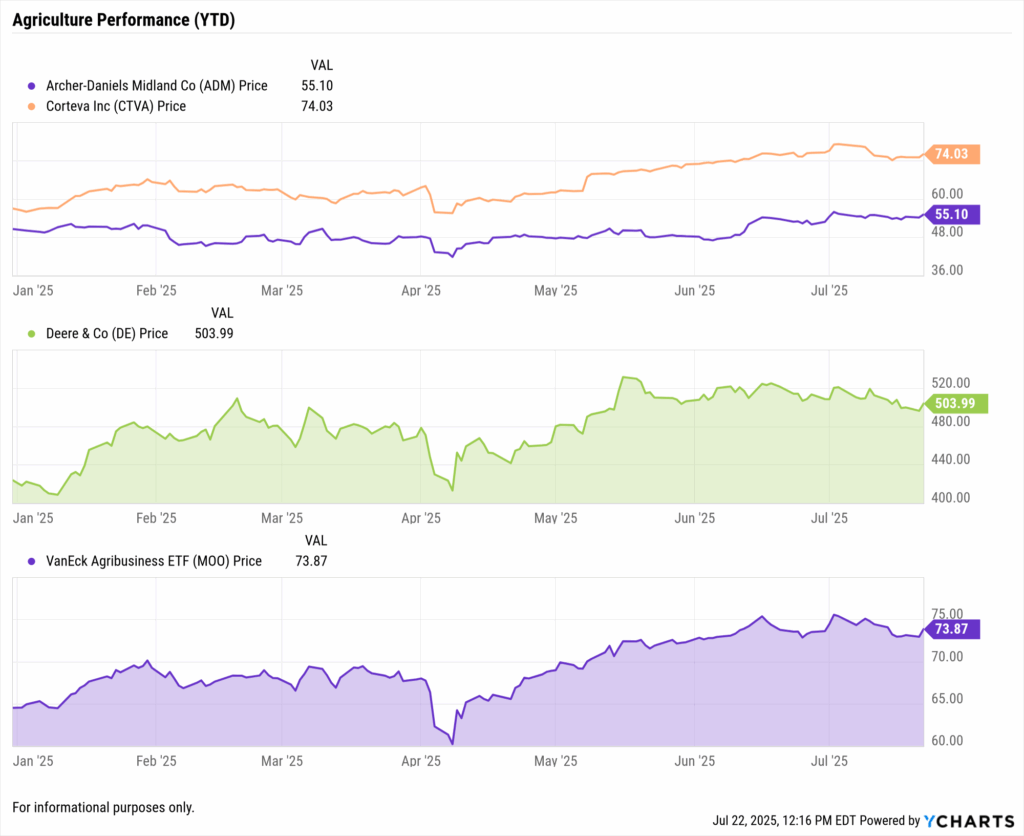
The agriculture sector tells a more complex story. Exports of U.S. soybeans, corn, and pork faced retaliatory tariffs from key trade partners. This weighed on farm equipment demand, with companies like Deere & Co (DE) seeing order delays and farmer sentiment eroding during Q2.
Yet large agribusinesses and commodity giants may emerge stronger over time. Nearly 70% of surveyed producers in May believed that tariffs would eventually strengthen American agriculture. Big farms (1000+ acres) have been more resilient, and domestic seed and fertilizer companies stand to gain as protectionist policies mature.
Q: Will agriculture benefit or suffer long-term from U.S. tariffs?
A: It depends. Small farms face immediate export losses, while large-scale producers may gain from reshoring and subsidy-backed expansion. Advisors should monitor fertilizer, seed, and logistics firms that could benefit if global competition fades. Use YCharts’ Stock Screener to surface these firms by industry and revenue trend.
Client Conversations: Sector Volatility and Strategic Rotation
Advisors should use the April-to-July volatility to spark client conversations about sector diversification. Tech’s rebound, industrials’ surge, and agriculture’s uneven performance all underscore the need to reassess positioning. Clients who overreacted in April may have missed out on double-digit rebounds by July.
Use the Best Performing ETFs of the last 10 years blog to reinforce themes of diversification, resilience, and identifying tariff beneficiaries in portfolios.

Commodity Price Turbulence in a Trade-Tension Economy
Volatility in commodity prices has intensified since the onset of U.S. tariff escalation. From metals to energy and gold, global markets have seen dramatic shifts. For advisors, understanding who benefits from tariffs requires tracking these asset class movements and helping clients adjust exposures across correlated sectors.
Steel Prices Surge: Domestic Producers Outperform
Import duties on industrial metals like steel and aluminum sparked price spikes in early Q2. Buyers rushed to secure inventory, driving up hot-rolled steel prices and boosting U.S. producers. Nucor (NUE) and Steel Dynamics (STLD) reported higher shipments and average selling prices on tariff-protected goods like sheet and plate steel.
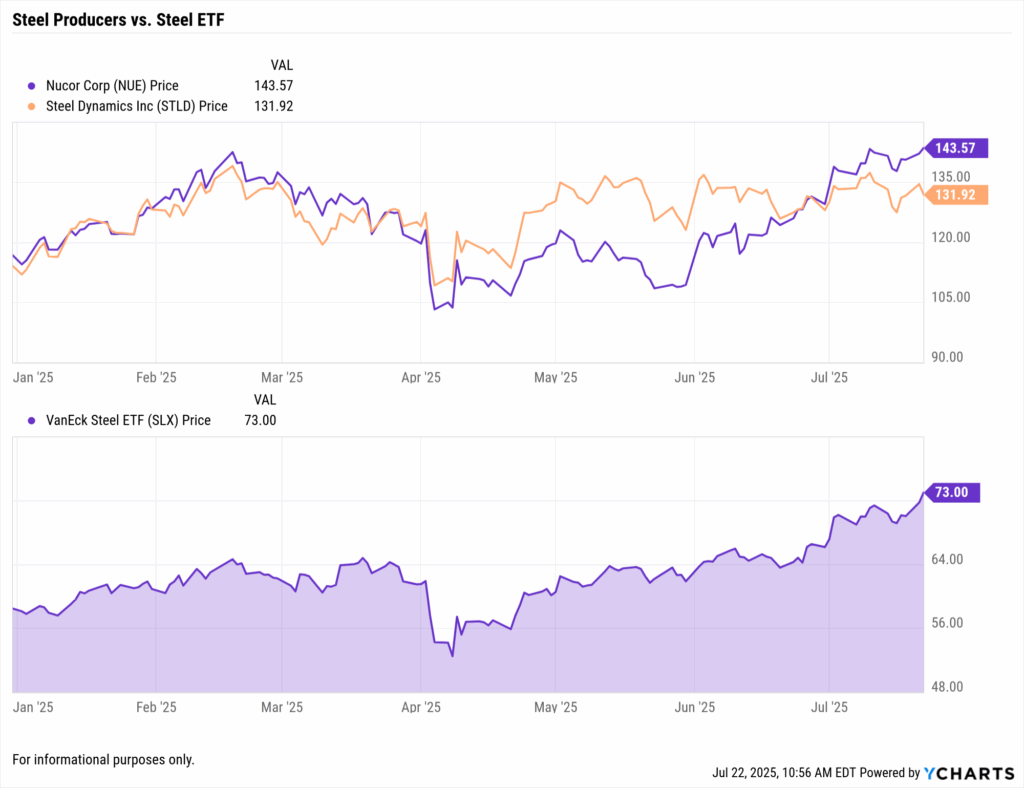
Nucor projected robust Q2 profits and saw its stock outperform the S&P 500 throughout Q2. Similarly, the VanEck Steel ETF (SLX) climbed ~20% year-to-date, reinforcing its status as a “trade war winner.” Advisors can illustrate this trend using YCharts’ fundamental charts and performance comparisons for NUE, STLD, and SLX.
Q: Do steel stocks benefit when tariffs rise?
A: Yes. Tariffs restrict cheap imports, giving U.S. producers pricing power. Domestic firms like Nucor gain margins as selling prices climb. Advisors can use YCharts to chart SLX vs. the S&P 500 or compare revenue trends across top steelmakers in tariff-sensitive sectors.
Tariffs Fuel Margin Pain for Steel Consumers
While steelmakers have gained, manufacturers that rely on imported steel and aluminum face cost pressures. With some tariffs rising to 50% on raw material inputs, heavy equipment, auto, and construction firms are seeing margin erosion. These firms have lagged behind tariff beneficiaries in equity performance.
Advisors should help clients distinguish between upstream winners and downstream losers. YCharts’ Holdings Overlap tool can be used to detect portfolios overexposed to industries bearing higher input costs, an especially useful exercise when reviewing client holdings in diversified funds or thematic ETFs.
Oil’s Tariff-Driven Whiplash: Supply vs. Demand
Oil markets reacted sharply to trade tensions. Brent crude dropped to $62/barrel in May, a four-year low, as tariffs signaled slower global growth. By July, crude rebounded to near $70, lifted by hopes of a deal and Saudi-led output tightening. Yet demand remains fragile.
The International Energy Agency (IEA) reported that Q2 global oil demand growth slowed to just 0.5 million barrels/day, half the Q1 pace. Countries like China, Japan, and Mexico posted year-over-year consumption declines, clear evidence that trade wars weigh on energy demand as production shifts and logistics falter.
Q: How should portfolios handle energy exposure during trade disputes?
A: Focus on balance. Energy demand softens in trade slowdowns, but supply shocks and policy relief rallies can spark spikes. A moderate allocation to diversified energy ETFs, coupled with YCharts oil price overlays, can help advisors show clients how energy reacts to policy uncertainty.
Gold Shines in Trade War Uncertainty
Gold has been one of the clearest beneficiaries of tariffs. With market volatility and inflation fears mounting, investors turned to safe havens. Gold prices surpassed $3,300/oz in May and reached new highs in June after tariff threats extended to EU imports and even Apple’s supply chain.
The SPDR Gold Shares ETF (GLD) surged to an all-time high. On May 23, following threats of 50% tariffs on electronics, GLD rose 2% in a single day, its best performance in six weeks. Silver and platinum also saw inflows, signaling broad strength in the precious metals complex.
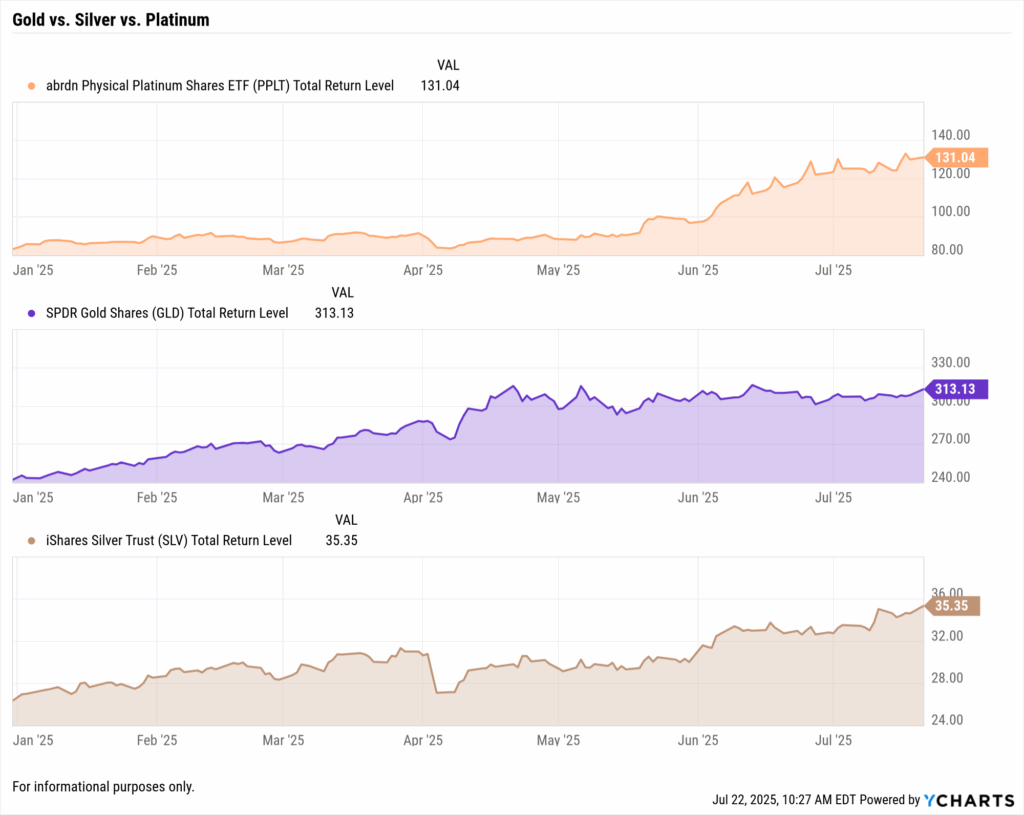
Advisors should use these dynamics to explain diversification. YCharts’ asset comparison tools make it easy to chart GLD, SLV, and PPLT alongside equities to demonstrate their value as non-correlated risk hedges during tariff-driven market dislocations.
Commodity Volatility Drives Tactical Adjustments
Tariffs have not only distorted supply chains—they’ve redrawn the landscape of commodity leadership. Steel and gold rallied, while oil remained trapped in a push-pull of geopolitical supply constraints and trade-dampened demand. Clients need to understand the forces behind these moves to stay grounded.
Use tools like the YCharts Dashboard and Commodity ETF Screener to identify price inflection points and help position client portfolios accordingly. These conversations are critical in showing how macro policy—like tariffs—can materially affect asset prices and return correlations.
Q: Can commodity trends signal broader macro shifts?
A: Absolutely. When steel outpaces tech, or gold breaks record highs, it reflects deeper economic transitions. Advisors using YCharts’ Macro Dashboard can connect commodity trends to Fed policy, inflation signals, or recession risk—enhancing strategic planning with clients.
Macroeconomic Indicators Flashing Tariff Impacts
As tariffs reshape global trade, their effects are increasingly visible in U.S. economic data. From inflation to manufacturing to trade balances, key indicators show how the tariff economy is influencing pricing power, earnings guidance, and macro sentiment. For advisors, these trends help explain who benefits from tariffs, and who bears the cost.
Inflation: Goods Prices Reflect Tariff Pressure
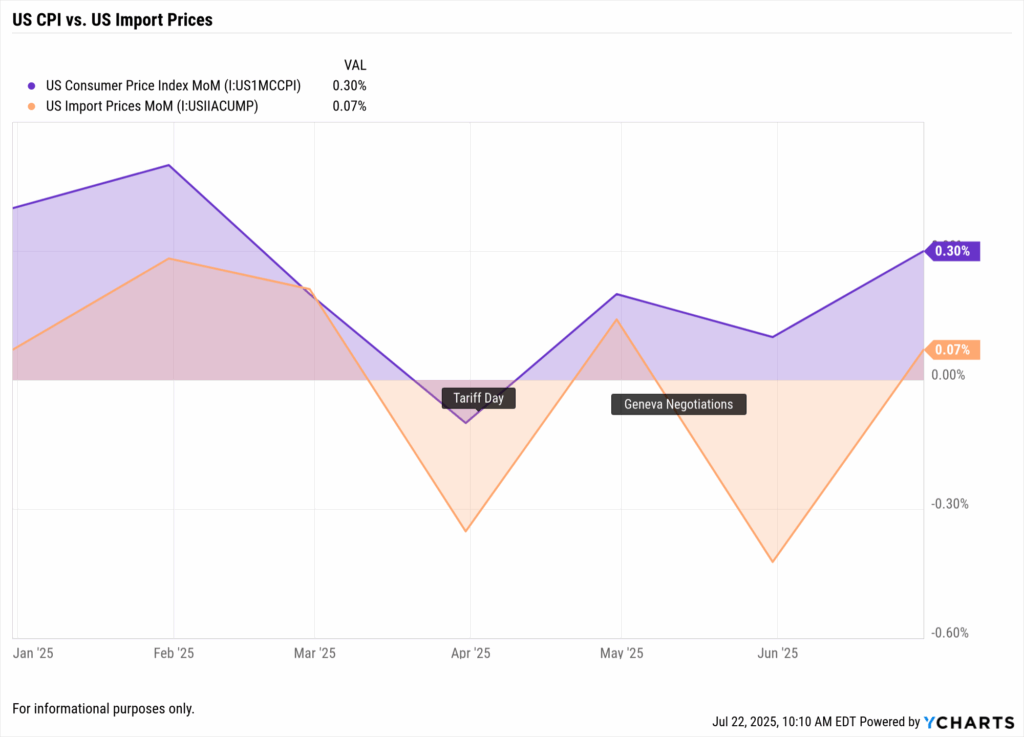
Inflation metrics now capture the pass-through effects of rising import duties. After moderating earlier in 2025, the Consumer Price Index (CPI) rose 0.3% in June (vs. 0.1% in May), lifting annual inflation to 2.7% from 2.4%. This acceleration reflects growing cost pressures on tariff-heavy goods like furniture, apparel, and electronics.
Goods categories highly exposed to tariffs are driving the increase. Window and floor coverings jumped 4.2% in June alone, the largest monthly increase ever. Apparel prices rose for the first time in months, while electronics and furnishings continued climbing, reversing a decade of disinflation in durable goods.
Core Inflation Drivers Are Shifting
While housing and shelter inflation cooled in Q2, tariff-linked goods prices picked up the slack, creating new upward pressure on “core” CPI. Advisors can use this narrative to contextualize inflation with clients, emphasizing that tariff impacts are not just geopolitical, they’re financial and personal, showing up on everyday bills.
Q: Are tariffs making inflation worse for consumers?
A: Yes. Import costs tied to tariffs are driving goods inflation. Advisors can point to CPI components, like household items and apparel, to show how tariff policy acts as a stealth tax. YCharts’ Fundamental Chart tool lets users track CPIYOY trends and visualize inflation’s shift from shelter to goods.
Manufacturing Data Signals Stress
Tariffs have strained U.S. manufacturers. The ISM Manufacturing PMI has remained below 50 since early Q2, signaling contraction. In May, the index hit 48.5, its lowest since 2023. Respondents cited tariff uncertainty as a core issue, noting erratic supplier logistics, delayed orders, and margin compression.
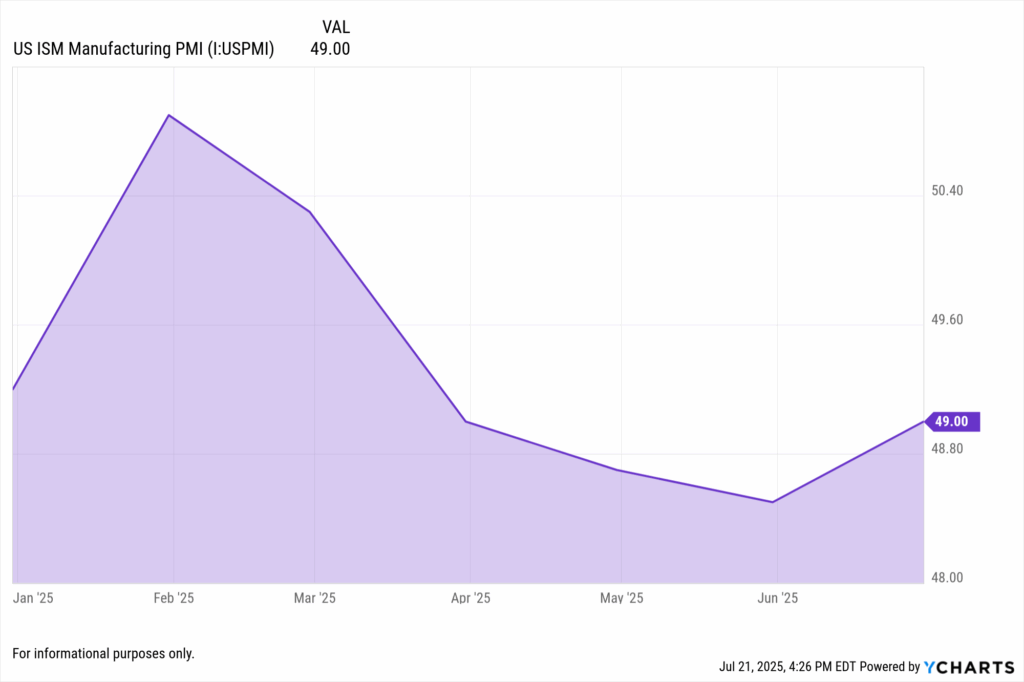
Delivery times are worsening. According to ISM data, supplier delays reached a three-year high as global sourcing disruptions intensified. Manufacturers dependent on foreign components reported cutting jobs, while others considered moving sourcing closer to home, highlighting tariff-driven supply chain reconfigurations.
Not All Manufacturing Is Hurting
Some industries are weathering the disruption. ISM noted growth in electrical equipment and defense-related manufacturing, where Buy American policies and public spending supported demand. Advisors should track sectors showing pricing power or backlog strength, potential bright spots amid wider industrial softness.
Use the Proposal Tool to demonstrate which companies are showing revenue resilience or operational margin strength despite tariff inputs.
Trade Balance Whiplash
Tariffs are distorting U.S. trade patterns. In March, importers raced to beat April deadlines, causing the goods trade deficit to surge. By April, however, imports plunged by $68 billion, narrowing the trade gap by 46% in one month. This extreme reversal reflects front-loaded inventory building followed by abrupt drop-offs.
Net trade subtracted heavily from Q1 GDP, with the U.S. economy contracting at –0.2% annualized. Advisors should caution clients that this volatility is unlikely to normalize soon. Every new tariff deadline risks sparking further swings in import volumes, export commitments, and inventory cycles.
Q: Is the trade deficit improving due to tariffs?
A: Not exactly. Tariffs caused temporary drops in imports, shrinking the deficit. But this may reverse again. Advisors should explain that trade data remains volatile, what looks like progress could be artificial timing distortions. Use YCharts to chart imports vs. exports over time to add clarity.
Export Headwinds and Retaliation Risks
Global retaliation is hurting U.S. exports. In spring, China and others slashed purchases of U.S. agricultural goods, causing soybean exports to hit multi-year lows. Advisors should monitor how persistent trade restrictions could impact farm-linked sectors, commodity exporters, and regional economies.
A useful client takeaway: while some U.S. producers benefit from tariffs, others face weakened demand abroad. Understanding who benefits from tariffs means assessing both domestic protection and foreign retaliation.
Producer Prices and Corporate Margins
The Producer Price Index (PPI) rose 0.3% for goods in June, even as service prices fell. Core wholesale inflation, excluding food and energy, climbed at a 3.8% annualized rate, its fastest pace since 2023. Tariff-impacted categories like electronics, furniture, and communication equipment saw outsized gains.
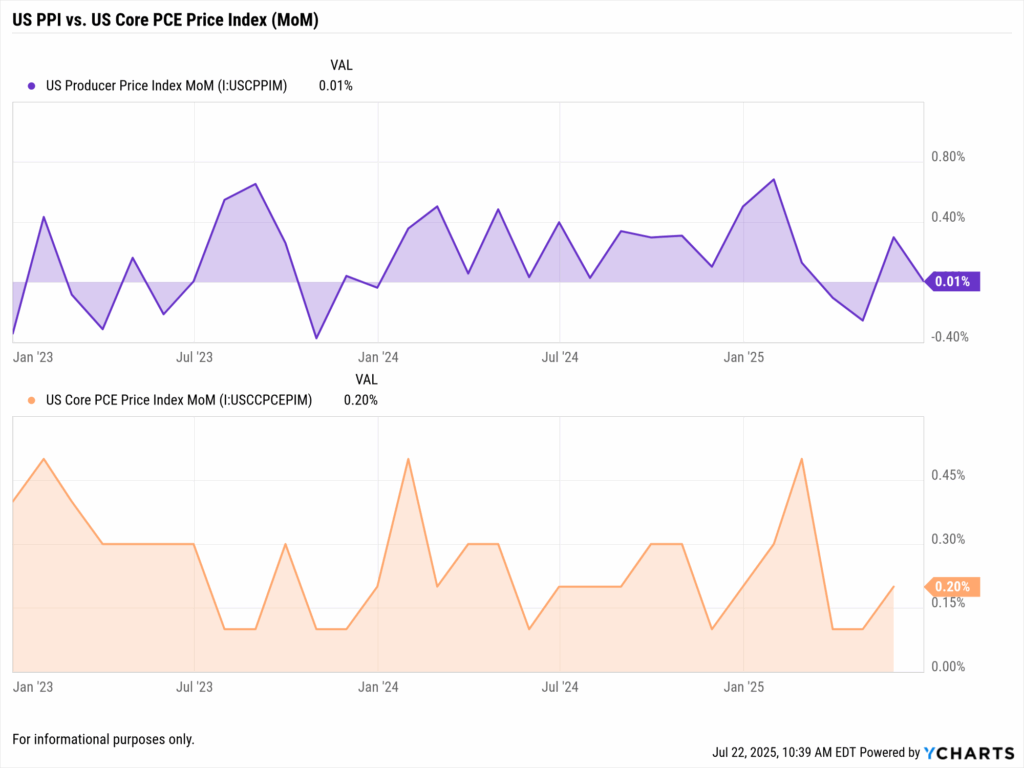
Some economists suggest producers are passing on costs more confidently under tariff protection, widening margins in select industries. However, price pass-throughs are uneven. Many contracts are locked short term, meaning tariff impacts will phase into earnings slowly over Q3 and Q4.
Tariffs Now Showing in Earnings Guidance
Analysts are beginning to revise Q3 forecasts upward for steel and defense manufacturers, anticipating stronger pricing power under sustained tariffs. Meanwhile, global-facing firms, autos, electronics, and machinery, have trimmed guidance, citing input cost risks and foreign demand weakness.
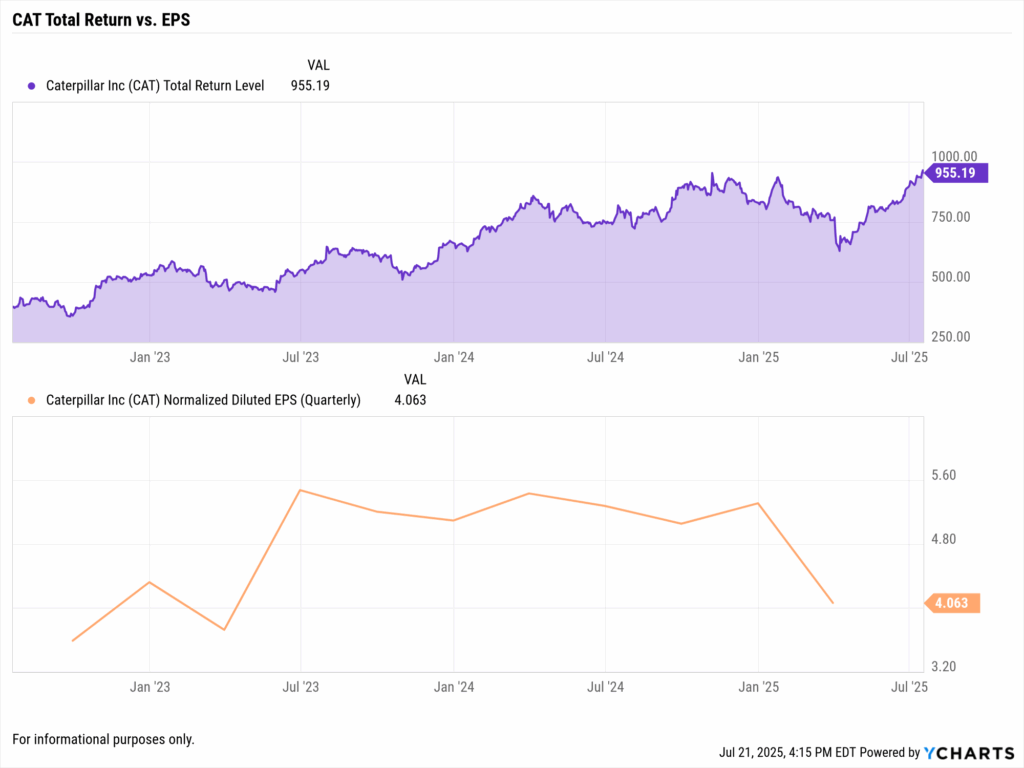
One standout example is Caterpillar (CAT), which warned of a $250–350 million Q2 tariff hit but still delivered revenue growth through pricing and operational efficiency. Advisors can spotlight such companies as examples of adaptive execution under policy pressure, and use YCharts’ earnings chart overlays to visualize forward EPS trends.
Q: Will tariff costs keep showing up in earnings this year?
A: Yes. The lag in input contracts means many firms will reflect Q2–Q3 tariff impacts later this year. Sectors like steel may benefit, while import-reliant industries will likely see thinner margins. Advisors can use YCharts’ earnings consensus tools to prepare clients for Q3 reporting season.
Notable Asset Performance Since Tariff Day: Tickers in Focus
Since Tariff Day on April 2nd, market leadership has reshuffled dramatically. Tariff policies created clear winners among domestic-focused firms and commodities, while exposing global manufacturers to cost and demand shocks. Below are five ETFs and two stocks advisors should watch when evaluating who benefits from tariffs, and who doesn’t.
XLI: Domestic Industrials Lead the Recovery
The Industrial Select Sector SPDR (XLI) was down nearly 10% during the April tariff panic. Input cost fears and global supply risks weighed on sentiment. But by mid-July, XLI rebounded to a +5% YTD return, outperforming the S&P 500 as investors rotated into domestic manufacturers with pricing power and reshoring tailwinds.
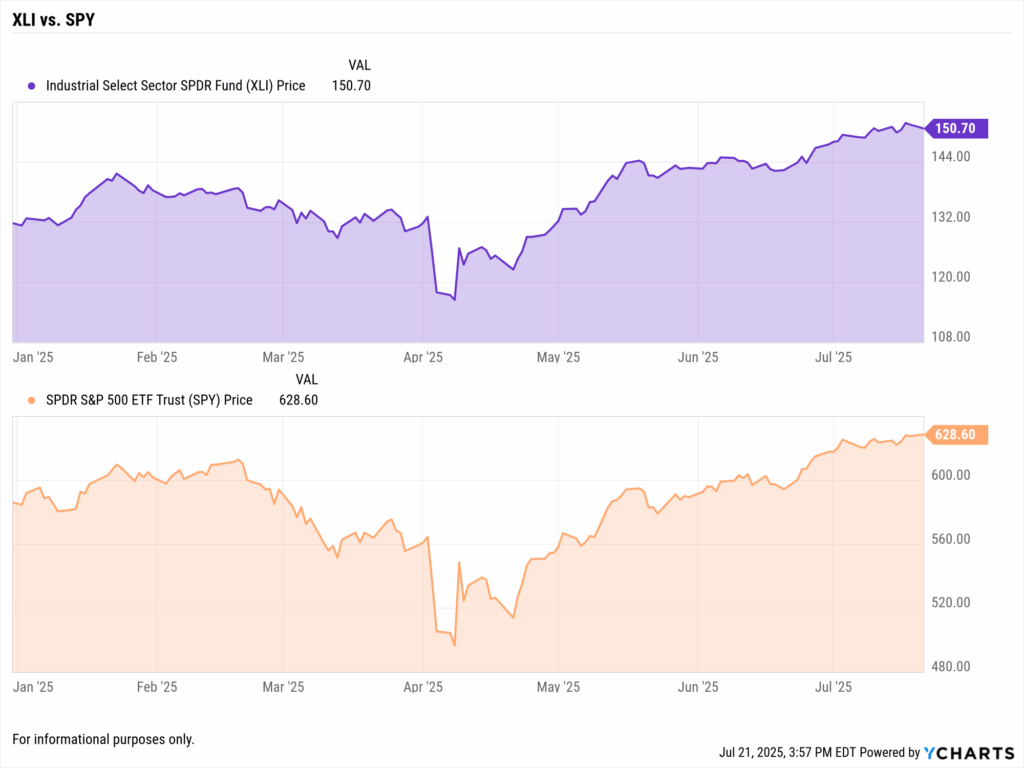
XLI’s strength comes from its composition, defense, infrastructure, and machinery names like Lockheed Martin and Eaton, companies aligned with U.S. policy priorities. Advisors can use YCharts’ sector comparison charts to show clients how select industrials are gaining relevance in the new trade regime.
SLX: Tariffs Fuel Steel Outperformance
The VanEck Vectors Steel ETF (SLX) has returned ~20% year-to-date, driven by import tariffs that inflated domestic steel prices. Holdings like Nucor (NUE) and U.S. Steel saw strong pricing power in Q2 and forecast continued earnings strength as tariffs rise to 50% in some categories.
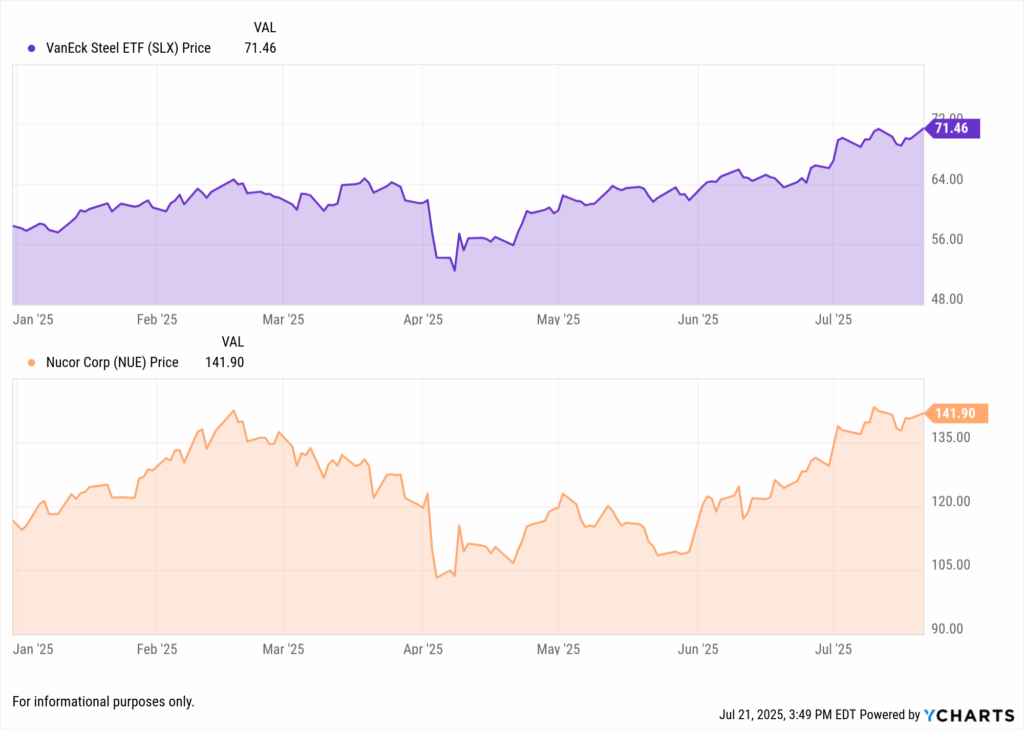
However, this outperformance comes with trade-offs. Industries consuming steel, such as autos and equipment, are under margin pressure. Advisors can use YCharts to compare SLX vs. industrial laggards, highlighting how commodity producers can benefit while consumers suffer in the same economy.
GLD: Gold Delivers as a Tariff-Era Hedge
The SPDR Gold Shares ETF (GLD) gained mid-teens in 2025 and hit an all-time high of ~$308 in June. Gold prices surged above $3,300/oz as investors sought safety during tariff escalation, particularly after late May’s renewed U.S.-EU tensions pushed GLD up over 2% in a single session.
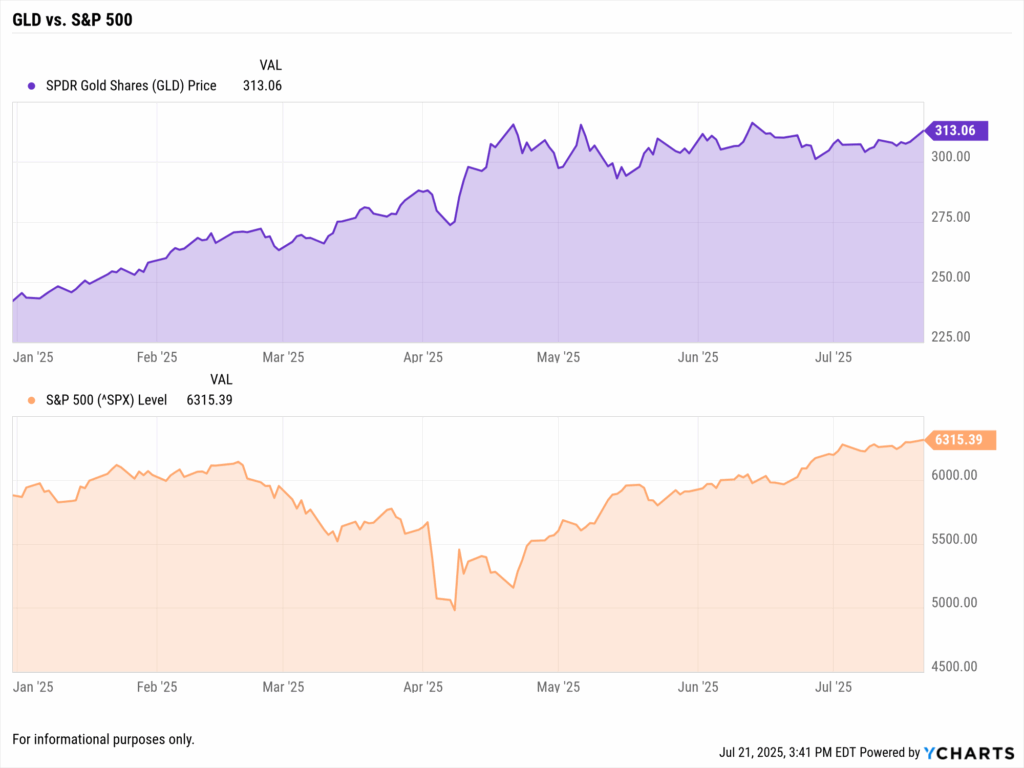
For clients wary of volatility, GLD’s consistent strength provides a powerful case for non-correlated assets. Advisors should reference GLD’s chart alongside the S&P 500 on YCharts to show how gold steadily appreciated through equity drawdowns, a key hedge in tariff-inflated environments.
SMH: Semiconductor Resilience and Rebound
The VanEck Semiconductor ETF (SMH) embodies the tech sector’s volatility. After falling ~12% in Q1, SMH recovered with an 18% YTD gain by July as U.S.-China tensions eased and chip demand stayed strong. Top holdings like NVIDIA and Taiwan Semi rebounded sharply, supported by AI tailwinds and supply chain re-routing.
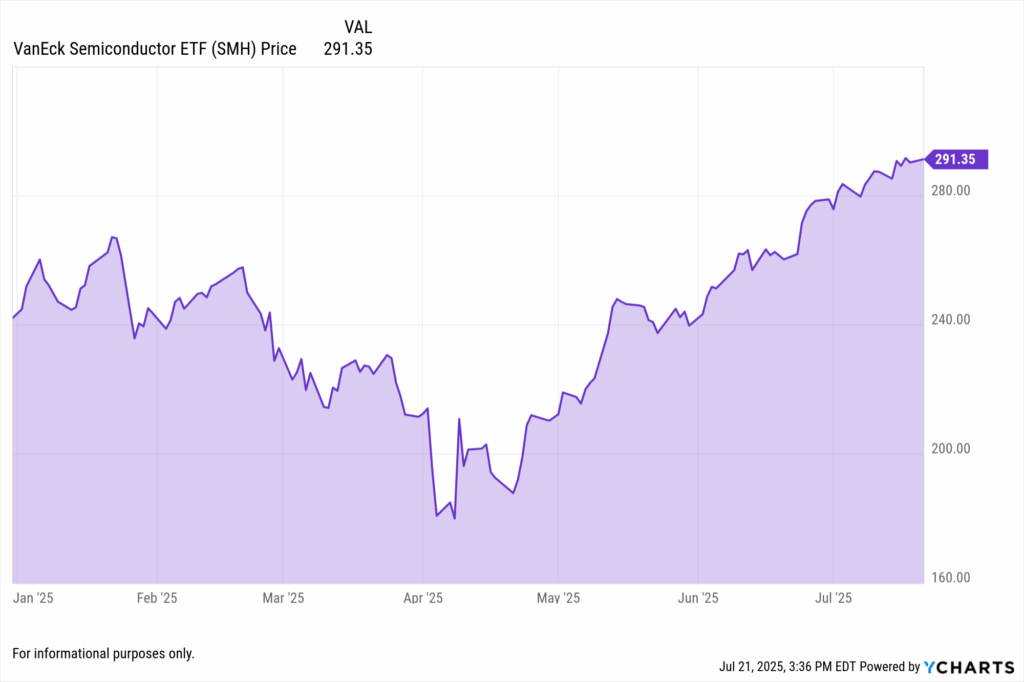
Many chipmakers moved production to Vietnam or qualified for U.S. subsidies. Advisors should use SMH to explain sector adaptability and reinforce long-term investment discipline. What looked like a Q1 loser has now become a core “winner” in tariff-adjusted portfolios.
Q: Can today’s trade-war laggards become tomorrow’s outperformers?
A: Yes. Sectors like semiconductors show how market sentiment can swing. Advisors can use YCharts to chart Q1 drawdowns vs. Q2 recoveries for SMH or NVDA, helping clients stay focused on fundamentals, not fear.
NUE vs CAT: Company-Level Narratives
Nucor (NUE) stands out as a tariff beneficiary. The largest U.S. steelmaker has outperformed the market thanks to rising selling prices and increased domestic demand. NUE’s Q2 earnings forecast reflects the pricing cushion afforded by tariffs on foreign steel.
Caterpillar (CAT) offers the flip side. As a global machinery leader, CAT faced ~$300M in Q2 tariff-related input costs. Yet, the company adapted, raising prices, reshoring components, and preserving margins. Its stock has stabilized post-April, proving that operational flexibility can offset macro risks.
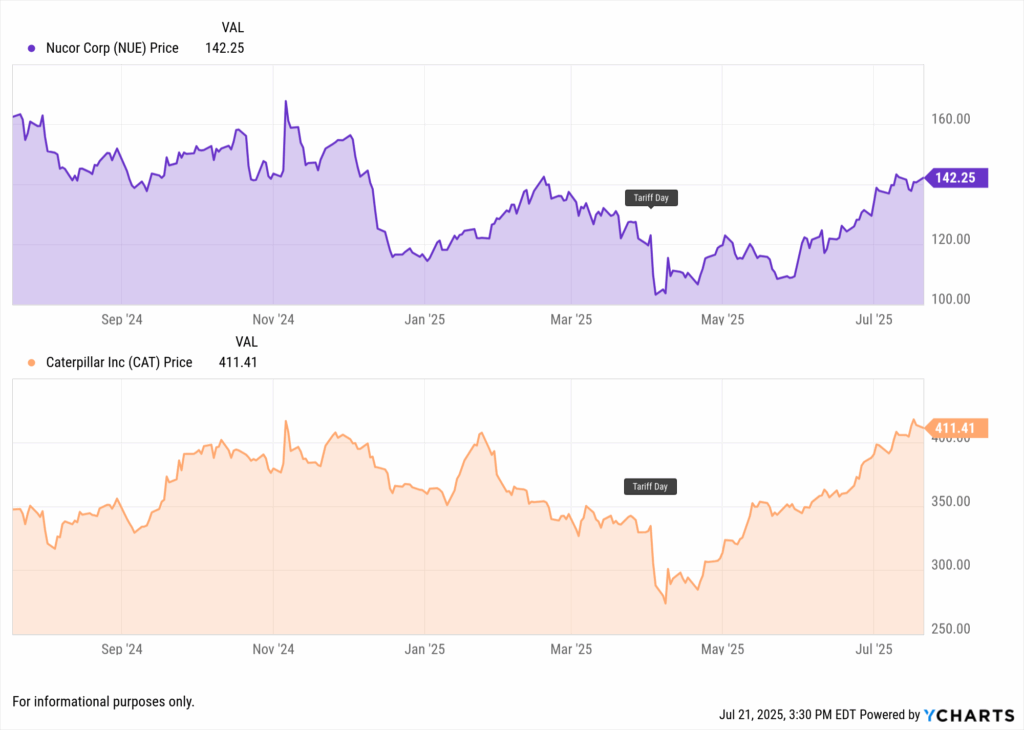
Advisors should use a side-by-side YCharts comparison of NUE and CAT to help clients understand how firms with very different profiles respond to the same policy pressures.
Strategic Implications for Advisors
Since Tariff Day on April 2nd, a clear divergence has emerged in the market: companies with domestic supply chains, tariff sheltering, or inflation-hedging potential have surged, while global-reliant exporters have struggled. The looming August 1 deadline for U.S.-EU tariffs may widen these gaps, especially in industrials, agriculture, and consumer goods.
This dynamic is no longer abstract. Advisors must understand who benefits from tariffs at the sector, fund, and even stock level. It’s not just about performance, it’s about volatility control, income durability, and client communication. Protectionist tailwinds can create durable alpha, but they can also destabilize clients overexposed to tariff-sensitive imports or foreign buyers.
Tools like the YCharts Holdings Overlap help surface hidden concentration in funds, especially when multiple ETFs hold the same few domestic manufacturing names now surging under tariff protection. Similarly, the Dashboard allows advisors to overlay CPI, PMI, and commodity inputs to show how tariffs impact client cost of living and portfolio drivers in real time.
Tariff dynamics also raise key portfolio planning questions: Are sector weights aligned with policy reality? Are inflation-linked assets (like gold or TIPS) playing a larger role? Do client proposals clearly articulate macro-driven risk exposure? YCharts enables visual answers to these questions through earnings, inflation, and asset class comparison charts.
Q: What’s the advisor’s role in a tariff-driven market?
A: Translating volatility into opportunity. Advisors must interpret shifting policy, evaluate sector beneficiaries, and communicate that strategy using data. YCharts charts, screeners, and proposal tools support this work, turning uncertainty into clarity and tactical adjustments into client confidence.
The bigger picture? The 2025 tariff economy has redefined the relationship between policy and performance. Advisors who proactively identify the winners, monitor macro shifts, and adjust exposures accordingly will not only protect client portfolios, they’ll position them to lead.
Whenever you’re ready, here’s how YCharts can help you:
1. Looking to Move On From Your Investment Research and Analytics Platform?
2. Want to test out YCharts for free?
Start a no-risk 7-Day Free Trial.
Disclaimer
©2025 YCharts, Inc. All Rights Reserved. YCharts, Inc. (“YCharts”) is not registered with the U.S. Securities and Exchange Commission (or with the securities regulatory authority or body of any state or any other jurisdiction) as an investment adviser, broker-dealer or in any other capacity, and does not purport to provide investment advice or make investment recommendations. This report has been generated through application of the analytical tools and data provided through ycharts.com and is intended solely to assist you or your investment or other adviser(s) in conducting investment research. You should not construe this report as an offer to buy or sell, as a solicitation of an offer to buy or sell, or as a recommendation to buy, sell, hold or trade, any security or other financial instrument. For further information regarding your use of this report, please go to: ycharts.com/about/disclosure
Next Article
Structure Prospect Meetings to Improve Engagement and Close More ClientsRead More →