The Best Performing Dividend Stocks over the Last 25 Years
Updated as of: April 12, 2026
Dividend income composes a major part of equity investing over the long run; 34% of all stocks listed on major US exchanges pay a dividend, making for plenty of options to take advantage of periodic earnings distributions.
With more than one-third of U.S. stock market total returns since 1930 having been produced by dividends, it’s no surprise that a common investment objective is dividend income.
To help advisors make more informed decisions about which stocks to consider for client portfolios, this article contains the best-performing dividend stocks from the last year all the way back to the past decade, with data routinely updated by YCharts.
To create this list, we used the YCharts Stock Screener to find the best-performing dividend yielding stocks on the S&P High Yield Dividend Aristocrats Index over a YTD, 1-year, 3-year, 5-year, and 10-year basis.
Table of Contents
Looking for lists of the best-performing dividend ETFs? Check out our Best Performing Dividend ETFs analysis here.

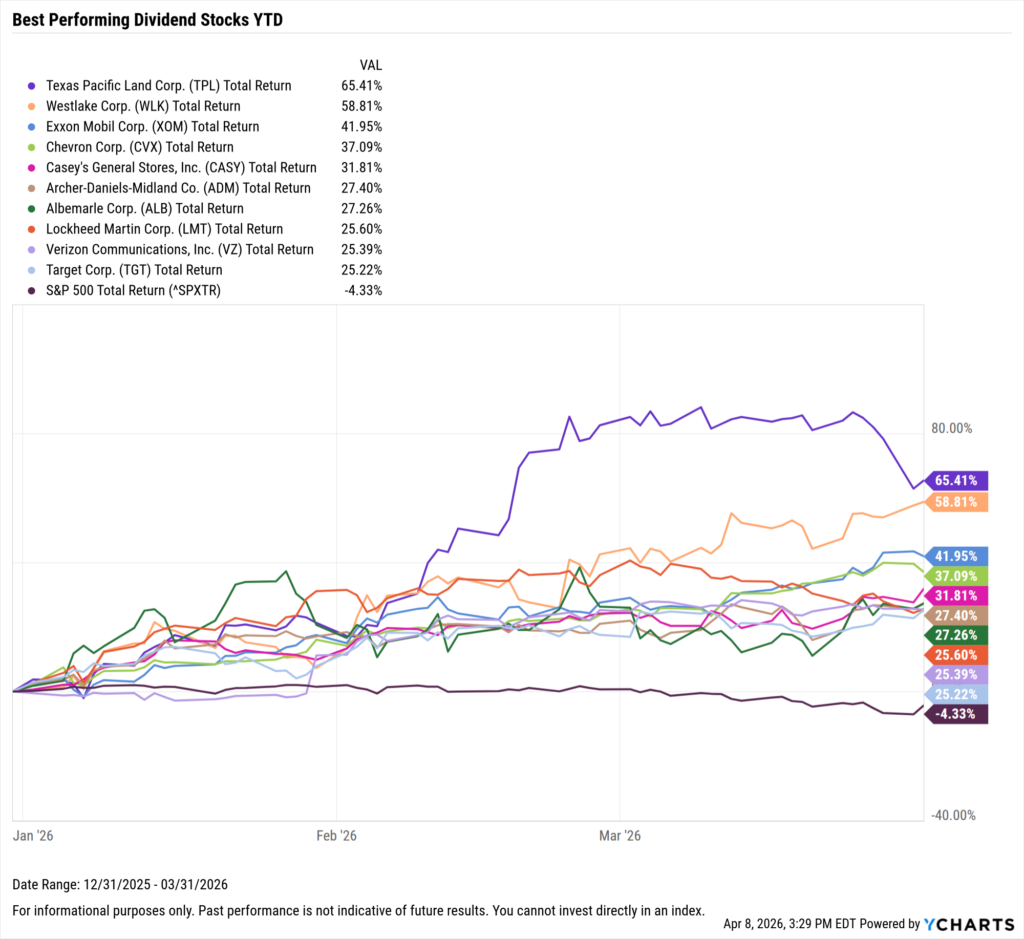
Best Performing Dividend Stocks YTD
These are the top-performing dividend stocks YTD, as of March 31, 2026.
| Symbol | Name | YTD Price Returns | YTD Total Returns | Dividend Yield | Dividend | Market Cap ($M) |
|---|---|---|---|---|---|---|
| TPL | Texas Pacific Land Corp. | 65.23% | 65.41% | 0.49% | $0.600 | $31,007.71 |
| WLK | Westlake Corp. | 57.99% | 58.81% | 1.71% | $0.530 | $15,782.85 |
| XOM | Exxon Mobil Corp. | 40.98% | 41.95% | 2.46% | $1.030 | $682,974.21 |
| CVX | Chevron Corp. | 35.75% | 37.09% | 3.43% | $1.780 | $399,294.58 |
| CASY | Casey's General Stores, Inc. | 31.69% | 31.81% | 0.30% | $0.570 | $27,416.93 |
| ADM | Archer-Daniels-Midland Co. | 26.44% | 27.40% | 2.84% | $0.520 | $34,718.71 |
| ALB | Albemarle Corp. | 26.93% | 27.26% | 0.93% | $0.405 | $20,456.91 |
| LMT | Lockheed Martin Corp. | 24.96% | 25.60% | 2.15% | $3.450 | $144,421.34 |
| VZ | Verizon Communications, Inc. | 23.25% | 25.39% | 5.63% | $0.708 | $205,063.81 |
| TGT | Target Corp. | 23.99% | 25.22% | 3.80% | $1.140 | $54,125.30 |
Start a Free Trial to See Full Rankings | View & Modify in Stock Screener
Download Visual | Modify in YCharts
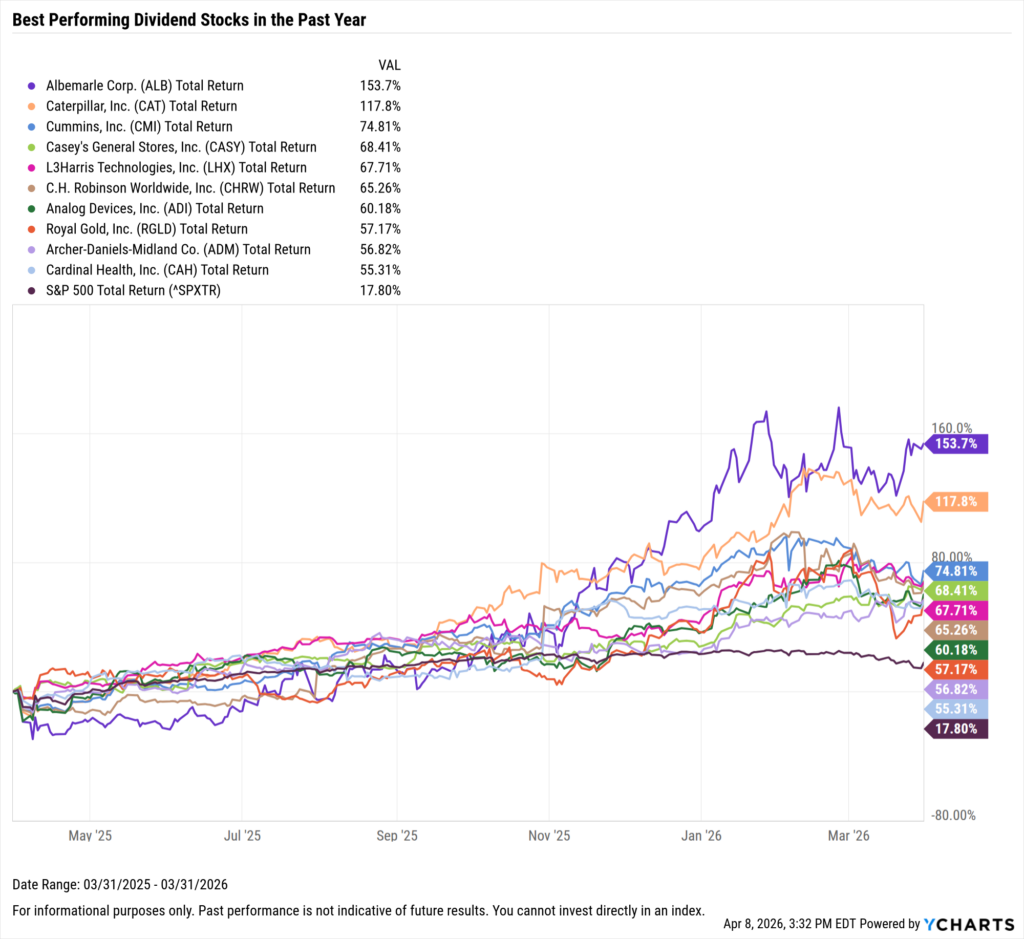
Best Performing Dividend Stocks in the Last Year
These are the top-performing dividend stocks over the past year, as of March 31, 2026.
| Symbol | Name | 1 Year Price Return | 1 Year Total Return | Dividend Yield | Dividend | Market Cap ($M) |
|---|---|---|---|---|---|---|
| ALB | Albemarle Corp. | 149.28% | 153.70% | 0.93% | $0.405 | $20,456.91 |
| CAT | Caterpillar, Inc. | 114.82% | 117.81% | 0.82% | $1.510 | $337,072.73 |
| CMI | Cummins, Inc. | 71.65% | 74.81% | 1.40% | $2.000 | $76,927.79 |
| CASY | Casey's General Stores, Inc. | 67.69% | 68.41% | 0.30% | $0.570 | $27,416.93 |
| LHX | L3Harris Technologies, Inc. | 64.90% | 67.71% | 1.37% | $1.250 | $66,118.81 |
| CHRW | C.H. Robinson Worldwide, Inc. | 62.18% | 65.26% | 1.51% | $0.630 | $19,702.91 |
| ADI | Analog Devices, Inc. | 57.75% | 60.18% | 1.24% | $1.100 | $159,842.94 |
| RGLD | Royal Gold, Inc. | 55.64% | 57.17% | 0.71% | $0.475 | $22,129.43 |
| ADM | Archer-Daniels-Midland Co. | 51.41% | 56.82% | 2.84% | $0.520 | $34,718.71 |
| CAH | Cardinal Health, Inc. | 53.38% | 55.31% | 0.96% | $0.511 | $50,068.19 |
Start a Free Trial to See Full Rankings | View & Modify in Stock Screener
Download Visual | Modify in YCharts
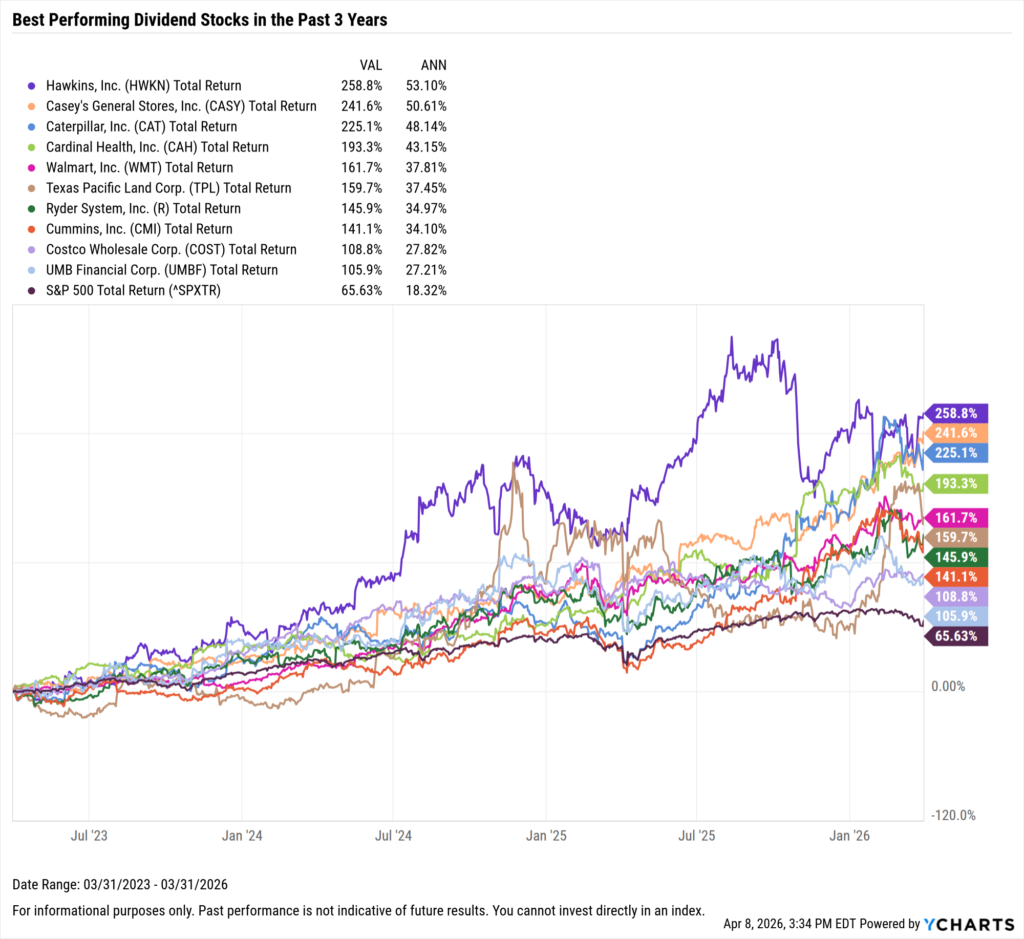
Best Performing Dividend Stocks in the Last 3 Years
These are the top-performing dividend stocks on an annualized basis between April 1st, 2023 and March 31, 2026.
| Symbol | Name | 3 Year Price Return | 3 Year Total Return | Dividend Yield | Dividend | Market Cap ($M) |
|---|---|---|---|---|---|---|
| HWKN | Hawkins, Inc. | 250.85% | 258.83% | 0.51% | $0.190 | $3,065.29 |
| CASY | Casey's General Stores, Inc. | 236.26% | 241.64% | 0.30% | $0.570 | $27,416.93 |
| CAT | Caterpillar, Inc. | 209.59% | 225.07% | 0.82% | $1.510 | $337,072.73 |
| CAH | Cardinal Health, Inc. | 179.88% | 193.34% | 0.96% | $0.511 | $50,068.19 |
| WMT | Walmart, Inc. | 152.86% | 161.73% | 0.78% | $0.248 | $976,539.58 |
| TPL | Texas Pacific Land Corp. | 151.09% | 159.68% | 0.49% | $0.600 | $31,007.71 |
| R | Ryder System, Inc. | 129.39% | 145.88% | 1.71% | $0.910 | $8,175.62 |
| CMI | Cummins, Inc. | 125.23% | 141.13% | 1.40% | $2.000 | $76,927.79 |
| COST | Costco Wholesale Corp. | 100.54% | 108.82% | 0.51% | $1.300 | $449,513.15 |
| UMBF | UMB Financial Corp. | 95.41% | 105.86% | 1.43% | $0.430 | $8,851.51 |
Start a Free Trial to See Full Rankings | View & Modify in Stock Screener
Download Visual | Modify in YCharts
Best Performing Dividend Stocks in the Last 5 Years
These are the top-performing dividend stocks on an annualized basis between April 1, 2021 and March 31, 2026.
| Symbol | Name | 5 Year Price Return | 5 Year Total Return | Dividend Yield | Dividend | Market Cap ($M) |
|---|---|---|---|---|---|---|
| HWKN | Hawkins, Inc. | 358.23% | 381.87% | 0.51% | $0.190 | $3,065.29 |
| CAH | Cardinal Health, Inc. | 247.84% | 289.58% | 0.96% | $0.511 | $50,068.19 |
| XOM | Exxon Mobil Corp. | 203.89% | 268.18% | 2.46% | $1.030 | $682,974.21 |
| CASY | Casey's General Stores, Inc. | 236.68% | 246.81% | 0.30% | $0.570 | $27,416.93 |
| CAT | Caterpillar, Inc. | 205.54% | 235.05% | 0.82% | $1.510 | $337,072.73 |
| R | Ryder System, Inc. | 170.60% | 207.03% | 1.71% | $0.910 | $8,175.62 |
| COST | Costco Wholesale Corp. | 182.69% | 198.48% | 0.51% | $1.300 | $449,513.15 |
| WMT | Walmart, Inc. | 174.49% | 193.14% | 0.78% | $0.248 | $976,539.58 |
| GWW | W.W. Grainger, Inc. | 172.07% | 186.74% | 0.82% | $2.260 | $52,496.39 |
| TPL | Texas Pacific Land Corp. | 168.72% | 185.30% | 0.49% | $0.600 | $31,007.71 |
Start a Free Trial to See Full Rankings | View & Modify in Stock Screener

Download Visual | Modify in YCharts
Best Performing Dividend Stocks in the Last 10 Years
These are the top-performing dividend stocks on an annualized basis between April 1, 2016 and March 31, 2026.
| Symbol | Name | 10 Year Price Return | 10 Year Total Return | Dividend Yield | Dividend | Market Cap ($M) |
|---|---|---|---|---|---|---|
| TPL | Texas Pacific Land Corp. | 2835.22% | 3170.39% | 0.49% | $0.600 | $31,007.71 |
| CAT | Caterpillar, Inc. | 825.61% | 1070.19% | 0.82% | $1.510 | $337,072.73 |
| HWKN | Hawkins, Inc. | 751.21% | 889.53% | 0.51% | $0.190 | $3,065.29 |
| CTAS | Cintas Corp. | 653.32% | 735.18% | 1.02% | $0.450 | $68,117.43 |
| MSFT | Microsoft Corp. | 570.23% | 661.82% | 0.93% | $0.910 | $2,764,487.46 |
| COST | Costco Wholesale Corp. | 532.33% | 649.85% | 0.51% | $1.300 | $449,513.15 |
| CASY | Casey's General Stores, Inc. | 542.31% | 590.50% | 0.30% | $0.570 | $27,416.93 |
| ADI | Analog Devices, Inc. | 437.49% | 552.09% | 1.24% | $1.100 | $159,842.94 |
| WMT | Walmart, Inc. | 444.37% | 549.65% | 0.78% | $0.248 | $976,539.58 |
| CMI | Cummins, Inc. | 389.38% | 532.42% | 1.40% | $2.000 | $76,927.79 |
Start a Free Trial to See Full Rankings | View & Modify in Stock Screener

Download Visual | Modify in YCharts
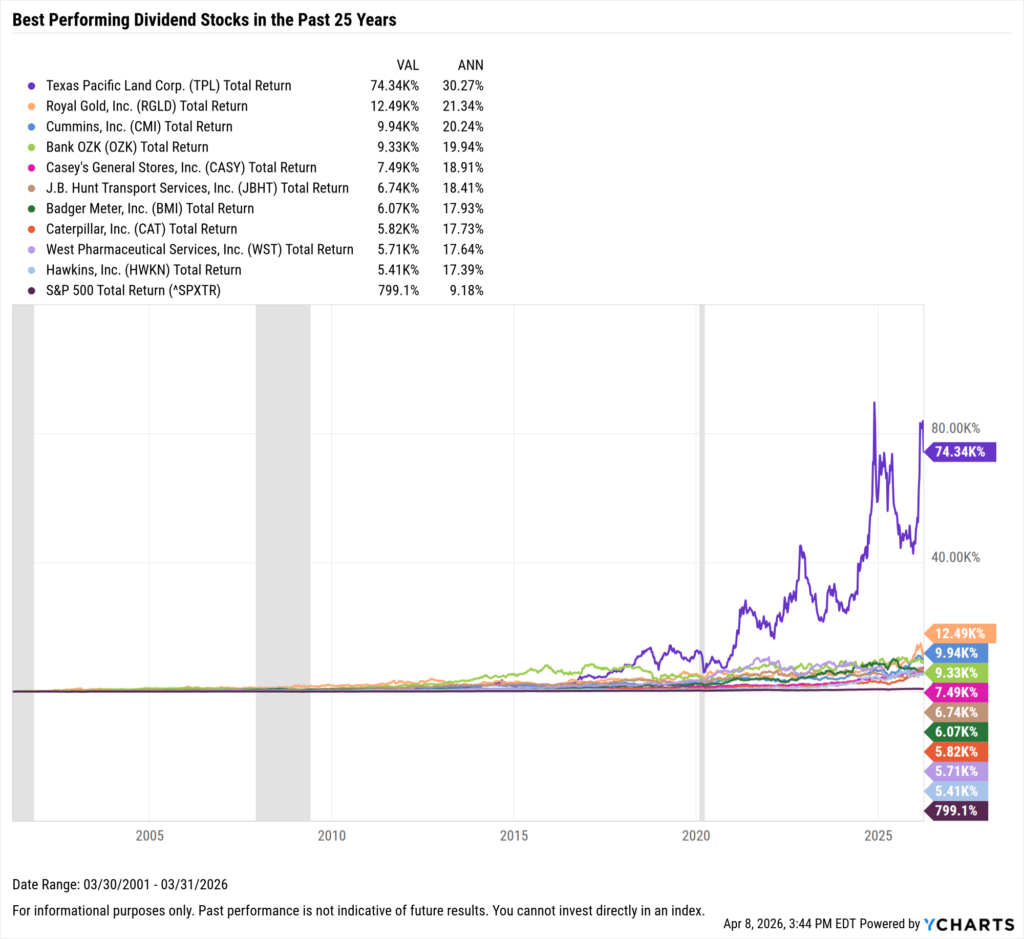
Best Performing Dividend Stocks in the Last 25 Years
These are the top-performing dividend stocks on an annualized basis between April 1, 2001 and March 31, 2026.
| Symbol | Name | 25 Year Price Return | 25 Year Total Return | Dividend Yield | Dividend | Market Cap ($M) |
|---|---|---|---|---|---|---|
| TPL | Texas Pacific Land Corp. | 59220.00% | 74336.13% | 0.49% | $0.600 | $31,020.81 |
| RGLD | Royal Gold, Inc. | 9576.43% | 12485.86% | 0.69% | $0.475 | $22,670.70 |
| CMI | Cummins, Inc. | 5632.77% | 9942.11% | 1.32% | $2.000 | $82,033.00 |
| OZK | Bank OZK | 5387.59% | 9327.78% | 3.74% | $0.470 | $5,249.07 |
| CASY | Casey's General Stores, Inc. | 5995.98% | 7489.64% | 0.29% | $0.570 | $27,863.39 |
| JBHT | J.B. Hunt Transport Services, Inc. | 5322.90% | 6740.01% | 0.79% | $0.450 | $21,250.92 |
| BMI | Badger Meter, Inc. | 4176.49% | 6074.72% | 1.01% | $0.400 | $4,465.66 |
| CAT | Caterpillar, Inc. | 3092.70% | 5819.99% | 0.77% | $1.510 | $358,006.01 |
| WST | West Pharmaceutical Services, Inc. | 4193.62% | 5713.72% | 0.32% | $0.220 | $19,147.76 |
| HWKN | Hawkins, Inc. | 3090.03% | 5412.19% | 0.51% | $0.190 | $3,078.25 |
Start a Free Trial to See Full Rankings | View & Modify in Stock Screener
Download Visual | Modify in YCharts
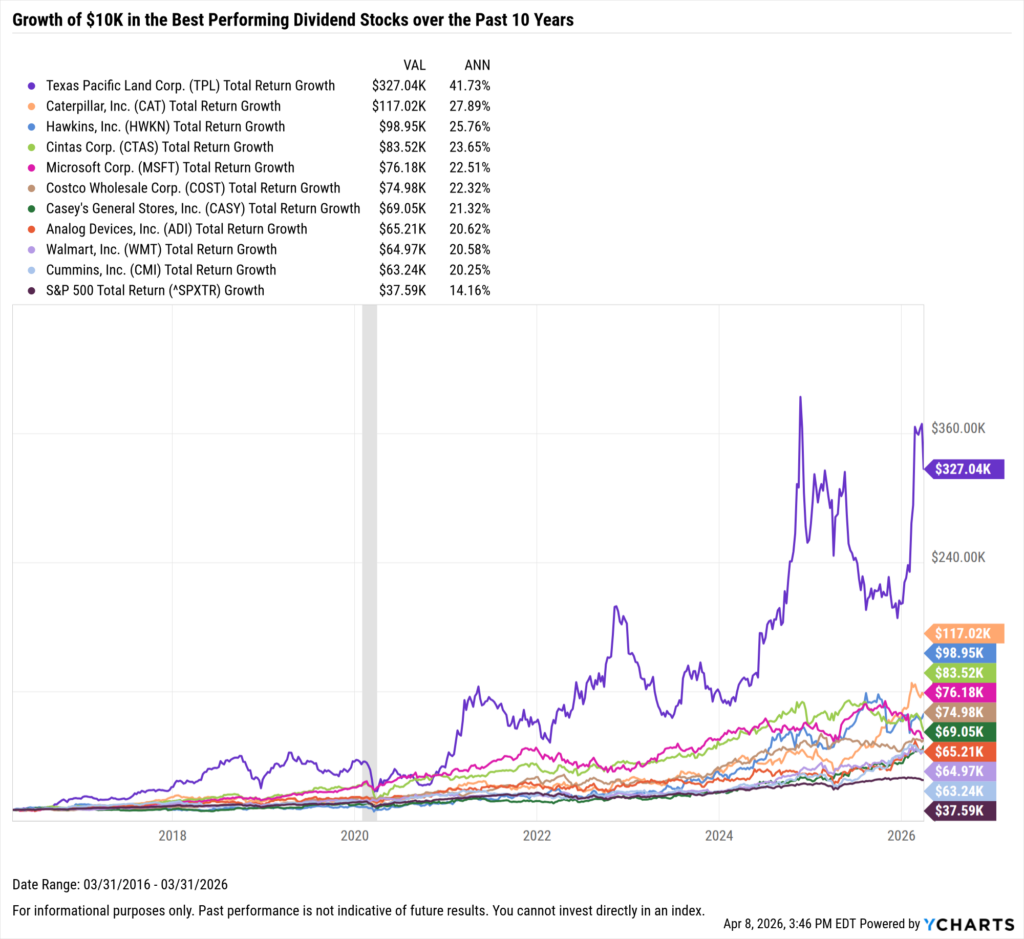
What Was the Growth of $10,000 in the Top Dividend Stocks Over the Last 10 Years?
If you invested $10,000 ten years ago into any of the ten best-performing dividend stocks over the last 10 years, your total return would be no less than $63K.
The best-performing dividend stock in the last 10 years was Texas Pacific Land Corp (TPL). A $10,000 investment into TPL 10 years ago would be worth over $327K today on a total return basis. Right behind TPL was Caterpillar (CAT); investing $10,000 into CAT back in 2015 would’ve turned into $117K with dividend reinvestment.
Six of the top ten best-performers achieved at least twice the return on investment than the S&P 500 Total Return over the last ten years.
Download Visual | Modify in YCharts
Whenever you’re ready, there are 3 ways YCharts can help you:
1. Looking for a best-in-class data & visualization tool?
Send us an email at hello@ycharts.com or call (866) 965-7552. You’ll be directly in touch with one of our Chicago-based team members.
2. Want to test out YCharts for free?
Start a no-risk 7-Day Free Trial.
3. Download a copy of The Top 10 Visuals for Client and Prospect Meetings slide deck:
Disclaimer
©2026 YCharts, Inc. All Rights Reserved. YCharts, Inc. (“YCharts”) is not registered with the U.S. Securities and Exchange Commission (or with the securities regulatory authority or body of any state or any other jurisdiction) as an investment adviser, broker-dealer or in any other capacity, and does not purport to provide investment advice or make investment recommendations. This report has been generated through application of the analytical tools and data provided through ycharts.com and is intended solely to assist you or your investment or other adviser(s) in conducting investment research. You should not construe this report as an offer to buy or sell, as a solicitation of an offer to buy or sell, or as a recommendation to buy, sell, hold or trade, any security or other financial instrument. For further information regarding your use of this report, please go to: ycharts.com/about/disclosure.
Next Article
Why YCharts is the Best Investment Research Tool for Financial AdvisorsRead More →