The Best Performing International ETFs over the Last 10 Years
Updated as of: July 9, 2026
Advisors often look beyond domestic borders for portfolio diversification opportunities and attractive equity valuations in other countries. While the U.S. stock market is currently valued around a staggering $69 trillion, it accounts for just about one-half of the world’s market capitalization.
International investing helps advisors’ clients gain exposure to the other half of total worldwide market capitalization, and ETFs enable convenient access to a basket of underlying equities in a specific country, region, or ex-US as a whole through a single investment vehicle.
This article contains the best-performing international ETFs from the last year all the way back to the past decade, with data routinely updated by YCharts.
To create this list, we analyzed the entire ETF universe using the YCharts Fund Screener to find the best-performing international equity ETFs that are US-domiciled on a 1-year, 3-year, 5-year, and 10-year basis. (ETFs with leveraged or inverse attributes as well as those in the alternative currency strategy and options arbitrage strategy peer groups were excluded to focus on long-term investment vehicles that align with broader financial planning goals)
Table of Contents
Looking for the best-performing ETFs overall? Check out our analysis on the Best Performing ETFs over the Last 10 Years here.
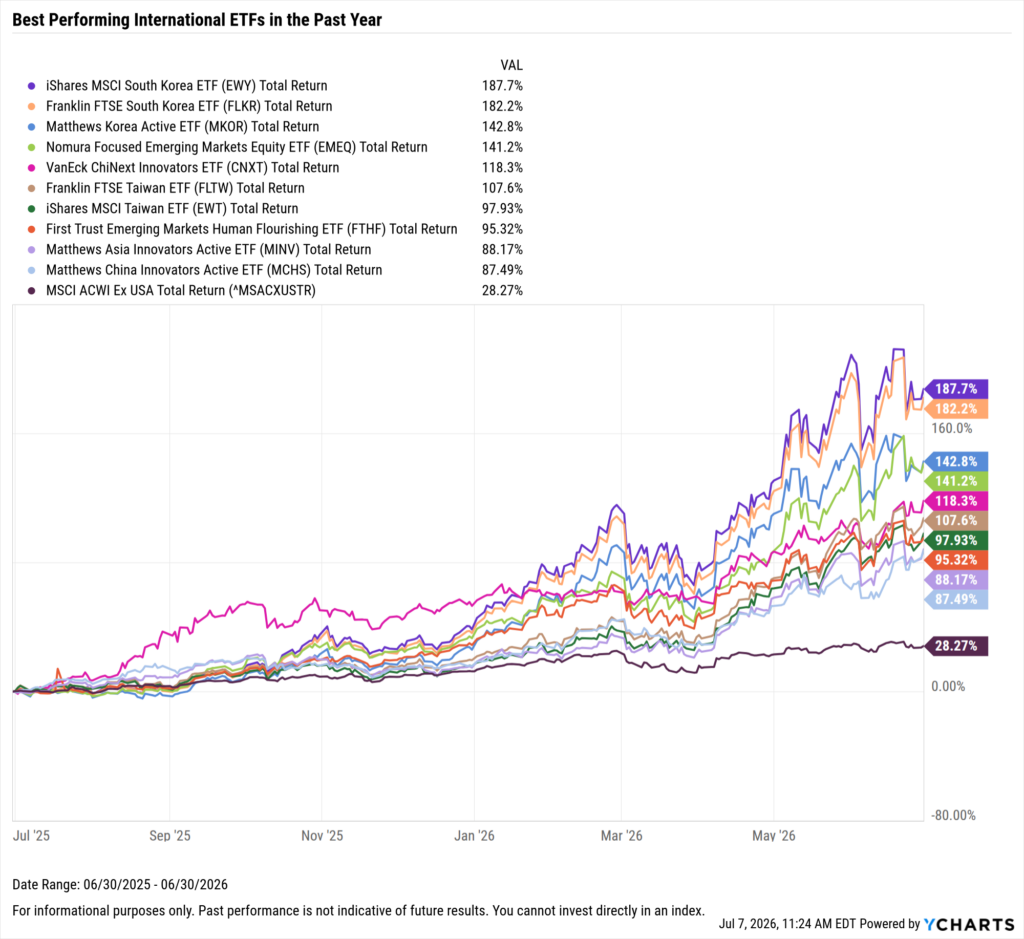
Best Performing International ETFs in the Last Year
These are the top-performing international ETFs over the past year, as of June 30, 2026.
| Symbol | Name | 1 Year Total Returns (Monthly) | Net Expense Ratio | Share Class Assets Under Management | Peer Group Name |
|---|---|---|---|---|---|
| EWY | iShares MSCI South Korea ETF | 187.68% | 0.59% | $22,659,040,614 | Pacific Ex Japan Funds |
| FLKR | Franklin FTSE South Korea ETF | 182.23% | 0.09% | $1,284,334,387 | Pacific Ex Japan Funds |
| MKOR | Matthews Korea Active ETF | 142.79% | 0.79% | $144,952,707 | Pacific Ex Japan Funds |
| EMEQ | Nomura Focused Emerging Markets Equity ETF | 141.20% | 0.85% | $654,572,536 | Emerging Markets Funds |
| CNXT | VanEck ChiNext Innovators ETF | 118.31% | 0.65% | $129,517,726 | China Region Funds |
| FLTW | Franklin FTSE Taiwan ETF | 107.56% | 0.19% | $3,054,141,845 | China Region Funds |
| EWT | iShares MSCI Taiwan ETF | 97.93% | 0.59% | $11,014,190,571 | China Region Funds |
| FTHF | First Trust Emerging Markets Human Flourishing ETF | 95.32% | 0.75% | $130,724,824 | Emerging Markets Funds |
| MINV | Matthews Asia Innovators Active ETF | 88.17% | 0.79% | $179,511,767 | Pacific Ex Japan Funds |
| MCHS | Matthews China Innovators Active ETF | 87.49% | 0.89% | $23,028,878 | China Region Funds |
Start a Free Trial to See Full Rankings | View & Modify in Fund Screener
Download Visual | Modify in YCharts
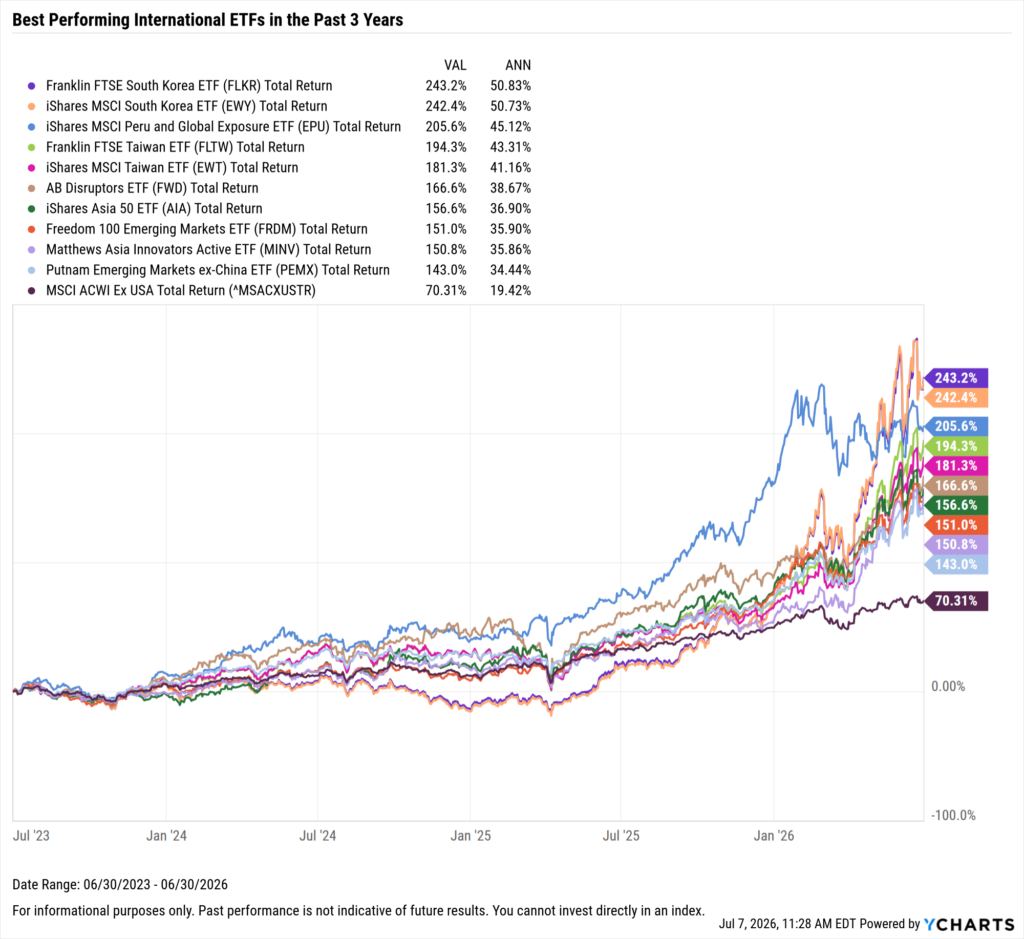
Best Performing International ETFs in the Last 3 Years
These are the top-performing international ETFs on an annualized basis between July 1st, 2023 and June 30, 2026.
| Symbol | Name | 3 Year Total Returns (Monthly) | Annualized 3 Year Total Returns (Monthly) | Net Expense Ratio | Share Class Assets Under Management | Peer Group Name |
|---|---|---|---|---|---|---|
| FLKR | Franklin FTSE South Korea ETF | 243.16% | 50.83% | 0.09% | $1,284,334,387 | Pacific Ex Japan Funds |
| EWY | iShares MSCI South Korea ETF | 242.43% | 50.73% | 0.59% | $22,659,040,614 | Pacific Ex Japan Funds |
| EPU | iShares MSCI Peru and Global Exposure ETF | 205.62% | 45.12% | 0.59% | $528,621,761 | Latin American Funds |
| FLTW | Franklin FTSE Taiwan ETF | 194.31% | 43.31% | 0.19% | $3,054,141,845 | China Region Funds |
| EWT | iShares MSCI Taiwan ETF | 181.28% | 41.16% | 0.59% | $11,014,190,571 | China Region Funds |
| FWD | AB Disruptors ETF | 166.64% | 38.67% | 0.65% | $3,036,195,503 | Global Multi-Cap Growth |
| AIA | iShares Asia 50 ETF | 156.56% | 36.90% | 0.50% | $4,853,720,182 | Pacific Ex Japan Funds |
| FRDM | Freedom 100 Emerging Markets ETF | 150.97% | 35.90% | 0.49% | $3,534,659,630 | Emerging Markets Funds |
| MINV | Matthews Asia Innovators Active ETF | 150.76% | 35.86% | 0.79% | $179,511,767 | Pacific Ex Japan Funds |
| PEMX | Putnam Emerging Markets ex-China ETF | 142.98% | 34.44% | 0.70% | $33,540,586 | Emerging Markets Funds |
Start a Free Trial to See Full Rankings | View & Modify in Fund Screener
Download Visual | Modify in YCharts
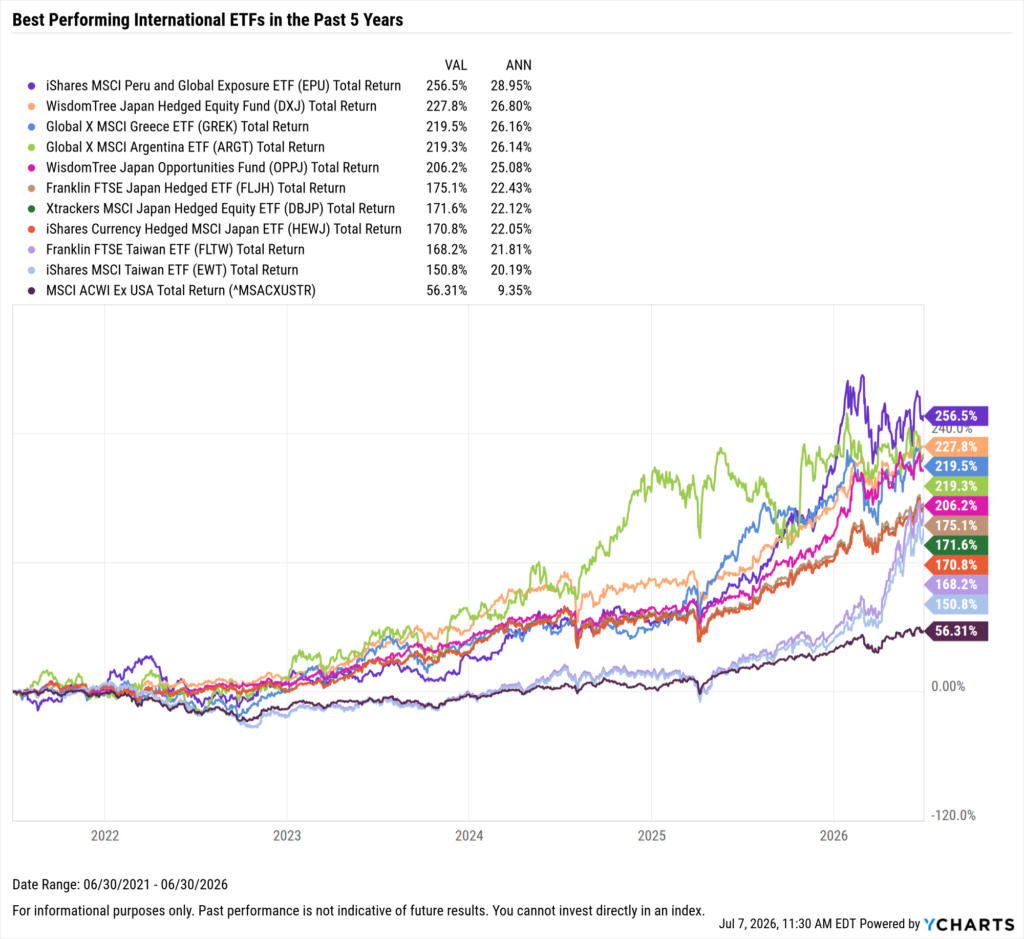
Best Performing International ETFs in the Last 5 Years
These are the top-performing ETFs on an annualized basis between July 1, 2021 and June 30, 2026.
| Symbol | Name | 5 Year Total Returns (Monthly) | Annualized 5 Year Total Returns (Monthly) | Net Expense Ratio | Share Class Assets Under Management | Peer Group Name |
|---|---|---|---|---|---|---|
| EPU | iShares MSCI Peru and Global Exposure ETF | 256.49% | 28.95% | 0.59% | $528,621,761 | Latin American Funds |
| DXJ | WisdomTree Japan Hedged Equity Fund | 227.84% | 26.80% | 0.48% | $7,295,999,888 | Japanese Funds |
| GREK | Global X MSCI Greece ETF | 219.54% | 26.16% | 0.56% | $293,611,571 | Emerging Markets Funds |
| ARGT | Global X MSCI Argentina ETF | 219.29% | 26.14% | 0.59% | $859,820,811 | Latin American Funds |
| OPPJ | WisdomTree Japan Opportunities Fund | 206.16% | 25.08% | 0.58% | $286,903,655 | Japanese Funds |
| FLJH | Franklin FTSE Japan Hedged ETF | 175.11% | 22.43% | 0.09% | $175,900,613 | Japanese Funds |
| DBJP | Xtrackers MSCI Japan Hedged Equity ETF | 171.62% | 22.12% | 0.45% | $702,119,376 | Japanese Funds |
| HEWJ | iShares Currency Hedged MSCI Japan ETF | 170.82% | 22.05% | 0.49% | $737,772,290 | Japanese Funds |
| FLTW | Franklin FTSE Taiwan ETF | 168.20% | 21.81% | 0.19% | $3,054,141,845 | China Region Funds |
| EWT | iShares MSCI Taiwan ETF | 150.80% | 20.19% | 0.59% | $11,014,190,571 | China Region Funds |
Start a Free Trial to See Full Rankings | View & Modify in Fund Screener
Download Visual | Modify in YCharts
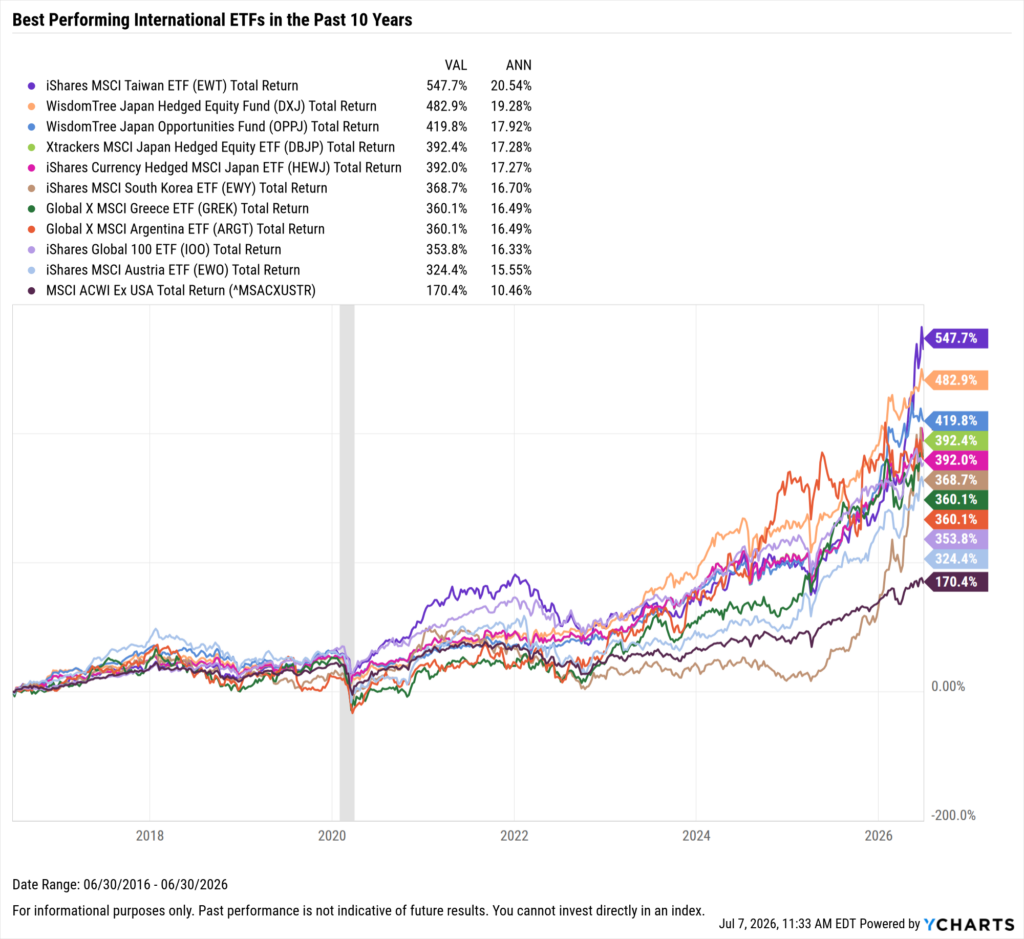
Best Performing International ETFs in the Last 10 Years
These are the top-performing ETFs on an annualized basis between July 1, 2016 and June 30, 2026.
| Symbol | Name | 10 Year Total Returns (Monthly) | Annualized 10 Year Total Returns (Monthly) | Net Expense Ratio | Share Class Assets Under Management | Peer Group Name |
|---|---|---|---|---|---|---|
| EWT | iShares MSCI Taiwan ETF | 547.72% | 20.54% | 0.59% | $11,014,190,571 | China Region Funds |
| DXJ | WisdomTree Japan Hedged Equity Fund | 482.93% | 19.28% | 0.48% | $7,295,999,888 | Japanese Funds |
| OPPJ | WisdomTree Japan Opportunities Fund | 419.81% | 17.92% | 0.58% | $286,903,655 | Japanese Funds |
| DBJP | Xtrackers MSCI Japan Hedged Equity ETF | 392.36% | 17.28% | 0.45% | $702,119,376 | Japanese Funds |
| HEWJ | iShares Currency Hedged MSCI Japan ETF | 392.01% | 17.27% | 0.49% | $737,772,290 | Japanese Funds |
| EWY | iShares MSCI South Korea ETF | 368.65% | 16.70% | 0.59% | $22,659,040,614 | Pacific Ex Japan Funds |
| GREK | Global X MSCI Greece ETF | 360.12% | 16.49% | 0.56% | $293,611,571 | Emerging Markets Funds |
| ARGT | Global X MSCI Argentina ETF | 360.10% | 16.49% | 0.59% | $859,820,811 | Latin American Funds |
| IOO | iShares Global 100 ETF | 353.77% | 16.33% | 0.40% | $8,548,808,744 | Global Large-Cap Core |
| EWO | iShares MSCI Austria ETF | 324.43% | 15.55% | 0.49% | $142,370,131 | European Region Funds |
Start a Free Trial to See Full Rankings | View & Modify in Fund Screener
Download Visual | Modify in YCharts
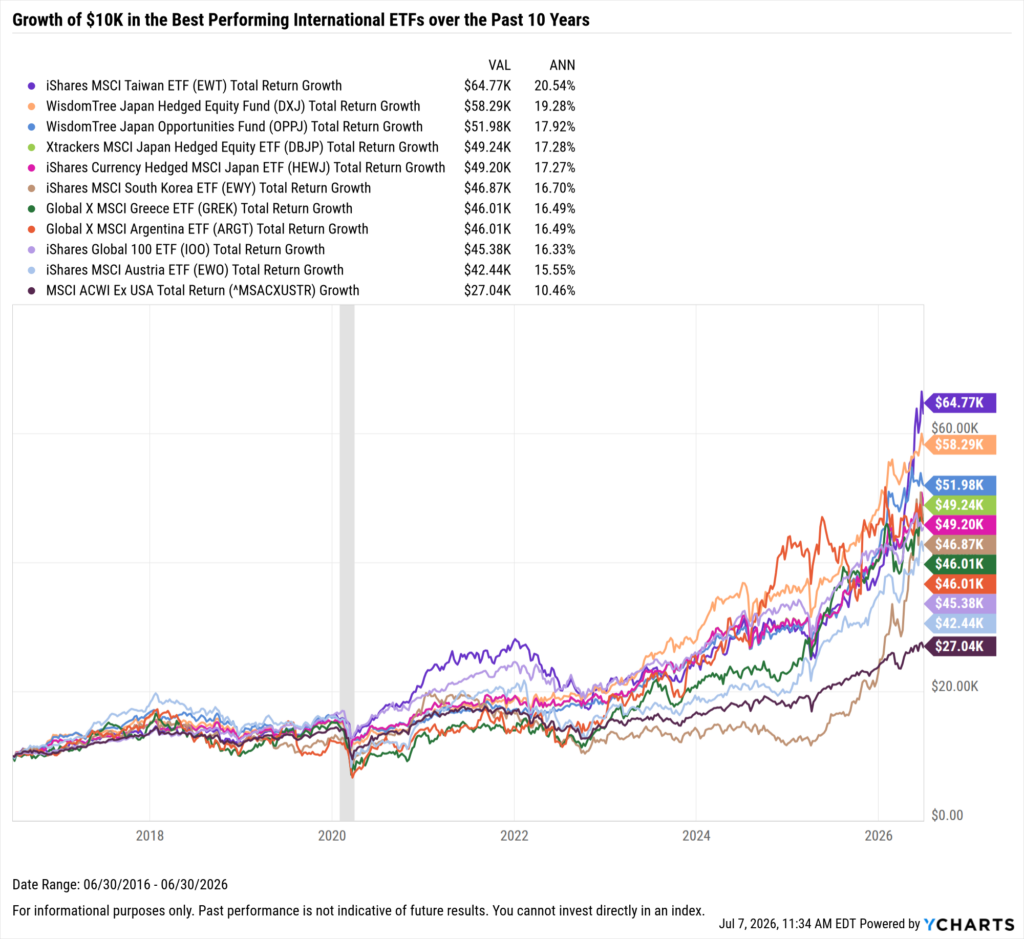
What Was the Growth of $10,000 in the Top International ETFs Over the Last 10 Years?
The best-performing international ETF in the last 10 years was the iShares MSCI Taiwan ETF (EWT). A $10,000 investment into this Taiwan-focused ETF 10 years ago would be worth $64,770 today on a total return basis.
Right behind EWT was the WisdomeTree Japan Hedged Equity Fund (DXJ), with the iShares Global 100 ETF (IOO) down in ninth place; investing $10,000 into DXJ back in 2016 would’ve turned into $58,290 with dividend reinvestment, and that same principal invested into IOO would have returned just over $45K. Though IOO is a globally-focused large-cap ETF, it has moved mostly in tandem with the S&P 500 over that time period due to a 49% holdings overlap between IOO and SPY.
Download Visual | Modify in YCharts
Whenever you’re ready, here’s how YCharts can help you:
1. Interested in doing further ETF research with YCharts?
2. Want to test out YCharts for free?
Start a no-risk 7-Day Free Trial.
3. Sign up for a copy of our Fund Flows Report and Visual Deck to stay on top of mutual fund trends:
Sign up to recieve a copy of our monthly Fund Flows Report:Disclaimer
©2026 YCharts, Inc. All Rights Reserved. YCharts, Inc. (“YCharts”) is not registered with the U.S. Securities and Exchange Commission (or with the securities regulatory authority or body of any state or any other jurisdiction) as an investment adviser, broker-dealer or in any other capacity, and does not purport to provide investment advice or make investment recommendations. This report has been generated through application of the analytical tools and data provided through ycharts.com and is intended solely to assist you or your investment or other adviser(s) in conducting investment research. You should not construe this report as an offer to buy or sell, as a solicitation of an offer to buy or sell, or as a recommendation to buy, sell, hold or trade, any security or other financial instrument. For further information regarding your use of this report, please go to: ycharts.com/about/disclosure.
Next Article
The Best Performing Bond Mutual Funds over the Last 10 YearsRead More →