Liquid Alt Fund Leaderboard: December 2025
Updated as of: January 17, 2025
Alternative investments aren’t just being talked about, they’re being allocated to.
While the buzz often centers on private alternatives, listed alternatives have been gaining attention for their edge in liquidity, transparency, and cost efficiency compared to their private counterparts.
To provide advisors with alternative investment ideas for consideration in portfolios, we compiled lists of both the largest and best-performing liquid alt funds using the YCharts Fund Screener, which helps advisors navigate across a universe of over 81,000 funds to find specific investment candidates. The results are based on share class assets under management (AUM) and one-year price returns, respectively, with the screener’s broad category set to “Alternative Strategies” that excludes SMAs.
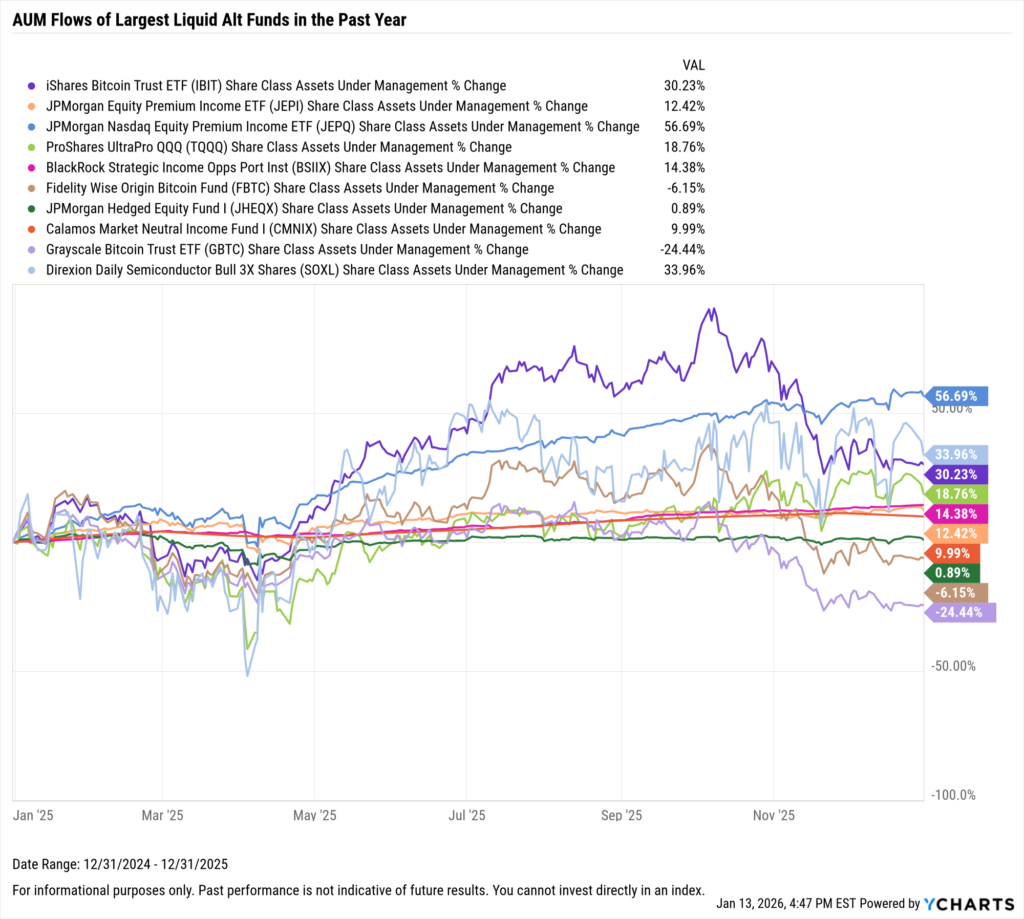
The following data includes AUM flows over the last month, three months, and one year, along with net expense ratio and one-year price returns for the largest leveraged and inverse ETFs.
Looking for the best-performing ETFs overall? Check out our analysis on the Best Performing ETFs over the Last 10 Years here.
Table of Contents

Largest Liquid Alt Funds
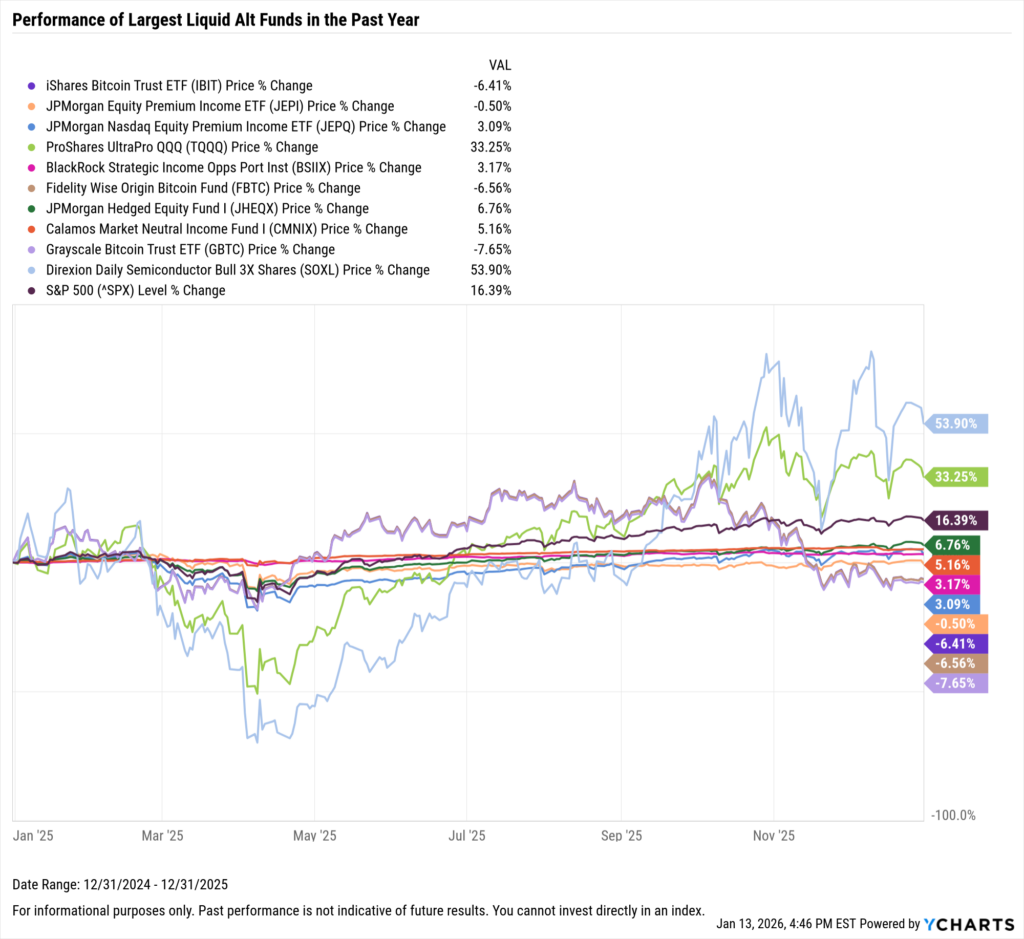
These are the largest Liquid Alt Funds as of December 31, 2025.
| Symbol | Name | Share Class Assets Under Management | 1 Year Price Returns (Monthly) | 1 Month Fund Share Class Flows | 3 Month Fund Share Class Flows | 1 Year Fund Share Class Flows | Net Expense Ratio | Fund Family |
|---|---|---|---|---|---|---|---|---|
| IBIT | iShares Bitcoin Trust ETF | $70,891,640,072 | -6.41% | -$484,812,476 | $1,484,701,748 | $25,007,783,925 | 0.22% | iShares |
| JEPI | JPMorgan Equity Premium Income ETF | $42,559,888,974 | -0.50% | -$115,470,676 | -$992,522,301 | $1,457,079,175 | 0.35% | JPMorgan |
| JEPQ | JPMorgan Nasdaq Equity Premium Income ETF | $33,441,908,824 | 3.09% | $332,959,309 | $153,661,723 | $7,353,681,928 | 0.35% | JPMorgan |
| TQQQ | ProShares UltraPro QQQ | $30,887,861,847 | 33.25% | -$434,332,220 | $1,198,259,815 | -$6,034,559,131 | 0.82% | ProShares |
| BSIIX | BlackRock Strategic Income Opps Port Inst | $29,611,563,522 | 3.17% | $227,900,924 | $507,383,642 | $1,554,820,591 | 0.71% | BlackRock |
| FBTC | Fidelity Wise Origin Bitcoin Fund | $18,073,534,005 | -6.56% | $217,207,367 | -$41,557,025 | $508,419,608 | 0.25% | Fidelity Investments |
| JHEQX | JPMorgan Hedged Equity Fund I | $17,000,462,287 | 6.76% | -$220,264,790 | -$442,894,349 | -$1,094,232,292 | 0.57% | JPMorgan |
| CMNIX | Calamos Market Neutral Income Fund I | $15,392,420,000 | 5.16% | -$230,054,007 | -$141,336,241 | $433,684,763 | 0.97% | Calamos |
| GBTC | Grayscale Bitcoin Trust ETF | $14,901,251,607 | -7.65% | -$159,578,044 | -$1,031,984,496 | -$3,689,725,753 | 1.52% | Grayscale |
| SOXL | Direxion Daily Semiconductor Bull 3X Shares | $13,267,487,456 | 53.90% | -$1,481,271,033 | -$2,780,920,102 | -$8,786,370,812 | 0.75% | Direxion Funds |
Start a Free Trial to See Full Rankings | View & Modify in Stock Screener
Largest Liquid Alt Funds Performance
Download Visual | Modify in YCharts
Largest Liquid Alt Funds Share Class Flows
Download Visual | Modify in YCharts
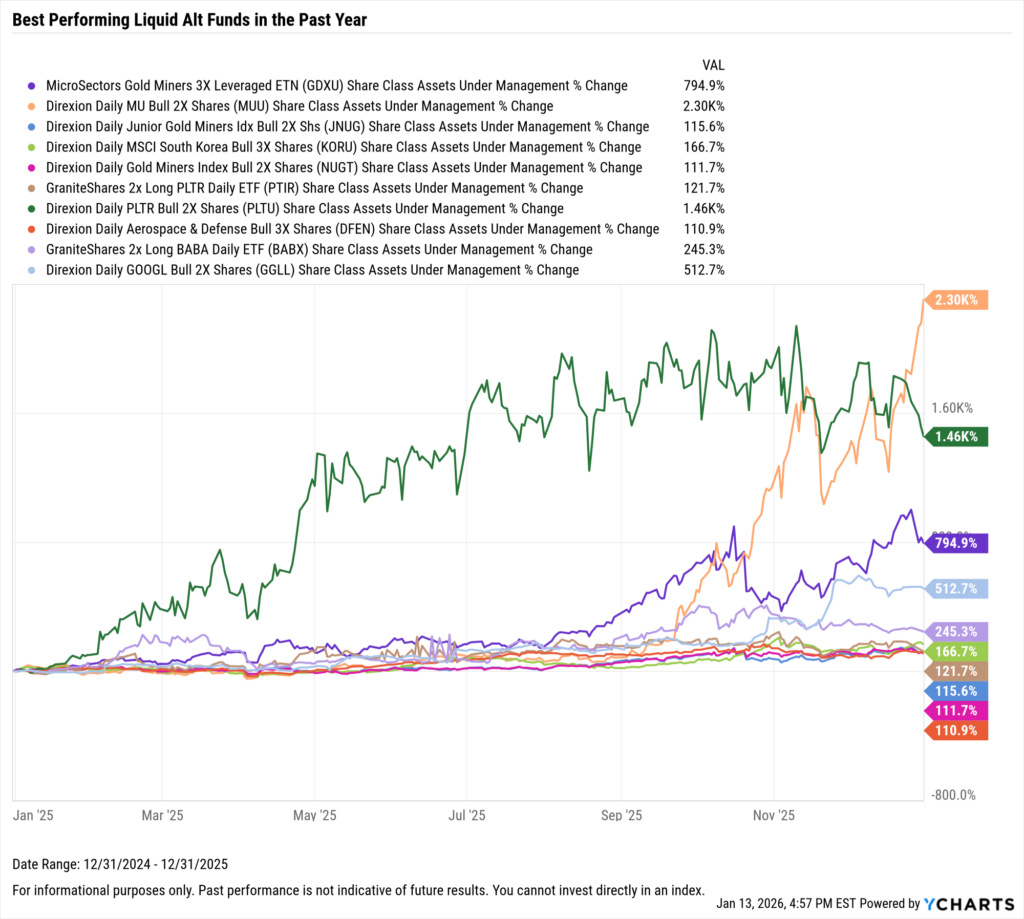
Best Performing Liquid Alt Funds
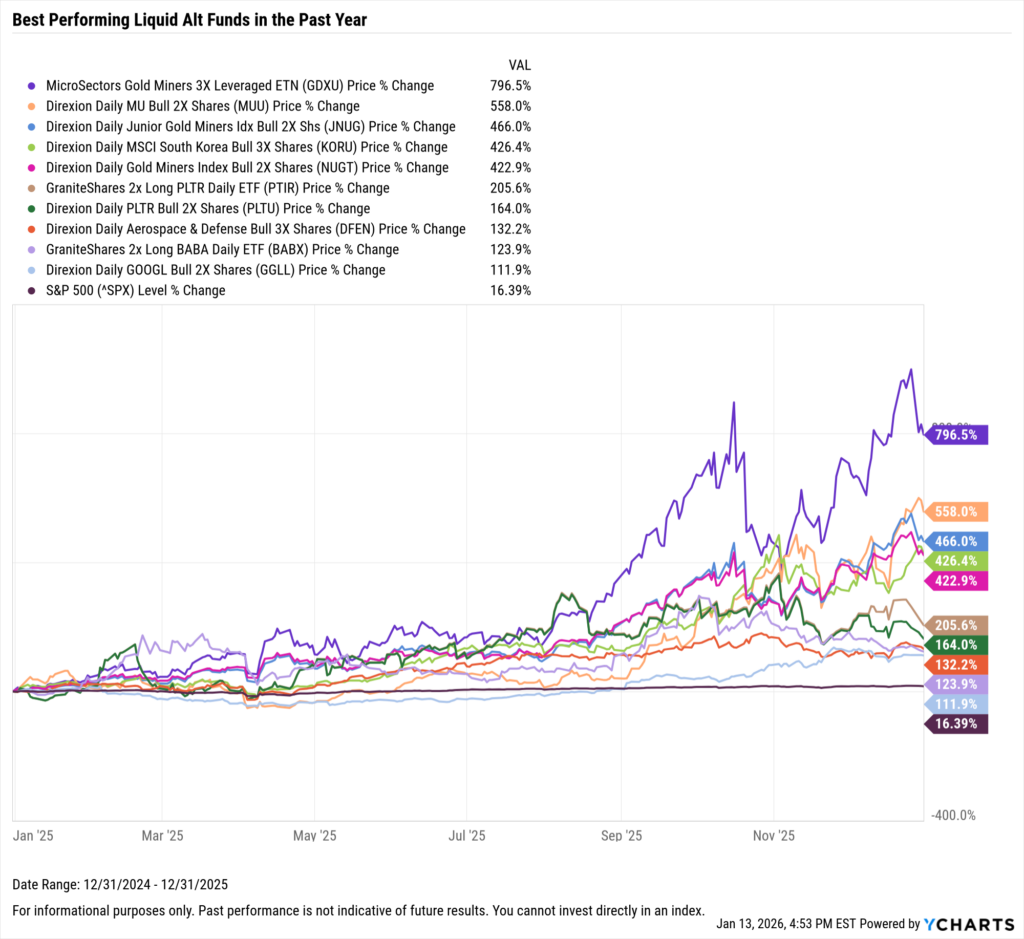
These are the largest best performing Liquid Alt Funds as of December 31, 2025.
| Symbol | Name | 1 Year Price Returns (Monthly) | Share Class Assets Under Management | 1 Month Fund Share Class Flows | 3 Month Fund Share Class Flows | 1 Year Fund Share Class Flows | Net Expense Ratio | Fund Family |
|---|---|---|---|---|---|---|---|---|
| GDXU | MicroSectors Gold Miners 3X Leveraged ETN | 796.47% | $2,807,800,325 | $2 | -$132,203,587 | -$132,203,591 | 0.95% | BMO Capital Markets |
| MUU | Direxion Daily MU Bull 2X Shares | 558.00% | $713,847,869 | $97,243,594 | $198,147,909 | $237,538,575 | 1.06% | Direxion Funds |
| JNUG | Direxion Daily Junior Gold Miners Idx Bull 2X Shs | 466.02% | $680,670,142 | -$50,826,919 | -$87,705,194 | -$390,386,389 | 1.02% | Direxion Funds |
| KORU | Direxion Daily MSCI South Korea Bull 3X Shares | 426.41% | $321,746,587 | -$9,416,100 | $2,369,661 | -$76,469,719 | 1.32% | Direxion Funds |
| NUGT | Direxion Daily Gold Miners Index Bull 2X Shares | 422.90% | $1,288,178,742 | -$137,400,117 | -$147,989,892 | -$648,104,654 | 1.13% | Direxion Funds |
| PTIR | GraniteShares 2x Long PLTR Daily ETF | 205.65% | $607,452,960 | -$99,346,258 | -$77,913,164 | -$322,023,060 | 1.04% | Graniteshares |
| PLTU | Direxion Daily PLTR Bull 2X Shares | 163.96% | $500,624,199 | -$110,638,790 | -$65,487,132 | -$45,430,883 | 0.97% | Direxion Funds |
| DFEN | Direxion Daily Aerospace & Defense Bull 3X Shares | 132.21% | $456,817,779 | -$20,161,144 | -$37,109,680 | -$50,936,973 | 0.95% | Direxion Funds |
| BABX | GraniteShares 2x Long BABA Daily ETF | 123.85% | $208,320,480 | $7,650,494 | $32,536,282 | $52,471,891 | 1.18% | Graniteshares |
| GGLL | Direxion Daily GOOGL Bull 2X Shares | 111.85% | $1,023,372,627 | -$28,063,516 | $337,621,978 | $394,329,447 | 0.99% | Direxion Funds |
Start a Free Trial to See Full Rankings | View & Modify in Stock Screener
Top Liquid Alt Funds Performance
Download Visual | Modify in YCharts
Top Liquid Alt Funds Share Class Flows
Download Visual | Modify in YCharts
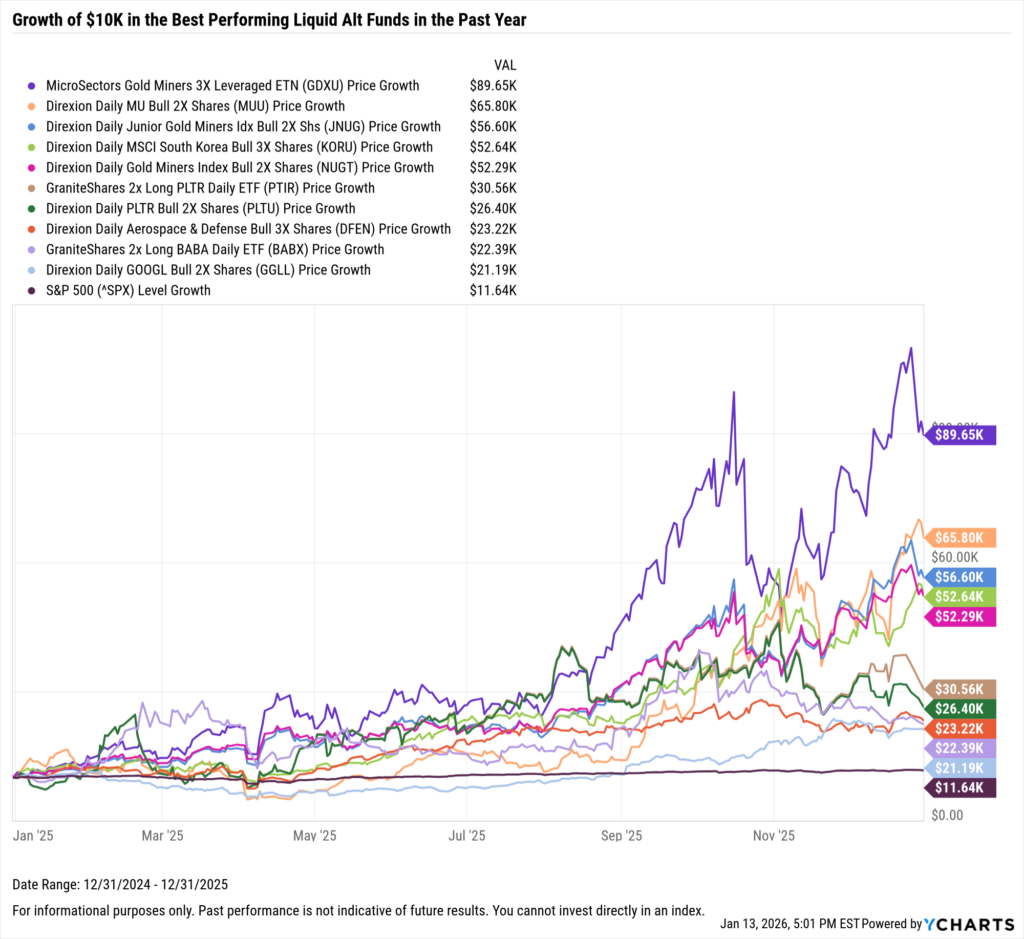
What Was the Growth of $10,000 in the Top Liquid Alt Funds Over the Last Year?
If you invested $10,000 one year ago into any of the top nine best-performing liquid alt funds in the last year, your total return one year later would have beat the S&P 500 by at least double. MicroSectors Gold Miners 3X Leveraged ETN (GDXU) and the Direxion Daily MU Bull 2X Shares (MUU) were the two best-performing liquid alt funds in the last year.
Download Visual | Modify in YCharts
Whenever you’re ready, there are 3 ways YCharts can help you:
1. Looking for a best-in-class data & visualization tool?
Send us an email at hello@ycharts.com or call (866) 965-7552. You’ll be directly in touch with one of our Chicago-based team members.
2. Want to test out YCharts for free?
Start a no-risk 7-Day Free Trial.
3. Download a copy of The Top 10 Visuals for Client and Prospect Meetings slide deck:
Disclaimer
©2026 YCharts, Inc. All Rights Reserved. YCharts, Inc. (“YCharts”) is not registered with the U.S. Securities and Exchange Commission (or with the securities regulatory authority or body of any state or any other jurisdiction) as an investment adviser, broker-dealer or in any other capacity, and does not purport to provide investment advice or make investment recommendations. This report has been generated through application of the analytical tools and data provided through ycharts.com and is intended solely to assist you or your investment or other adviser(s) in conducting investment research. You should not construe this report as an offer to buy or sell, as a solicitation of an offer to buy or sell, or as a recommendation to buy, sell, hold or trade, any security or other financial instrument. For further information regarding your use of this report, please go to: ycharts.com/about/disclosure.
Next Article
Largest Leveraged and Inverse ETFsRead More →