What Young Investors Don’t Know About Financial Advisors

There’s a troubling issue for today’s financial advisors: While 73% of Gen Z have engaged in financial planning by age 25 (earlier than any previous generation), only 14% turn to a financial advisor first when they need advice. According to a 2024 Policygenius Financial Planning Survey, Gen Z is 65% less likely than Baby Boomers to turn to financial professionals first for their financial planning needs.
Table of Contents
Where does Gen Z get their advice from instead? Social media and the internet. A May 2023 study by the CFA Institute and FINRA Foundation found that 48% of Gen Z investors rely on social media as their top source for investment information. The second highest source was internet searches at 47%.
Unfortunately, the consequences of this behavior have harmed many younger investors. A 2023 Nationwide survey found that 41% of Gen Z investors have acted upon financial information they saw online that turned out to be incorrect or misleading.
Why are younger investors turning to social media and the internet for financial advice instead of advisors? Many of them don’t understand what modern financial advisors actually do. Though they value professional guidance, they are not necessarily well-versed on the quantifiable value they can provide.
So what exactly do young investors think advisors do? Let’s dig in.
Want to attract the clients who will define your next 20 years of revenue? Revisit our webinar on Winning the Next Generation of Clients.
What Young Investors Think About Advisors
Many investors have a fundamental misunderstanding of who financial advisors serve, how much they charge, and what they do. In a MagnifyMoney survey of more than 1,500 Americans, 42% thought financial advisors were only for the wealthy. There was a similar misconception about when to use one. 44% of Gen Z believed you don’t need a financial advisor until middle age.
The misunderstandings around cost compound this problem. Though fee-only advisors typically charge between 0.5% and 1.25% of assets under management, 45% of those without a paid financial advisor thought the cost was between 5% and 15% (or more) of assets. This misconception is deterring some younger investors from getting the advice they need.
Additionally, there is a somewhat dated view that financial advisors only manage investments and nothing else. Though historically this was the core function of advisors, with the industry shifting toward holistic planning, this widespread belief needs updating.
Lastly, though Gen Z uses social media and the internet for much of their financial advice, some data suggests that they aren’t getting the answers they are looking for. A survey by intelliflo found that 71% of Gen Z “strongly or somewhat agree” that there are financial topics they want advice on but aren’t sure how to get it.
This demonstrates that there is an information gap where effective advisors can not only explain what they do, but showcase their value to younger investors.
This article is authored by Nick Maggiulli, COO of Ritholtz Wealth Management and author of the blog Of Dollars And Data.
What Advisors Do and Where They Add Value
Modern financial advisors provide far more than investment management. They offer comprehensive, holistic financial planning that addresses every aspect of a client’s financial life.
Those that don’t offer these services may be falling behind. Research from LPL Financial found that “top advisors were 53% more likely to offer estate planning, 41% more likely to offer tax planning and strategy, 28% more likely to offer retirement plan consulting, and 17% more likely to offer insurance.”
This shift toward providing more services matches what clients increasingly prefer. For example, when McKinsey surveyed wealth clients in 2018, 29% wanted holistic advice that could address adjacent financial needs. By 2023, that number jumped to 47%.
Younger investors in particular expect advisors to be more than investment managers. While Baby Boomers, Gen Xers, and Millennials all cited investment management as their main reason for using an advisor, Gen Z cited tax planning as their top priority.
If advisors want to attract younger clients, they should adjust their marketing strategy to emphasize these adjacent financial needs and where they can add value. For example, with YCharts’ Scenarios, advisors can model different life events for clients (e.g. buying a home, changing careers, etc.) and show the financial impact of such a decision.
Advisor Value in Action
Below is one example where we modeled a client saving for a down payment on a house. In this scenario, a client currently has $65,000 invested in a moderate-risk portfolio and plans to buy a $415,000 home (U.S. Median Existing Home Price) in a few years. They’re unsure how much to put down.
Assuming a 5.5% interest rate on a 30-year fixed loan:
- 20% down ($83,000) → roughly $1,886/month in principal and interest
- 10% down ($41,500) → roughly $2,121/month, or $235 more per month
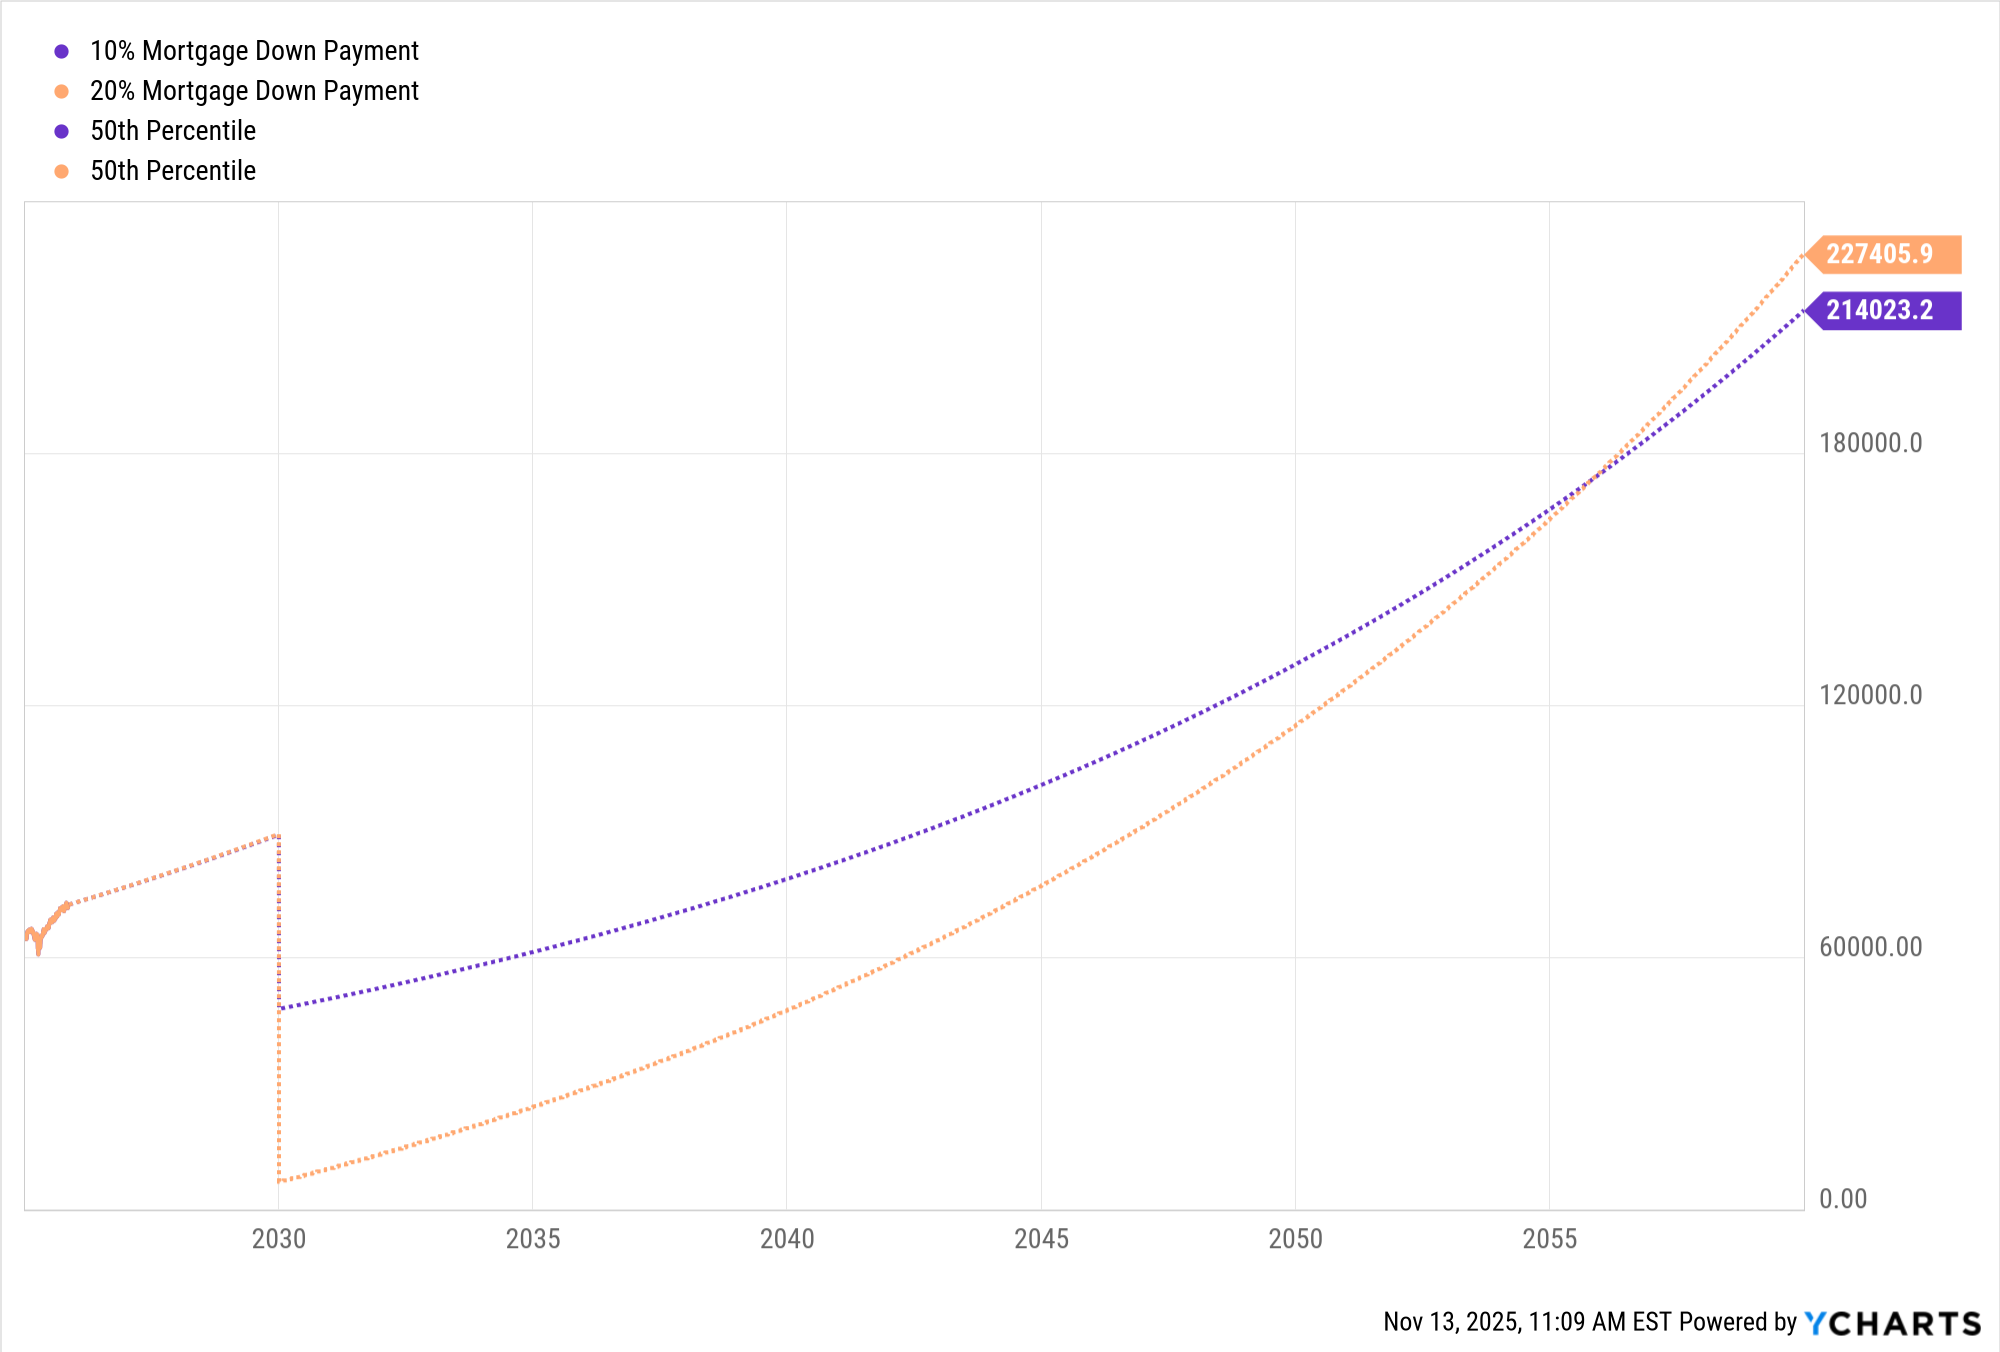
The scenario models 1,000 possible future outcomes using the fund’s historical performance. The 50th percentile reflects the midpoint of those results, offering the most realistic expectation for future returns.
The smaller down payment allows for a higher initial investment balance that begins compounding immediately, but receives no additional contributions over time.
The larger down payment approach depends on consistent reinvestment of remaining assets, which grow through ongoing contributions. After roughly 25 years of deposits (about $70,500 total), both strategies reach a breakeven point.
The decision isn’t simply about having more cash or taking on more debt. Using YCharts’ Scenarios, advisors can model both paths side by side to help clients see how different choices shape long-term outcomes.
This kind of forward-looking, customized planning is impossible to get from social media or Google searches.
Advisors can add value in many other ways, too. Research from Vanguard found that implementing a holistic advisory framework can add up to, or even exceed, 3% in net returns for clients annually. This was broken down into the following categories:
- Behavioral coaching: Up to 2%
Helping clients maintain discipline and avoid emotional decisions during market volatility - Asset Location: Up to 0.6%
Optimizing which investments go in taxable versus tax-advantaged accounts - Low Cost Implementation: 0.45%
Using low-cost investments while maintaining proper asset allocation through rebalancing
Importantly, Vanguard emphasizes that this 3% value doesn’t accrue evenly each year. The most significant opportunities often occur during critical moments—market crashes, euphoria, or major life transitions—when advisors prevent clients from making emotionally-driven decisions that could cost thousands or millions in long-term returns. This kind of value is particularly relevant for younger investors who:
- Are more likely to be influenced by social media narratives during market volatility.
- Face major financial decisions (buying homes, changing careers, managing student debt) where professional guidance creates measurable outcomes.
- Have decades of compounding ahead of them, meaning early mistakes are exponentially more costly.
Despite this clear value proposition, most young investors remain unaware of what modern advisors actually provide. Therefore, the question becomes: how can advisors effectively show younger investors why they need professional guidance?
How to Bridge the Gap With Younger Investors
The solution to attracting younger investors isn’t to compete with social media influencers or oversimplify complex financial concepts. Instead, advisors need to communicate in ways that resonate with how Gen Z consumes and processes information.
Younger generations are visual learners who grew up with data dashboards, infographics, and other interactive online content. This creates an opportunity for advisors to differentiate themselves from their competitors.
Tools like YCharts’ Report Builder allow advisors to create compelling, visual presentations that transform abstract financial concepts into clear, understandable narratives. Rather than explaining portfolio performance or fee value with text, advisors can leverage high quality visuals that speak the language younger investors already understand.
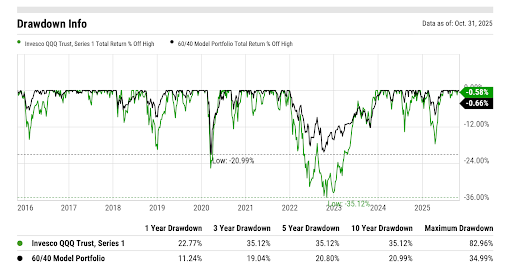
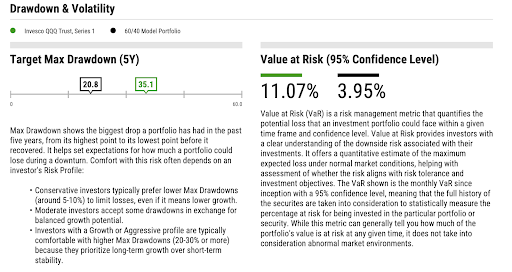
Below is one example of how advisors can use Report Builder to demonstrate the risks associated with a client’s current portfolio and how their model portfolio compares. For example, a younger client who has a lot of their money in tech stocks (QQQ) may not fully understand the risk they are taking with such a portfolio. The module below demonstrates the drawdowns associated with this portfolio (QQQ) compared to a 60/40 model portfolio:
Report Builder also allows you to include customized talking points with the exact messaging you want to convey to prospective clients:
Beyond presentation, advisors can increase their relatability by acknowledging the sources that younger investors already trust, while adding professional context. Gen Z pays attention to market trends, social media sentiment, and non-traditional indicators that don’t often appear in conventional financial analysis. With YCharts’ Custom Securities feature, advisors can track these alternative data points that younger investors care about and provide informed analysis around them.
For instance, if recession fears are trending on social media, advisors can add custom indicators showing different recession warning signals, helping clients separate noise from meaningful data. This approach validates what younger investors are seeing online while demonstrating the value of professional interpretation.
The Opportunity Ahead
Overall, younger investors want guidance. However, many don’t understand what advisors actually do. Thankfully, this disconnect is an education gap, not a generational one.
For advisors willing to clearly articulate their larger value proposition beyond investment selection, the opportunity is significant. There’s a fast-growing market of engaged young investors who are making costly mistakes despite believing they are on the right track.
There’s also a great wealth transfer currently underway that advisors need to prepare for. Unfortunately, four out of five heirs fire their parents’ advisor after they inherit wealth. Not only is money changing hands, but relationships are too. Advisors who can learn to work with younger generations will not only attract new clients, but retain those who stand to inherit the most wealth in human history.
To help advisors navigate these challenges, I am hosted a live webinar with YCharts which walked through YCharts’ The Great Wealth Transfer deck. The deck covers:
- Why heirs leave and how to earn their trust early
- What Gen Z & Millennials actually invest in and how to adapt your approach
- How to turn speculative trends into long-term planning conversations
Ready to Move On From Your Investment Research and Analytics Platform?
Follow YCharts Social Media to Unlock More Content!
Disclaimer
©2025 YCharts, Inc. All Rights Reserved. YCharts, Inc. (“YCharts”) is not registered with the U.S. Securities and Exchange Commission (or with the securities regulatory authority or body of any state or any other jurisdiction) as an investment adviser, broker-dealer or in any other capacity, and does not purport to provide investment advice or make investment recommendations. This report has been generated through application of the analytical tools and data provided through ycharts.com and is intended solely to assist you or your investment or other adviser(s) in conducting investment research. You should not construe this report as an offer to buy or sell, as a solicitation of an offer to buy or sell, or as a recommendation to buy, sell, hold or trade, any security or other financial instrument. For further information regarding your use of this report, please go to: ycharts.com/about/disclosure.
Next Article
Boosting Model Adoption Across Large RIAs Through a Unified WorkflowRead More →