New on YCharts: One-Page Portfolio Tearsheets
One-Page Portfolio Tearsheets are an exciting new addition to YCharts’ range of communication tools for advisors and asset managers. In addition to portfolio comparisons, FINRA-reviewed reports, and standalone visuals, One-Page Tearsheets provide a clean and digestible review of any investment strategy—and your clients and prospects will appreciate the simplicity.
Available to all YCharts Professional users, One-Page Tearsheets can be customized with your firm’s logo, colors, portfolio description, and custom benchmarks.
Connect with Clients & Drive Internal Discussions
As a trusted technology partner to thousands of RIAs, broker-dealers, and asset managers, we’ve heard from the front lines that conversations about portfolios can quickly become overwhelming for clients. The culprit, advisors say, is information overload caused by pages upon pages of ledgers, data tables, and definitions.
Because they present a wealth of key metrics and portfolio information in a straightforward, intuitive way, One-Page Tearsheets enable both your clients and colleagues to better understand portfolio strategies and their strengths.
Tearsheets expand upon the many ways advisors and asset managers use YCharts to build portfolios and communicate their strengths to clients and prospects. Read on to learn more!
See the Power of a One-Page Portfolio Report
YCharts’ One-Page Portfolio Tearsheets are advisors’ most straightforward and digestible option for proposing and reviewing portfolio strategies. In one page, tearsheets include:
Your Portfolio’s Basic Info
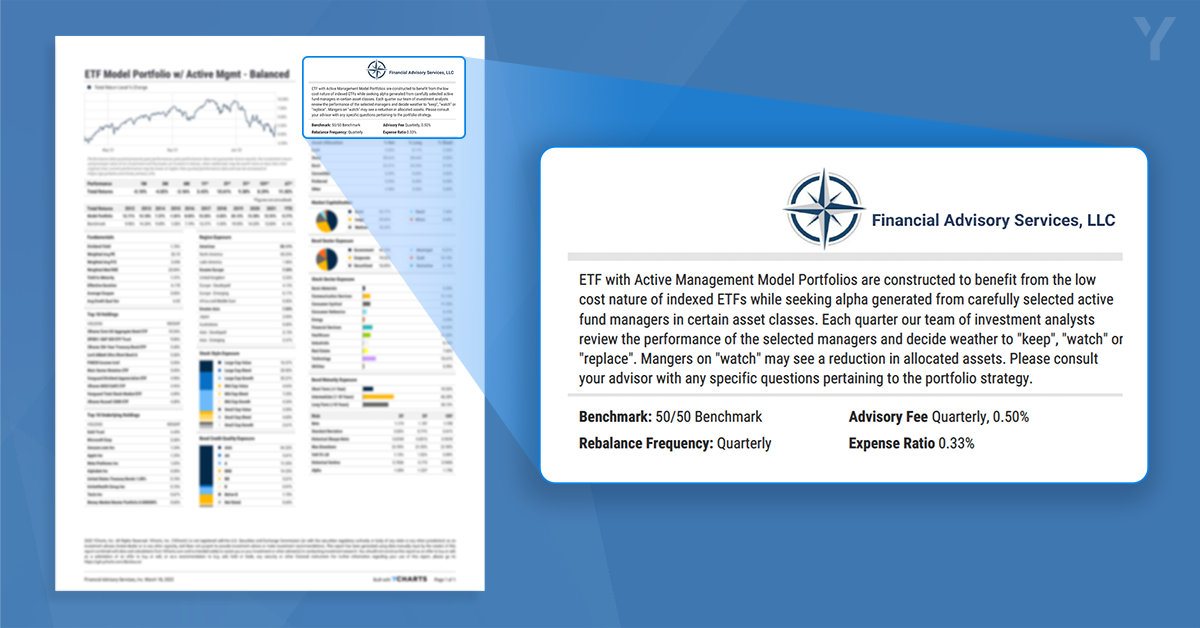
In the Tearsheet’s upper right-hand corner, key portfolio information such as expense ratio, rebalance frequency, benchmark, and your fees are presented alongside a customizable description and your firm’s logo.
Take a FREE Trial to Get Started with Tearsheets
Performance & Returns
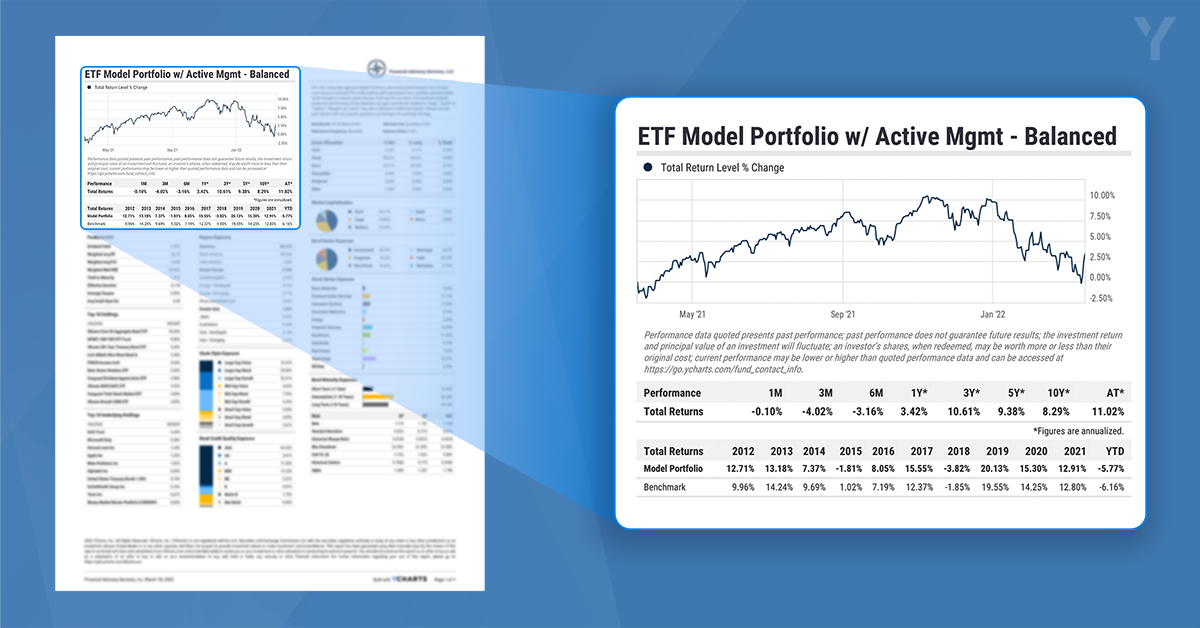
Opposite the Basic Info is a visual module including a one-year performance chart, performance over key lookback periods, and annual returns versus your chosen benchmark. This area of a One-Page Tearsheet quickly shows clients where their portfolio stands, and illustrates to prospects the favorable outcomes you can deliver.
Schedule a Demo to See Tearsheets in Action
Fundamentals, Risk & Allocations
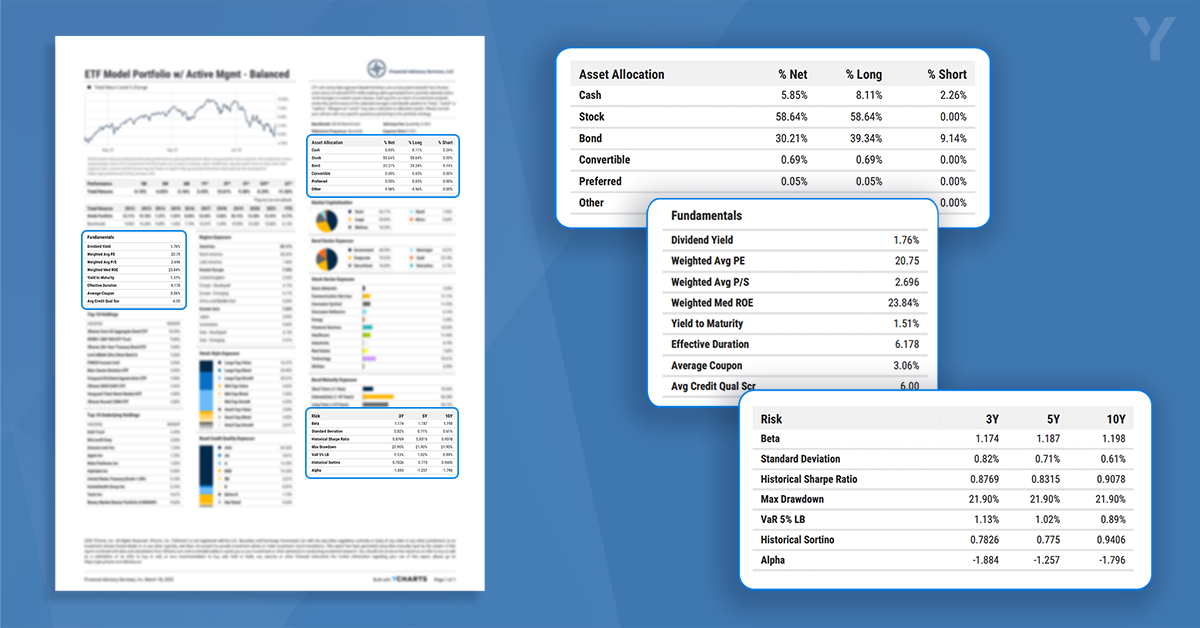
Portfolio fundamentals and risk characteristics—including but not limited to Asset Allocation, Dividend Yield, Effective Duration, Beta, and Sharpe Ratio—give further insight into a strategy’s key benefits. Three, five, and ten-year look backs are included for risk metrics to provide a more holistic understanding of portfolio risk over time.
Take a FREE Trial to Get Started with Tearsheets
Holdings & Underlying Holdings
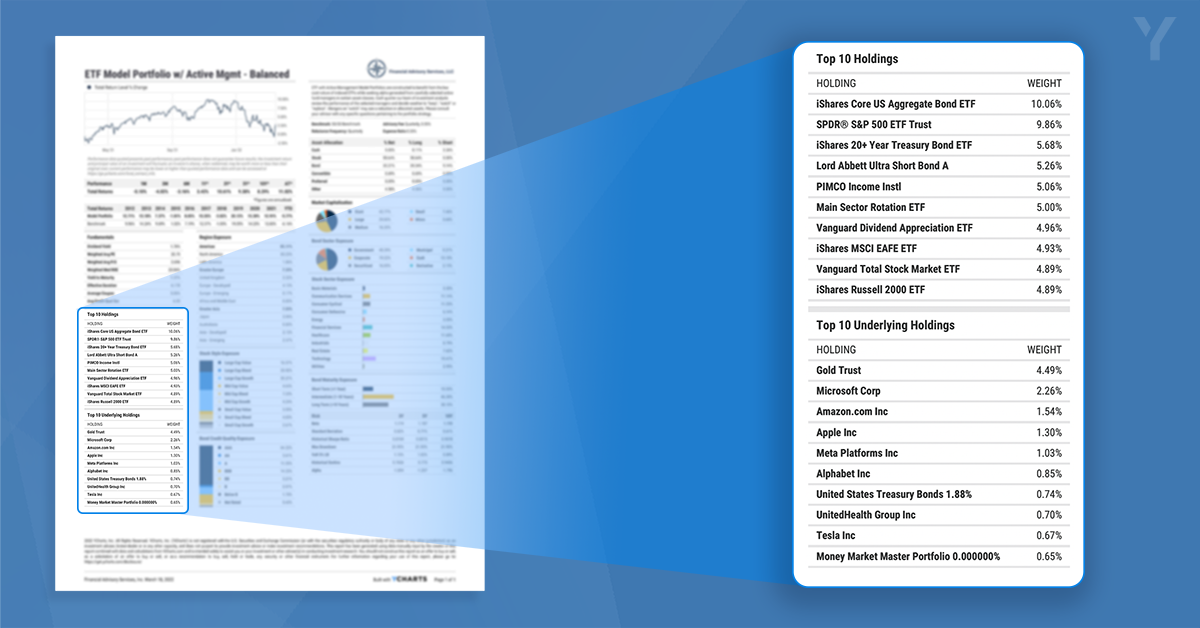
The Tearsheet includes two modules for reviewing portfolio holdings and weights. While the “Top 10 Holdings” section provides the names and weights of ETFs, mutual funds, or other held security types, the “Top 10 Underlying Holdings” module goes a step further.
Highlighting to clients and prospects the individual names that a portfolio is actually invested in, “Top 10 Underlying Holdings” show your true, combined exposure to stocks and bonds across all fund holdings.
Schedule a Demo to See Tearsheets in Action
Exposure Data
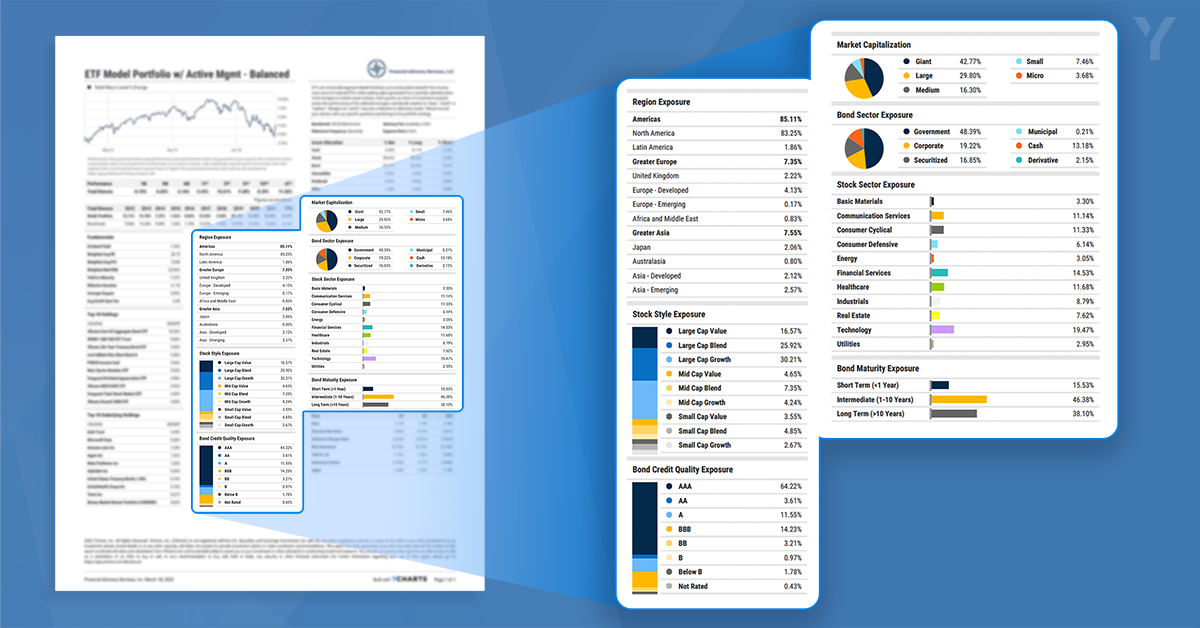
Your portfolio’s exposure to different geographic regions, stock styles, stock & bond sectors, and bond credit qualities are broken down visually in the Tearsheet’s center and right-center modules.
When discussing a portfolio’s top-line performance, exposure data is valuable for identifying contributors to returns and risk across trending sectors, value vs. growth, market caps, relatively risky or stable bonds, and more.
Take a FREE Trial to Get Started with Tearsheets
Connect with YCharts
Much like the advisors and asset managers we serve, we pride ourselves on listening to and understanding our clients’ needs.
The new One-Page Portfolio Tearsheets are available to YCharts Professional users. For questions or feedback, reach out to your account manager.
Not a YCharts user? Sign up for a 7-Day Free Trial or contact us via email at hello@ycharts.com and by phone at (866) 965-7552 to learn more.
Disclosure
©2022 YCharts, Inc. All Rights Reserved. YCharts, Inc. (“YCharts”) is not registered with the U.S. Securities and Exchange Commission (or with the securities regulatory authority or body of any state or any other jurisdiction) as an investment adviser, broker-dealer or in any other capacity, and does not purport to provide investment advice or make investment recommendations. This report has been generated through application of the analytical tools and data provided through ycharts.com and is intended solely to assist you or your investment or other adviser(s) in conducting investment research. You should not construe this report as an offer to buy or sell, as a solicitation of an offer to buy or sell, or as a recommendation to buy, sell, hold or trade, any security or other financial instrument. For further information regarding your use of this report, please go to: ycharts.com/about/disclosure.
Next Article
New on YCharts: Heat Maps for Stocks, Indices & SectorsRead More →
