Economic Update — Reviewing Q4 2021
After a flat Q3 for equities, the bull market ended 2021 with a bang. (Spoiler alert: 2022 is off to a rough start.)
In the fourth quarter of 2021, the S&P 500 charged 11% higher. The NASDAQ rose 8.5%, while the Dow finished Q4 up 7.9%.
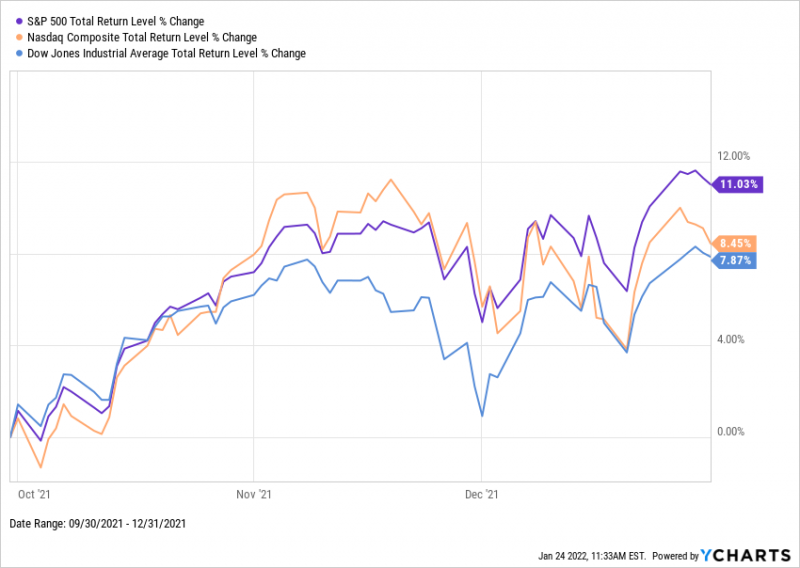
Download Visual | Modify in YCharts
For the year, the S&P 500 logged a total return of 28.7%, while the NASDAQ rose 22.2% and the Dow ended 2021 up 21% (How about that!).
There’s no doubt 2021 was one of the best years on record for US equities. In fact, as we noted in our 2021 Fund Flows Report, this is the fifth year the S&P 500 has posted double-digit returns out of the last six. But as the first three weeks of 2022 have demonstrated, the economic landscape can flip in the blink of an eye. Volatility is sometimes inevitable, but being up to date on the latest trends and data can help quell clients’ nerves and keep investment portfolios afloat.
Below are some takeaways from the YCharts Q4 2021 Economic Update. The deck, published quarterly, arms advisors and investors with key insights from the previous quarter to help you make smarter investment decisions going forward. Furthermore, the deck is easily customizable with your own firm branding to be leveraged in client communications.
For a full review of the quarter, please join us Thursday, February 10th as we break down the major economic and market trends from Q4 2021, including how to white-label the Economic Summary Deck as your own for presenting to clients and prospects.
Want the Economic Update slide deck sent straight to your inbox? Subscribe here:
Asset Class Performance
Out of the 11 asset classes listed below, Emerging Markets was the only one to go negative in Q4. The 1.2% drop is largely attributed to the MSCI China index falling 6.1% in Q4, as it comprises nearly one-third of the MSCI Emerging Markets index. Conversely, Real Estate continued its year-long tear in Q4. The Dow Jones US Real Estate Index rose 14.6% as investors looked to property and income-generating assets as a play against high inflation.
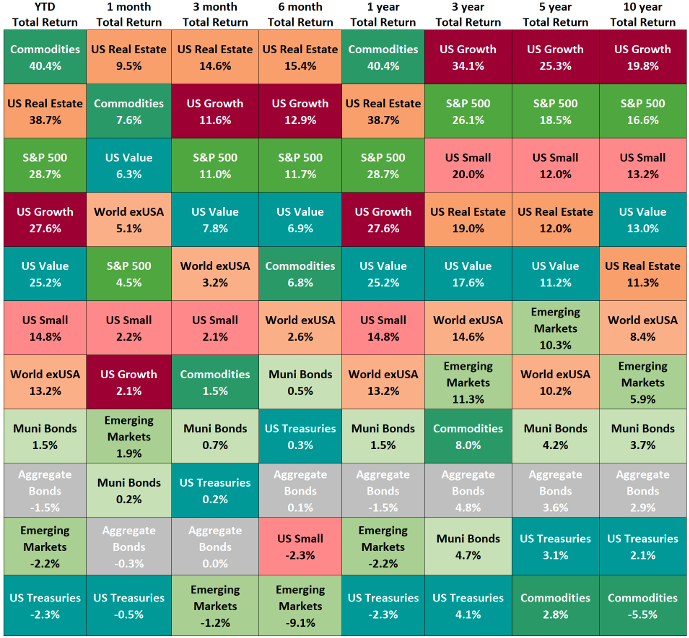
Click to Download Asset Class Table
In terms of US stocks, the Russell 1000 Growth index outperformed its Value counterpart by 3.8 points in Q4 to finish the year 2.4 points higher than Value. Around the globe, MSCI’s World exUSA index notched 3.2% higher to end 2021, which lagged behind US equities but significantly outperformed Emerging Markets.
Finally, bond returns continued to lag relative to the group as yields, especially short-term rates, have climbed higher. US Treasuries and Aggregate Bonds lost value in 2021, and only Municipal Bonds could muster a 1.5% gain.
CPI, Core CPI Set New 20-Year Highs
Inflation has been on everyone’s radar in 2021, and Q4 further exacerbated the concern over rising prices across a wide variety of goods. At the start of 2021, both the US Consumer Price Index and US Core Consumer Price Index were below 2%. At year’s end, CPI was 7% while Core CPI (CPI less food and energy prices) clocked in at 5.5%. This represents growth of 416.6% and 240% in these figures, respectively, in just one calendar year.
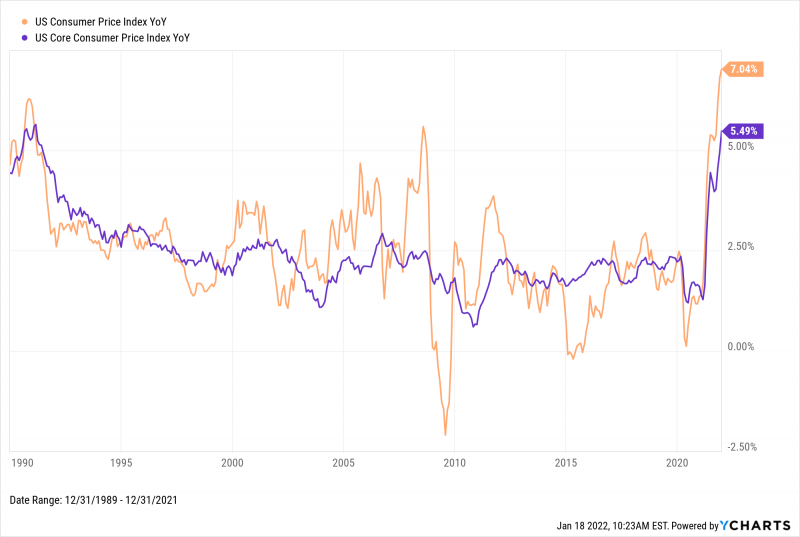
Download Visual | Modify in YCharts
YCharts users—download the full deck in the Support Center. Not a current client? Reach out to get access, or enter your email below to receive a free version of the deck:
Get the Economic Update slide deck sent straight to your inbox by subscribing here:
Connect with YCharts
To get in touch, contact YCharts via email at hello@ycharts.com or by phone at (866) 965-7552
Interested in adding YCharts to your technology stack? Sign up for a 7-Day Free Trial.
Disclaimer
©2022 YCharts, Inc. All Rights Reserved. YCharts, Inc. (“YCharts”) is not registered with the U.S. Securities and Exchange Commission (or with the securities regulatory authority or body of any state or any other jurisdiction) as an investment adviser, broker-dealer or in any other capacity, and does not purport to provide investment advice or make investment recommendations. This report has been generated through application of the analytical tools and data provided through ycharts.com and is intended solely to assist you or your investment or other adviser(s) in conducting investment research. You should not construe this report as an offer to buy or sell, as a solicitation of an offer to buy or sell, or as a recommendation to buy, sell, hold or trade, any security or other financial instrument. For further information regarding your use of this report, please go to: ycharts.com/about/disclosure
Next Article
2021 Fund Flows: Fixed Income & Large Blend Win, Growth LosesRead More →