The Best Performing Mutual Funds in Each Category and How to Find Them
When putting together an investment portfolio, whether for yourself or on behalf of a client, finding “best of breed” mutual funds is a worthwhile and pivotal exercise. As the universe of mutual funds continues to expand, better performing funds with optimized strategies and lower fees are always emerging.
The exercise of finding the best-performing mutual funds becomes especially vital in times of a market downturn. Many advisors might reshape their preferred fund metrics in 2022 in an effort to reduce risk and loss of principal for client portfolios; as an example, prioritizing funds with lower standard deviation or max drawdown over higher total NAV return or alpha. Volatility in the broader market has been on the rise recently, as represented by the SPDR S&P 500 ETF Trust (SPY):
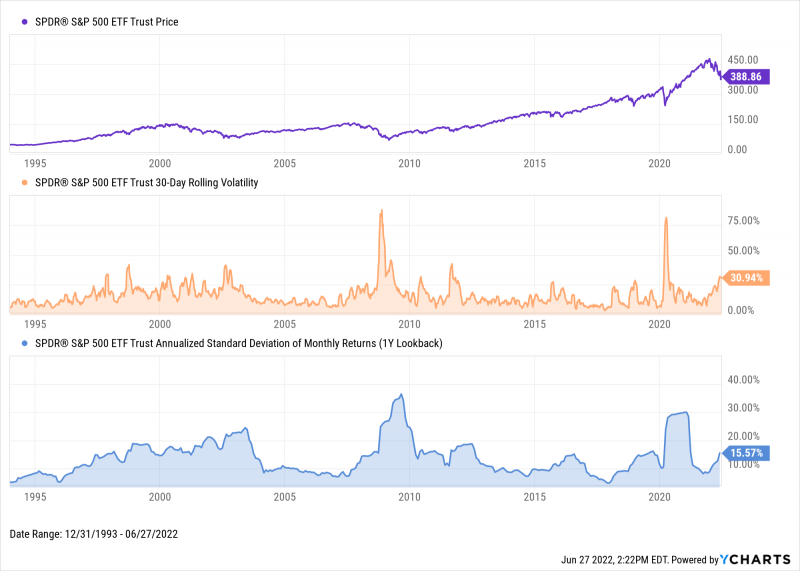
Download Visual | Modify in YCharts
So how can advisors and investors find the best funds and managers to fit their needs? And how does one stay abreast of their ever-changing options?
(Disclaimer: This blog is meant for educational purposes only and is not intended to be used as investment advice.)
Best Performing Mutual Funds by Category
The below lists of best-performing mutual funds by category were identified using the YCharts Fund Screener.
Equity Style Mutual Funds
Download Visual | Modify in YCharts
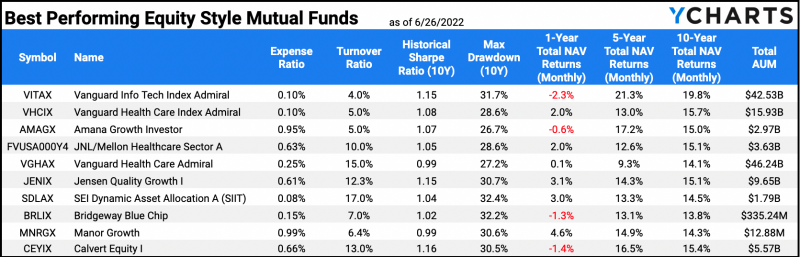
The Screener identified US-based equity style mutual funds that rank in the top 50% of all funds for 1-year, 5-year, & 10-year total NAV returns, Sharpe ratio, and a low expense ratio, turnover ratio, and max drawdown. Then, an objective Scoring Model was added to rank the screen results using an equal-weighted score that considers the above metrics. Only the top ten ranked securities were extracted.
These are the best-performing equity style mutual funds as of 6/26/2022:
Sector Equity Mutual Funds
Download Visual | Modify in YCharts
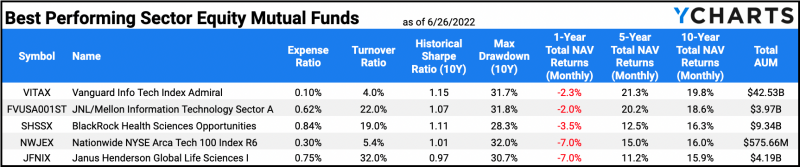
The Screener identified US-based sector equity mutual funds that rank in the top 50% of all funds for 1-year, 5-year, & 10-year total NAV returns, Sharpe ratio, and a low expense ratio, turnover ratio, and max drawdown. Results are sorted using an equal-weighted Scoring Model that includes all metrics mentioned above.
These are the best-performing sector equity mutual funds as of 6/26/2022:
Inflation-Protected Bond Mutual Funds
Download Visual | Modify in YCharts
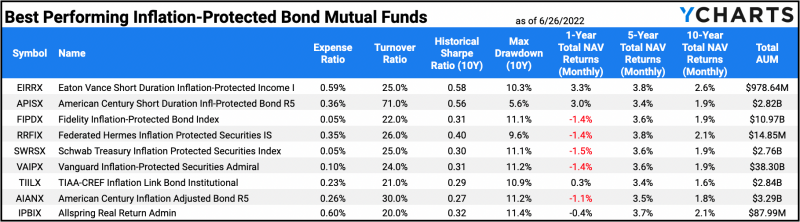
The Screener identified US-based inflation-protected bond mutual funds that rank in the top 75% of all funds for 1-year, 5-year, & 10-year total NAV returns, Sharpe ratio, and a low expense ratio, turnover ratio, and max drawdown. Then, an objective Scoring Model was added to rank the screen results using an equal-weighted score that considers the above metrics.
These are the best-performing inflation-protected bond mutual funds as of 6/26/2022:
Long-Term Bond Mutual Funds
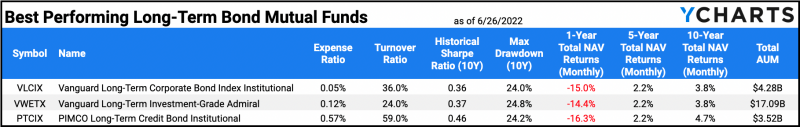
Download Visual | Modify in YCharts
The Screener identified US-based long-term bond mutual funds that rank in the top 80% of all funds for 10-year total NAV returns, Sharpe ratio, and a low expense ratio, turnover ratio, and max drawdown. Results are sorted using an equal-weighted Scoring Model that includes all metrics mentioned above.
These are the best-performing long-term bond mutual funds as of 6/26/2022:
Short-Term Bond Mutual Funds
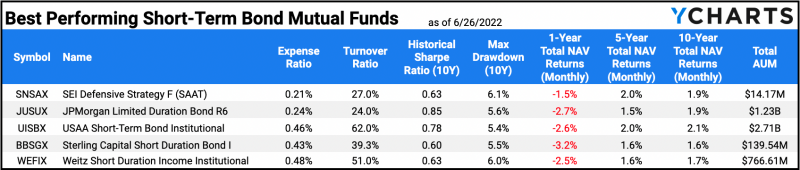
Download Visual | Modify in YCharts
The Screener identified US-based short-term bond mutual funds that rank in the top 75% of all funds for 1-year, 5-year, & 10-year total NAV returns, and the top 50% for a high Sharpe ratio, low expense ratio, low turnover ratio, and low max drawdown. Results are sorted using an equal-weighted Scoring Model that includes all metrics mentioned above.
These are the best-performing short-term bond mutual funds as of 6/26/2022:
Alternative Funds
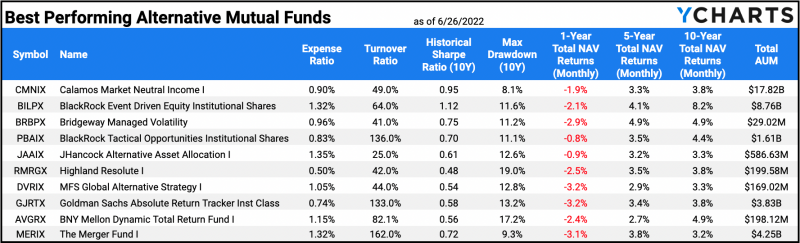
Download Visual | Modify in YCharts
The Screener identified US-based alternative mutual funds that rank in the top 75% of all funds for 1-year, 5-year, & 10-year total NAV returns, Sharpe ratio, and a low expense ratio, turnover ratio, and max drawdown. Results are sorted using an equal-weighted Scoring Model that includes all metrics mentioned above.
These are the best-performing alternative mutual funds as of 6/26/2022:
Allocation Mutual Funds
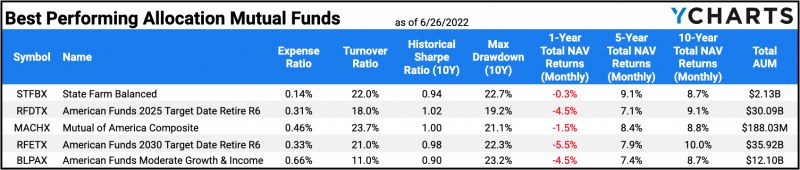
Download Visual | Modify in YCharts
The Screener identified US-based allocation mutual funds that rank in the top 50% of all funds for 1-year, 5-year, & 10-year total NAV returns, Sharpe ratio, and a low expense ratio, turnover ratio, and max drawdown. Results are sorted using an equal-weighted Scoring Model that includes all metrics mentioned above.
These are the best-performing allocation mutual funds as of 6/26/2022:
Factors to Consider When Picking Mutual Funds
With so many mutual funds on the market (there are more than 46,000+ on YCharts alone), how can anyone answer the question, “What are the best mutual funds?”
When selecting a mutual fund, or any security, the biggest trap to avoid is chasing returns.
Investors typically chase returns when they invest in a mutual fund (or stock, ETF, etc.) because it has large historical returns. However, smart, data-driven investors know that past performance is no indication of future results.
Past performance can certainly be one factor that you evaluate when choosing a mutual fund, but there are other factors to consider as well.
Before diving into the quantitative aspects, you should consider which mutual fund is best for you by considering your own strategy, investing goals, and risk tolerance.
Additionally, while some mutual funds invest only in technology companies, others focus on emerging economies. Mutual funds differ not only in their strategies, but also with regard to sectors, geographies, and company sizes. You should first decide what category of fund is right for you, then compare funds within that category.
Key Metrics to Evaluate Mutual Funds
Let’s break down the metrics and details used that every fund investor should pay attention to.
• Expense Ratio — how much of a fund’s assets are used for administrative and operating expenses such as fund manager compensation and auditing fees; expense ratio represents these costs as a percentage of the fund’s total assets; lower is better
• Turnover Ratio — the percentage of a fund’s holdings that have been replaced in a given year (or another period); because fund managers pay to execute trades, funds with higher turnover ratios incur greater costs, which are passed on to investors; lower is better
• Total Return — the actual rate of return of an investment over a given period; total return includes interest, capital gains, dividends, and distributions over that time; higher is better
• Alpha — a performance measure that indicates the excess return of an investment against a chosen market index or benchmark; higher is better
• Sharpe Ratio — a measure of the risk-adjusted return for a given investment; Sharpe ratio isolates an investment’s profits associated with risk-taking activities; higher is better
• Max Drawdown — an indicator of downside risk over a specified period; max drawdown is the maximum observed loss from a fund’s peak to its trough before a new peak is reached; lower is better
By identifying and understanding the best metrics for evaluating funds, we are one step closer to finding the best funds to invest in.
Using YCharts to Find the Best Mutual Funds for You
Identify the Best Mutual Funds in Every Category
Starting in the YCharts Fund Screener, create a list of funds for each category that you want to explore. You can create, then save lists for multiple fund categories by changing only one filter, “Category Name,” in the Fund Screener. For example, we’re looking into the Intermediate Core-Plus Bond category.
From this view in the Fund Screener, you can quickly pivot to any other mutual fund category simply by changing the category filter we just created, to “Large Cap Growth,” for example.
Modify in the YCharts Fund Screener
(Note: YCharts uses Morningstar Categories to separate funds by style of composition and to help investors make meaningful comparisons between funds.)
Draw Direct Comparisons using Comp Tables
Now we’ll open our list of Intermediate Core-Plus Bond funds in YCharts’ Comp Tables. To see a comparison table of sortable data for each fund in the category, we’ll add the aforementioned six key metrics for evaluating mutual funds: expense ratio, turnover ratio, total return, alpha, Sharpe ratio, and max drawdown.
We can now compare funds based on any of the six metrics we added, which helps identify a funds’ strengths and weaknesses. But why evaluate funds on only one metric when you could combine them all to make a single, data-driven score that will streamline your investment decisions?
Create Objective Rankings with Scoring Models
Below, we use a YCharts feature called Scoring Models to choose the metrics we find valuable and the percent-weight we want to apply to each factor. Scoring Models will combine the key metrics at our assigned weights to arrive at a single numerical score, with 1 being the best-ranking option, for each mutual fund in our list.
Learn About YCharts Scoring Models
In the Scoring Model shown above, Total Return is weighted 30%, while Expense Ratio and Sharpe Ratio are both weighted 20%. While this example strategy emphasizes these three metrics, your own strategy might put more weight on other metrics like Alpha or Max Drawdown. We now know which Intermediate Core-Plus Bond funds are the best fits for our strategy.
Create a Watchlist & Dive Deeper with Visual Analysis
Using our list of Best-Performing Equity Mutual Funds, start in the Fund Screener and save your screened list as a watchlist. From there you can head to Fundamental Charts to perform a visual analysis. With YCharts’ fully integrated tools, users can seamlessly load a watchlist into Fundamental Charts and flip through it while comparing it dynamically against any of their currently held funds.

Let’s say for instance that you currently hold both USAA NASDAQ-100 Index (USNQX) and Rydex NASDAQ-100 A (RYATX) funds, but want to understand how these NASDAQ-100 index-tracking funds stack up to previously screened results. Comparing them to the Vanguard Information Technology Admiral Index (VITAX), from our list of best-performing equity style funds, we can see that VITAX outperforms both USNQX and RYATX on both total return and standard deviation over a 5-year period. Even with the recent drawdowns in 2022, VITAX is up 151.1% compared to just 114.8% for USNQX and 102.4% for RYATX, respectively, and has the lowest volatility with a standard deviation of 68.7%.
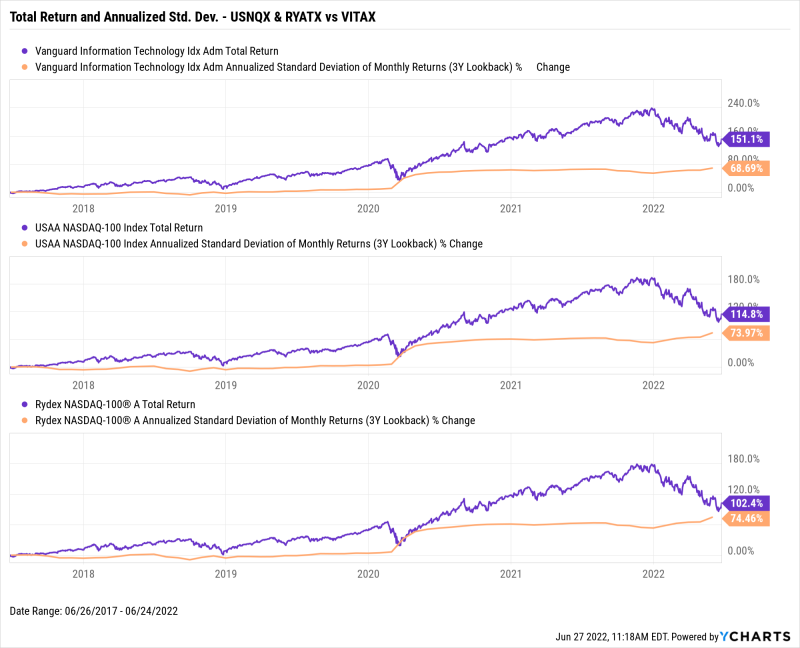
Download Visual | Modify in YCharts
If your investment strategy tries to balance high returns with minimal drawdowns, Fidelity’s FSCSX fund might be the one for you in this case. If your strategy emphasizes other metrics, Fundamental Charts can plot historical values for more than 4,000 stock and fund metrics.
Compare Metrics of Multiple Funds Using Scatter Plot
Add an extra layer of visual analysis using our Scatter Plot tool, which can be used to lay out many funds on an X-Y axis of financial metrics. For example, the list of Best-Performing Equity Mutual Funds can be plotted along with the nine Best-Performing Inflation-Protected Bond Mutual Funds to illustrate how much they differ between annualized risk and return on a 5-year lookback.
To further drill down on a subset of funds, simply click-to-zoom on a cluster of dots, and hover over each individual fund to view its risk vs. return metrics.
Generate Custom Comparison Reports
FINRA-reviewed Comparison PDF Reports analyze and compare portfolios, mutual funds, and other securities within Fund Screener using clean and client-friendly visuals in a PDF format. Reports are also customizable with your firm’s logo, colors, and disclosures.
Use Side-by-Side Comparison Reports to examine the performance, key metrics, and holdings of two mutual funds, like the Bridgeway Managed Volatility (BRBPX) and BlackRock Event Driven Equity Instl (BILPX) funds from the best-performing alternative mutual funds list. BILPX has outperformed during the last 10 years, but BRBPX currently shows better performance year-to-date. This Mutual Fund Comparison report is generated within seconds, saving you time and energy to focus your attention on other tasks. This Mutual Fund Comparison report is generated within seconds, saving you time and energy, allowing you to focus your attention on other tasks.
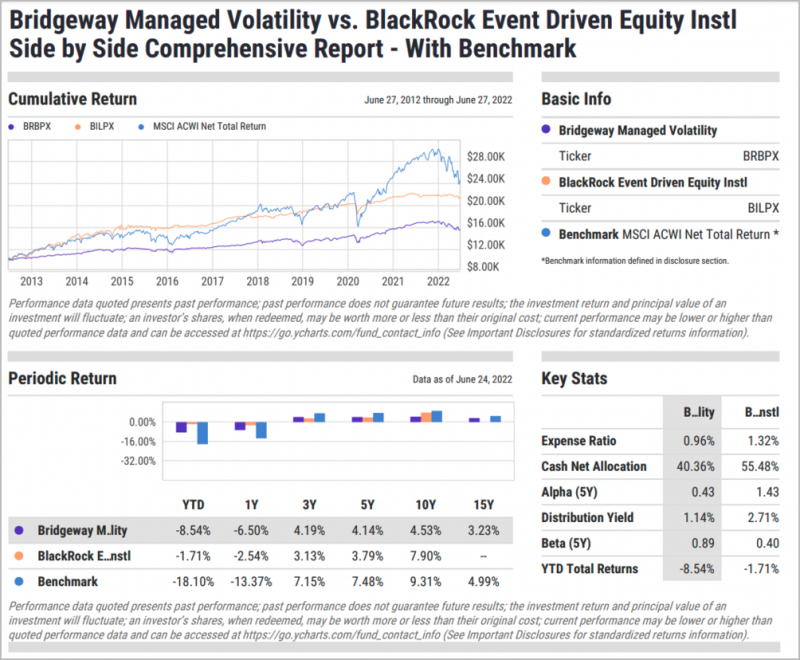
View Side-by-Side Comparison Report
Evaluate Mutual Funds faster with Pre-built Quickflows
YCharts Quickflows leverage already powerful tools and data to conduct higher quality research in less time. Based on investment research best practices and the most common workflows, our Quickflows blog demonstrates how to automate your analyses.
For example, the Equity Style Exposure Quickflow compares holdings of multiple mutual funds based on their allocations to Morningstar’s nine equity style boxes. Click here to see an example using the top 5 fixed income mutual funds identified previously. Other examples include:
• Bull Bear Market Returns Comparison: Analyzes total return during bull/bear market periods.
• Fund Flows Comparison: Compares fund inflows and outflows for different periods (1-month thru 15 Years)
• Sector Exposure: Compares funds based on their allocations to Morningstar’s sector classification.
Getting Started with Data-Driven Research
There’s a lot more to picking the best mutual funds than just looking at historical returns.
That’s why mutual fund investors need to take a data-driven approach that evaluates investment options using the key metrics outlined above.
Additionally, investors should make sure that a fund’s category, objective, and holdings align with their investment objectives. For example, investors with a very high-risk appetite might prefer to evaluate growth equity funds instead of the funds outlined in this post. (Don’t worry, you can still do that in YCharts!)
To answer the opening question—”What are the best mutual funds?”— we’ll say that “best” is in the eye of the investor.
Connect With YCharts
To get in touch, contact YCharts via email at hello@ycharts.com or by phone at (866) 965-7552
Interested in adding YCharts to your technology stack? Sign up for a 7-Day Free Trial.
Disclaimer
©2022 YCharts, Inc. All Rights Reserved. YCharts, Inc. (“YCharts”) is not registered with the U.S. Securities and Exchange Commission (or with the securities regulatory authority or body of any state or any other jurisdiction) as an investment adviser, broker-dealer or in any other capacity, and does not purport to provide investment advice or make investment recommendations. This report has been generated through application of the analytical tools and data provided through ycharts.com and is intended solely to assist you or your investment or other adviser(s) in conducting investment research. You should not construe this report as an offer to buy or sell, as a solicitation of an offer to buy or sell, or as a recommendation to buy, sell, hold or trade, any security or other financial instrument. For further information regarding your use of this report, please go to: ycharts.com/about/disclosure
Next Article
New on YCharts: ESG Data for Stocks, ETFs & Mutual FundsRead More →