Q3 2022 Fund Flows: Investors Sound the Recession Alarm, Move into Money Markets, Flee Fixed Income
In the third quarter of 2022, we saw: the Federal Reserve hike rates twice by 75 basis points, the U.S. 10-Year Treasury Rate increase from a low of 2.6% in August to nearly 4% by the end of September, and the 30-Year Mortgage Rate tick up drastically from 5 to nearly 7%.
The VIX has also been on a tear. The “fear index” has surpassed 30 a number of times this year, and most recently in early October. The S&P 500 (^SPX) and Bloomberg US Aggregate (^BBUSATR) both hit annual lows to end the quarter even as inflation began to seemingly taper off.

Download Visual | Modify in YCharts
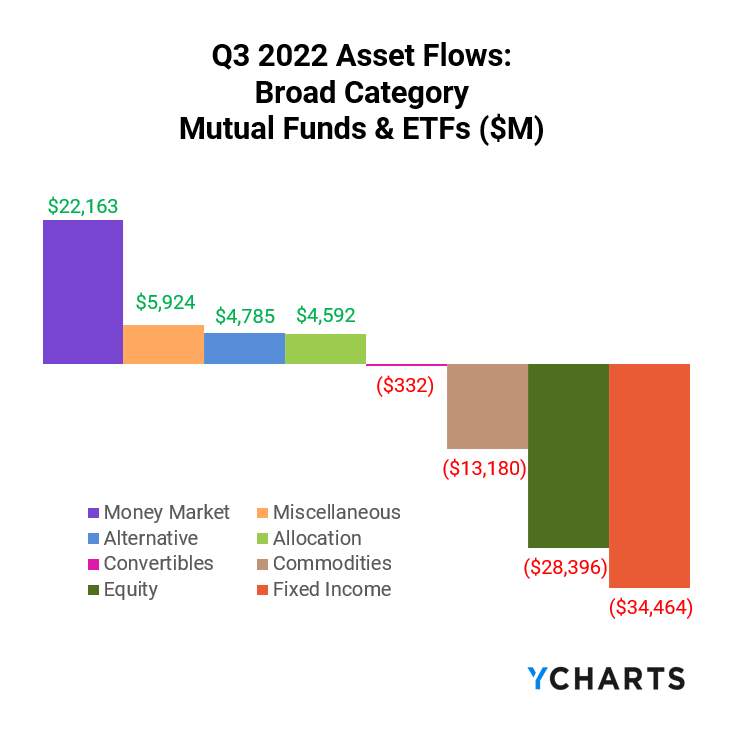
With most investors anticipating additional rounds of rate hikes from the Federal Reserve, mindsets have shifted towards a flight to safety. The market collectively pulled nearly $34.5B from Fixed Income funds and instead parked their cash in Money Market funds.

Fund flows are the net cash inflow into a fund (purchases) or net outflow from a fund (redemptions). Irrespective of fund performance, when a mutual fund or ETF has positive fund flows (or net issuances for ETFs) in a given period, that fund’s managers then have more cash to buy more holdings. The opposite is also true: as fundholders sell shares, fund managers sell out of positions and use the cash to pay redemptions.
This means that fund flow data can indicate higher or lower demand for different asset types, depending on which funds and categories have relatively large inflows or outflows.
Are you discussing fund flows with advisors and clients? Reach out to see how YCharts improves the quality and efficiency of your sales conversations.
Mutual Fund Flows: Biggest Winners and Losers
Investor sentiment reversed course in Q3 as Money Market mutual funds experienced a surge of $22.1B in net inflows after last period’s $58.2B outflows. Additionally, Target-Date Retirement mutual funds added $16.7B in new assets, a proof point that long-term investors are playing the current market pullback.
Additionally, US investors seemed to have lost some confidence in domestic markets as $4.9B was moved into Foreign Large Blend mutual funds. International stocks have been similarly beat-up in 2022, so this might be read as a diversification trend, or just more opportunistic buying.
Large Growth and Short-Term Bond mutual funds took a hit this past quarter as investors sought to avoid rate-sensitive asset classes. A combined $37B was redeemed from Large Growth and Foreign Large Growth, as well as a combined $33.5B from Short-Term Bond and Ultrashort Bond mutual funds. Overall, the market is expecting tighter economic conditions as the Fed raises rates and reduces liquidity with aims of controlling inflation.

ETF Flows: Biggest Winners and Losers
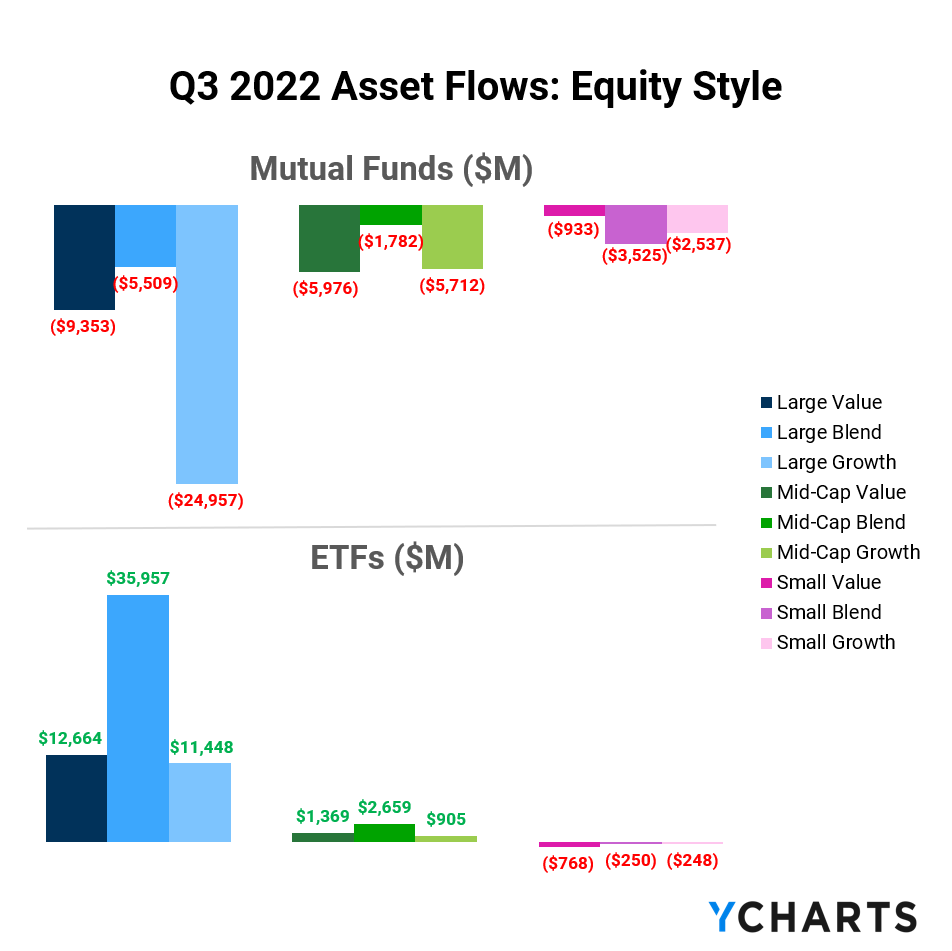
Large Cap ETFs were this quarter’s biggest winners with the Blend, Value, and Growth categories combining for over $60B in net new assets. Despite poor performance year-to-date, or perhaps in response to it, investors continue to flock toward Large Cap funds.
While fixed income has taken a hit year-to-date, investors are still looking to add fixed-income exposure to their portfolios. The move toward Long Government ETFs with inflows of $13.3B indicates investors may be attempting to lock in attractive rates before a potential retracement.

After hitting a peak of 9.06% to start Q3, inflation has trended lower. Investors responded by pulling $4.1B from Inflation-Protected Bond ETFs. Do investors think inflation has reached a ceiling?
Surprisingly in light of performance, Commodities Focused ETFs experienced outflows of $10B in Q3. The category was a favorite in Q1 and during periods of high inflation. The commodities index S&P GSCI Total Return outpaced the S&P 500 21.8% to -23.87% through the first nine months of the year.

Equity Style Fund Flows and Performance
The table below shows a summation of combined mutual fund and ETF fund flows, plus average category performance, for the nine equity-style boxes.
Large-Cap funds have been hit the hardest and are down the most year-to-date in comparison to their Mid-Cap and Small-Cap counterparts. Investors took advantage of the buying opportunity and funneled $30.4B into Large Blend, and opted to pull $13.5B in net assets from Large Growth, a typically less favorable category during high-interest rate periods.

With Q4 right around the corner, tax planning might have been top-of-mind for some investors. There was a clear preference toward tax-efficient ETFs across all equity-style funds and an equal but opposite trend for corresponding mutual funds.

Investors Evacuate Active Mutual Funds, Lean Into Passive
While this year’s turbulent market might have been just the environment active managers were waiting for, passive funds have continued to receive the lion’s share of investor assets.
Passive mutual funds and ETFs saw an influx of $106.2B in Q3, compared to just $14.9B for actively managed ETFs and net negative flows of $182.2B for active mutual funds.

More Signs Point to an Impending Recession
If investors’ actions in Q3 can tell us anything, it’s their anticipation of an impending recession. With significant moves into Money Market, Long Government, and Utilities funds, the market effectively voiced their reservations. These recession-proofing actions were accompanied by opportunistic buying of some equities — could a market recovery precede the economic recession?
Miss our last webinar covering the latest fund flows trends of Q3 2022? Watch the full replay here:
Connect with YCharts
To learn more, schedule time to meet with an asset management specialist, call us at (773) 231-5986, or email hello@ycharts.com.
Want to add YCharts to your technology stack? Sign up for a 7-Day Free Trial to see YCharts for yourself.
Disclaimer
©2022 YCharts, Inc. All Rights Reserved. YCharts, Inc. (“YCharts”) is not registered with the U.S. Securities and Exchange Commission (or with the securities regulatory authority or body of any state or any other jurisdiction) as an investment adviser, broker-dealer, or in any other capacity, and does not purport to provide investment advice or make investment recommendations. This report has been generated through application of the analytical tools and data provided through ycharts.com and is intended solely to assist you or your investment or other adviser(s) in conducting investment research. You should not construe this report as an offer to buy or sell, as a solicitation of an offer to buy or sell, or as a recommendation to buy, sell, hold or trade, any security or other financial instrument. For further information regarding your use of this report, please go to: ycharts.com/about/disclosure
Next Article
Do ESG Funds Strengthen Investor Portfolios?Read More →

