10 Best Performing REITs & REIT ETFs over the last 10 Years
Updated as of: June 4, 2026
We used the YCharts Fund Screener to identify the best performing real estate investment trusts (REITs) and REIT exchange-traded funds across key lookback periods, including year-to-date, 1, 3, 5, and 10 years.
For insights on how other asset classes have fared during similar periods of price stability, download our latest white paper: Which Asset Classes Perform Best as Inflation is Driven Lower?
Get your copy of “Which Asset Classes Perform Best As Inflation is Driven Lower” here:What is a REIT?
A Real Estate Investment Trust, or REIT, is a company that owns, operates, and/or finances income-producing real estate. It offers individual investors income potential (in the form of dividends) from real estate without buying the properties directly.
REITs function similarly to mutual funds in how they pool and disperse capital across various investments. However, they focus exclusively on real estate assets, such as office buildings, shopping malls, apartments, and warehouses. REITs can specialize in specific types of real estate or have a broader real estate portfolio.
Established in the US by Congress in 1960 via the Cigar Excise Tax Extension, REITs must adhere to regulatory requirements set forth by the SEC, such as investing at least 75% of their total assets in real estate and generating at least 75% of their gross income from property rents or mortgage interest. This structure exempts REITs from corporate income taxes provided they distribute at least 90% of their taxable income to shareholders as dividends, underscoring their appeal as high-yield investment vehicles.
Investors seeking more diversification can access REITs through mutual funds or ETFs, which pool multiple REITs and can provide diversification across various real estate sectors.
The primary benefits of REITs include high income potential and liquidity (compared to traditional real estate investing), making them attractive to everyday investors. However, they also pose risks like interest rate sensitivity, which can influence property values and investment yields. Moreover, the obligation to distribute most of their income limits their ability to reinvest in their business and provide growth opportunities compared to other equities.
Jump to a section:
- Best Performing REITs YTD
- Best Performing REIT ETFs YTD
- Best Performing REITs over the last year
- Best Performing REIT ETFs over the last year
- Best Performing REITs over the last 3 years
- Best Performing REIT ETFs over the last 3 years
- Best Performing REITs over the last 5 years
- Best Performing REIT ETFs over the last 5 years
- Best Performing REITs over the last 10 Years
- Best Performing REIT ETFs over the last 10 years
- What was the Growth of $10,000 in the Best REITs Over the Last 10 Years?
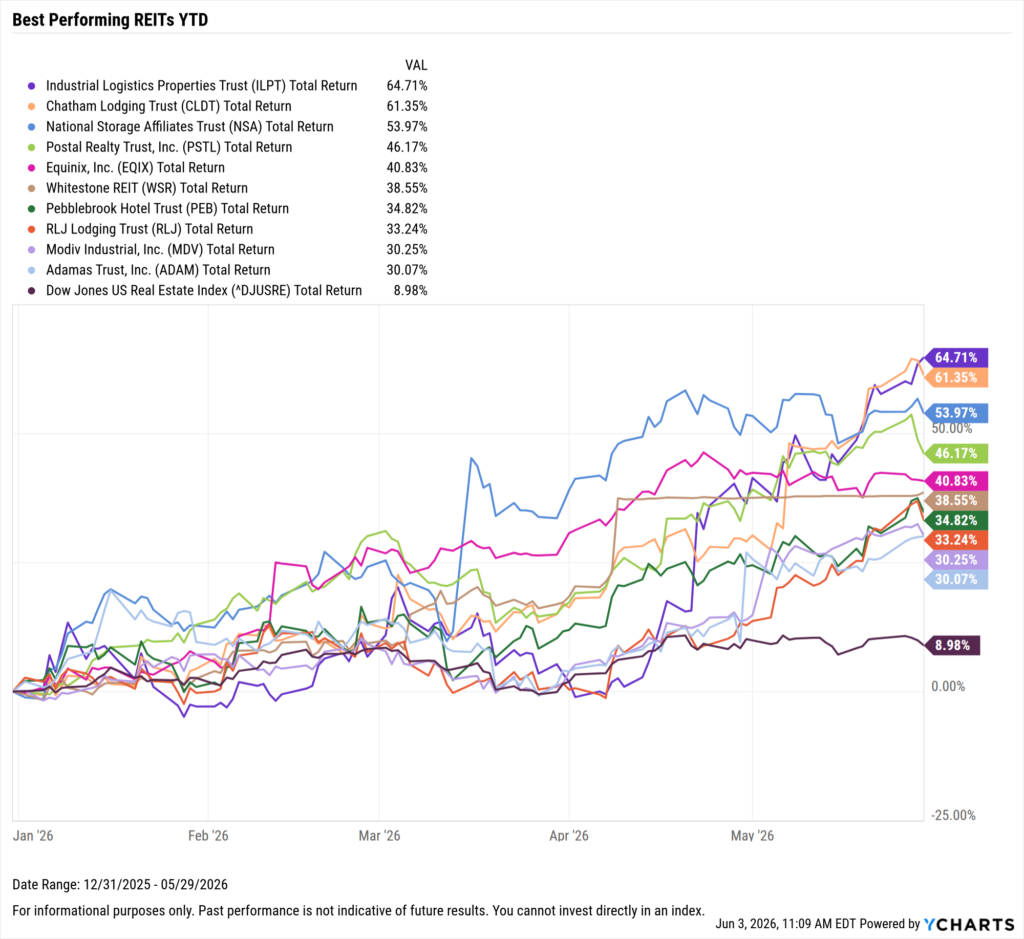
Best Performing REITs YTD
These are the top-performing REITs year-to-date in 2026, through May 31, 2026.
Start a Free Trial to See Full Rankings | Modify the Screen in YCharts
Download Visual | Modify in YCharts
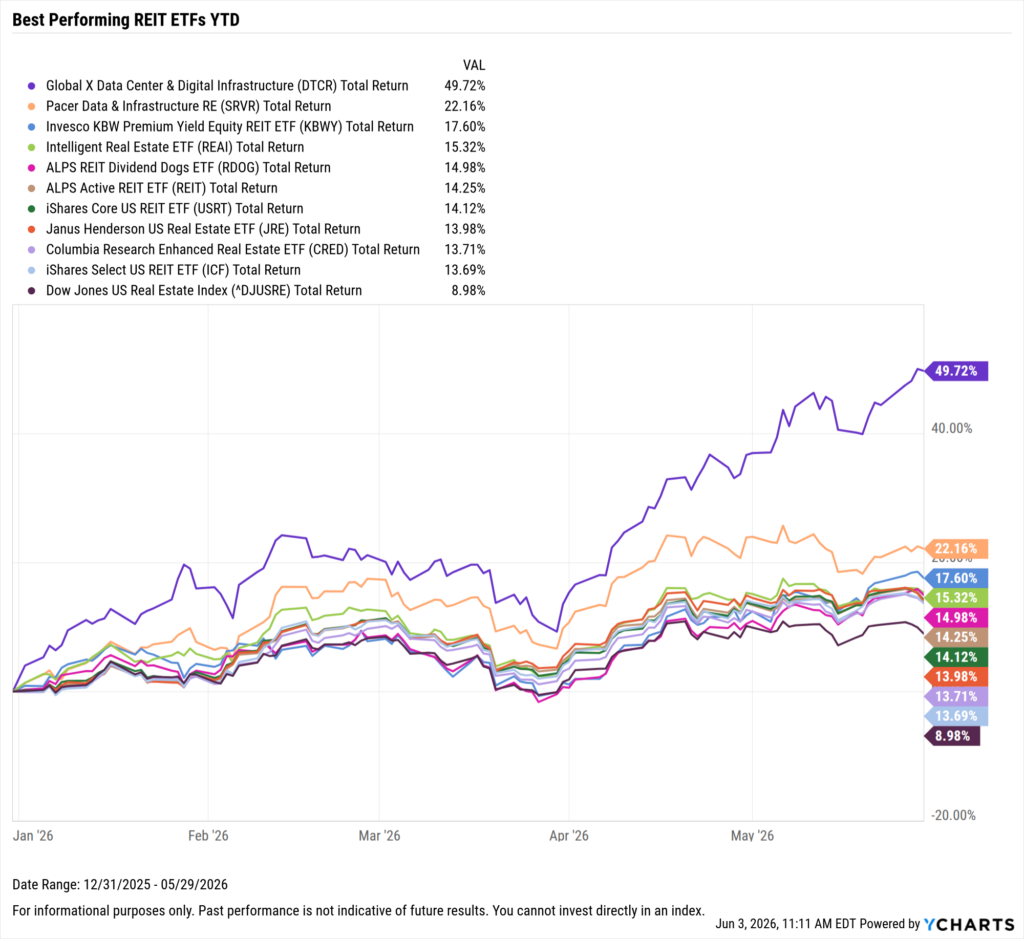
Best Performing REIT ETFs YTD
These are the top-performing REIT ETFs year-to-date in 2026, through May 31, 2026. If you’re interested in the best-performing ETFs overall over the last 10 years, check out this article.
Start a Free Trial to See Full Rankings | View & Modify in Fund Screener
Download Visual | Modify in YCharts
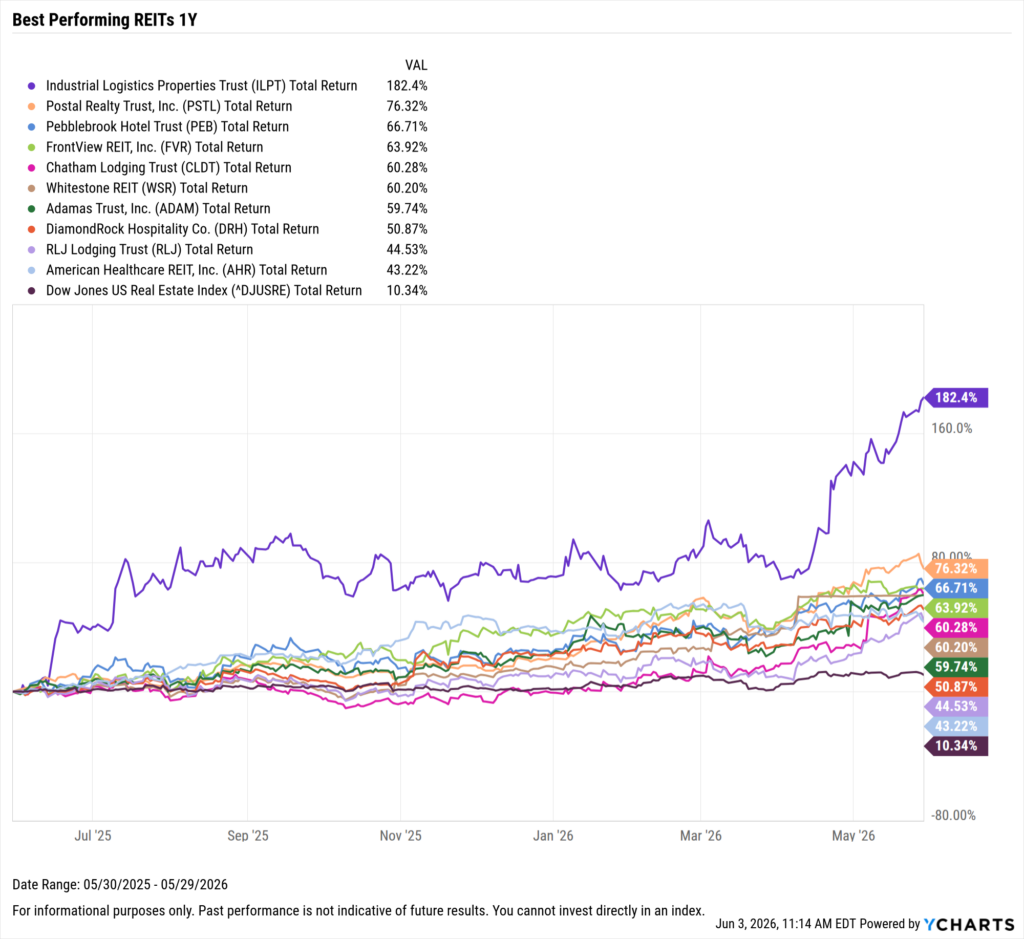
Best Performing REITs over the Last Year
These are the top-performing REITs over the last year, as of May 31, 2026.
Start a Free Trial to See Full Rankings | Modify the Screen in YCharts
Download Visual | Modify in YCharts
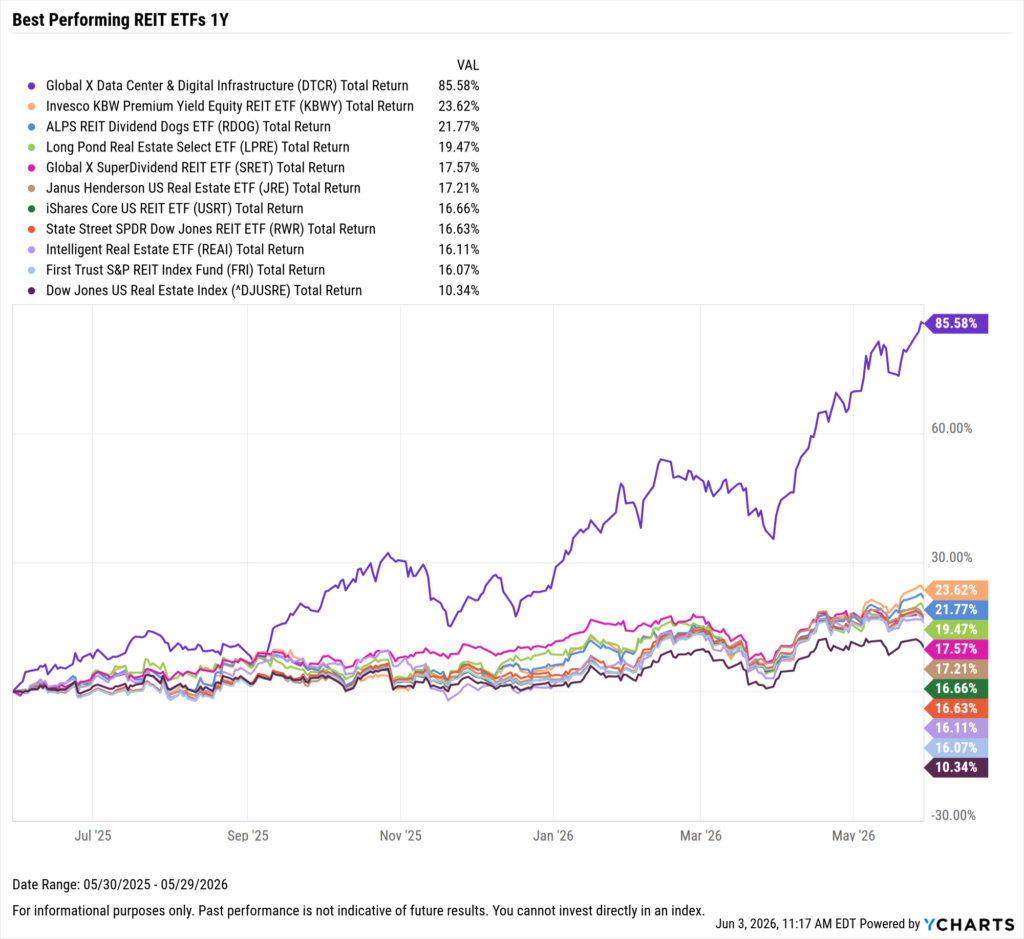
Best Performing REIT ETFs over the Last Year
These are the top-performing REIT ETFs over the last year, as of May 31, 2026.
Start a Free Trial to See Full Rankings | View & Modify in Fund Screener
Download Visual | Modify in YCharts
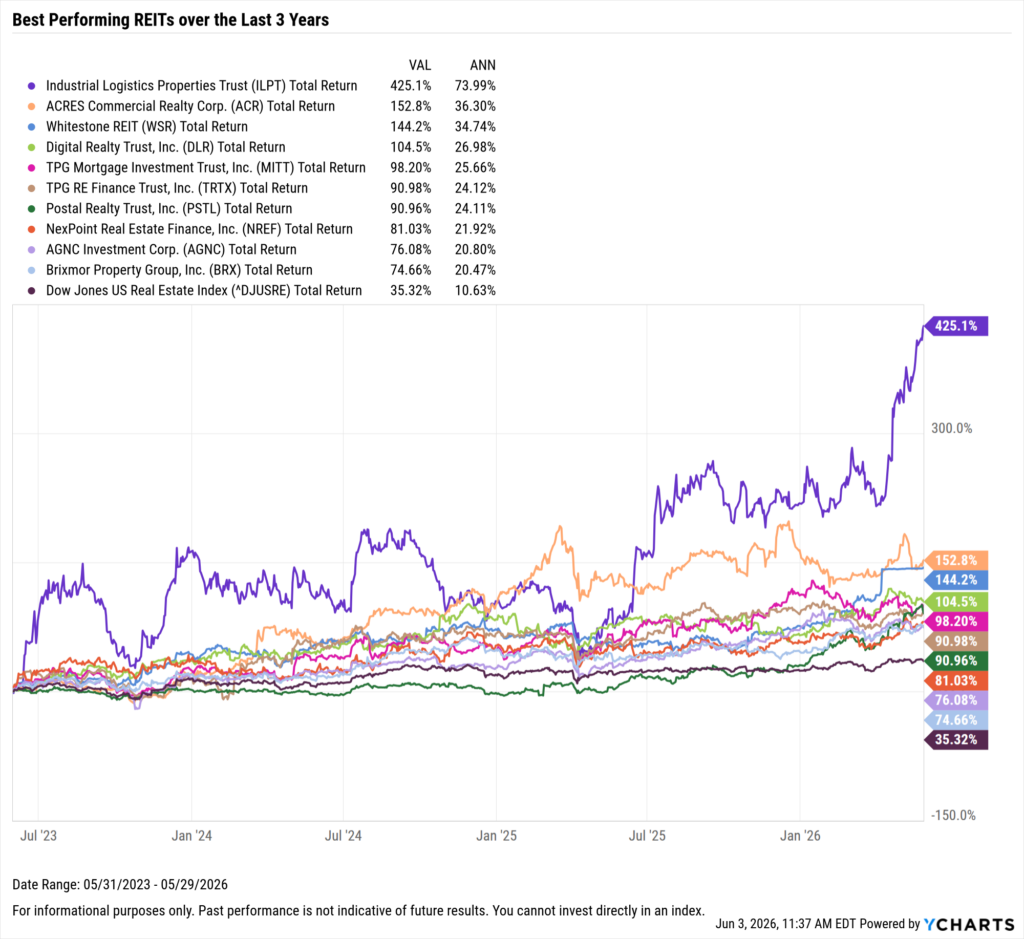
Best Performing REITs over the Last 3 Years
These are the top-performing REITs on an annualized basis between June 1, 2023, and May 31, 2026.
Start a Free Trial to See Full Rankings | Modify the Screen in YCharts
Download Visual | Modify in YCharts
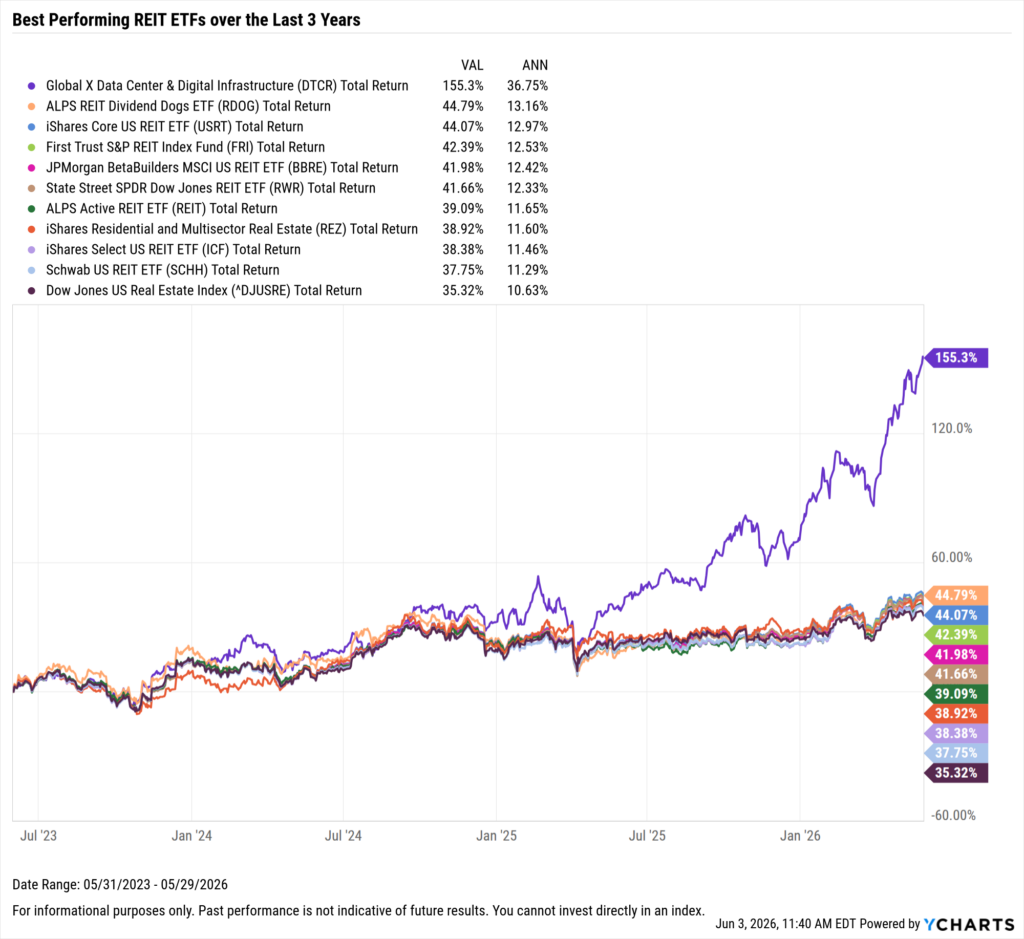
Best Performing REIT ETFs over the Last 3 Years
These are the top-performing REIT ETFs on an annualized basis between June 1, 2023, and May 31, 2026.
Start a Free Trial to See Full Rankings | View & Modify in Fund Screener
Download Visual | Modify in YCharts
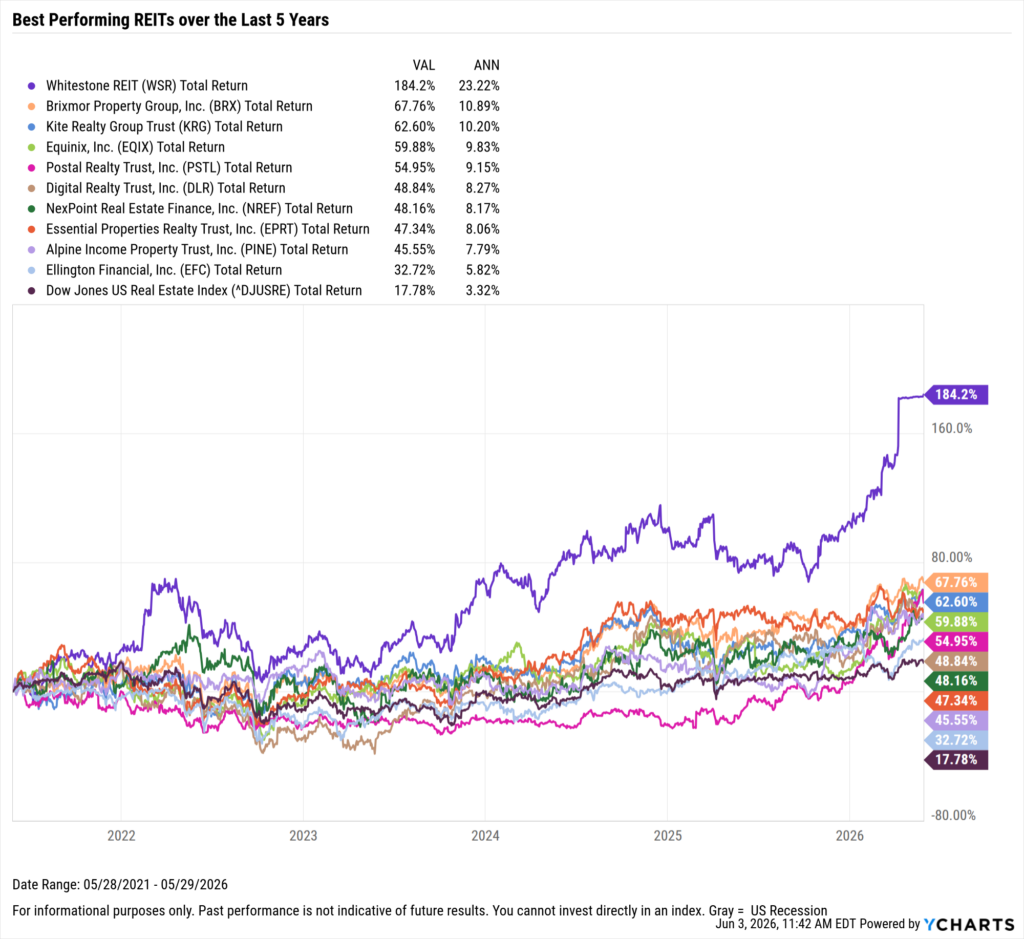
Best Performing REITs over the Last 5 Years
These are the top-performing REITs on an annualized basis between June 1, 2021, and May 31, 2026.
Start a Free Trial to See Full Rankings | Modify the Screen in YCharts
Download Visual | Modify in YCharts
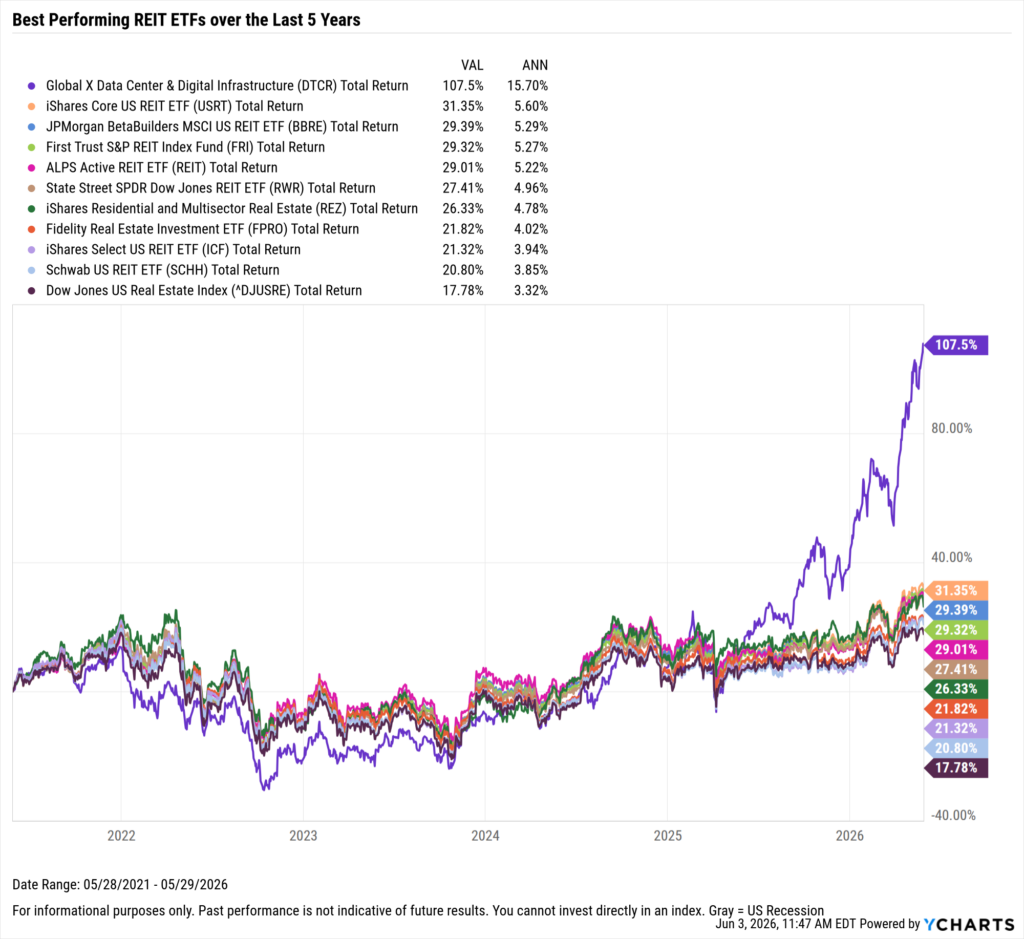
Best Performing REIT ETFs Over the Last 5 Years
These are the top-performing REIT ETFs on an annualized basis between June 1, 2021, and May 31, 2026.
Start a Free Trial to See Full Rankings | View & Modify in Fund Screener
Download Visual | Modify in YCharts
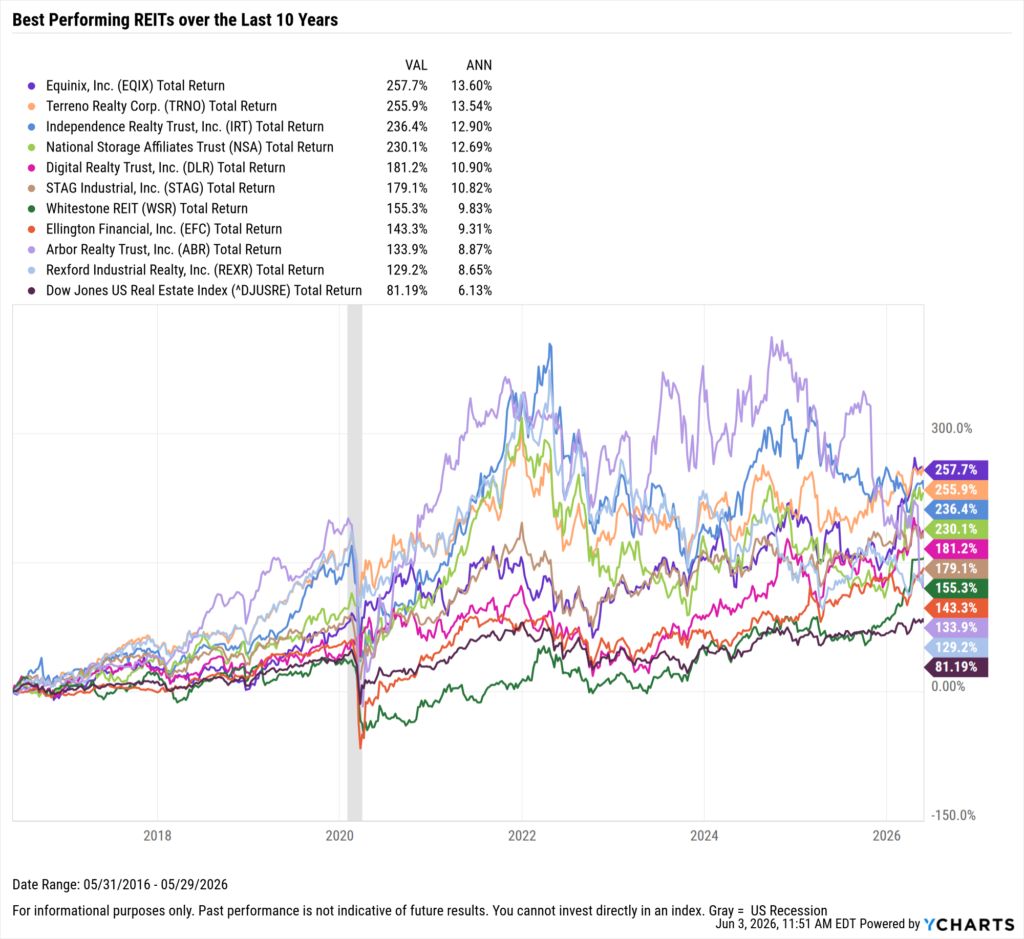
Best Performing REITs over the Last 10 Years
These are the top-performing REITs on an annualized basis between June 1, 2016, and May 31, 2026.
Start a Free Trial to See Full Rankings | Modify the Screen in YCharts
Download Visual | Modify in YCharts
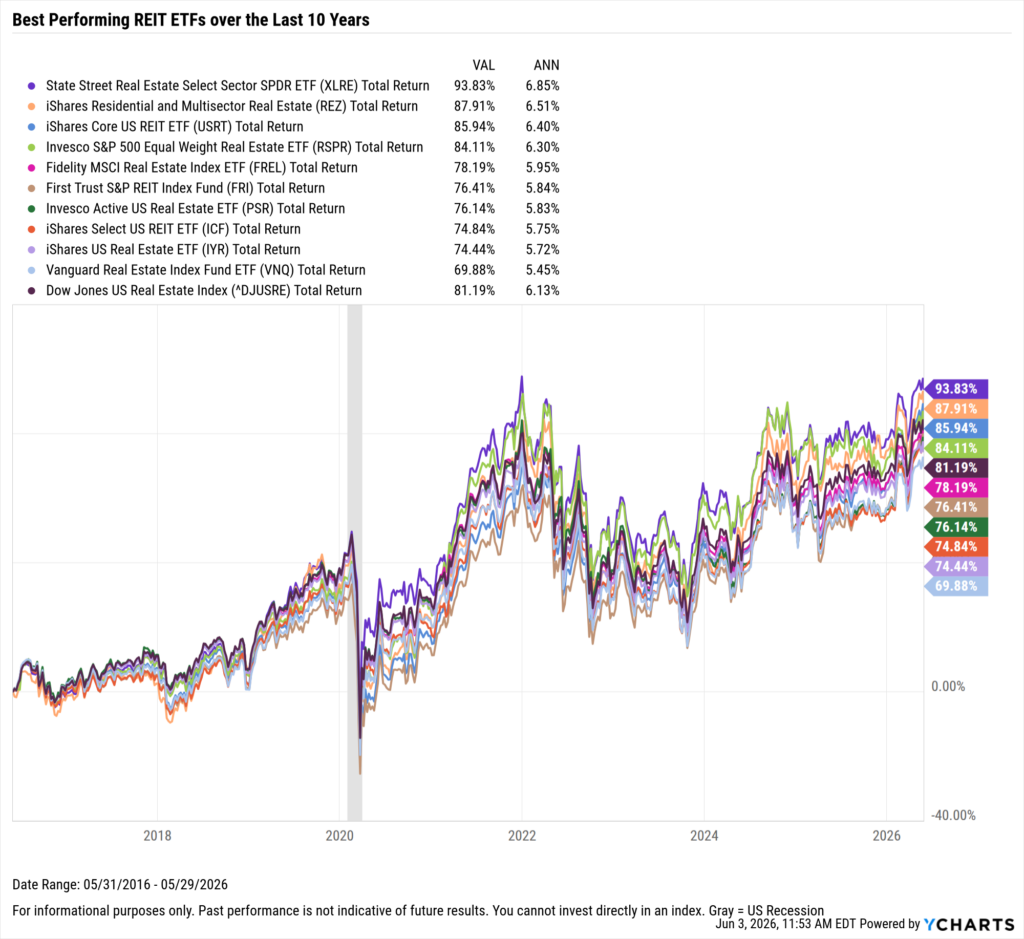
Best Performing REIT ETFs over the Last 10 Years
These are the top-performing REIT ETFs on an annualized basis between June 1, 2016, and May 31, 2026.
Start a Free Trial to See Full Rankings | View & Modify in Fund Screener
Download Visual | Modify in YCharts
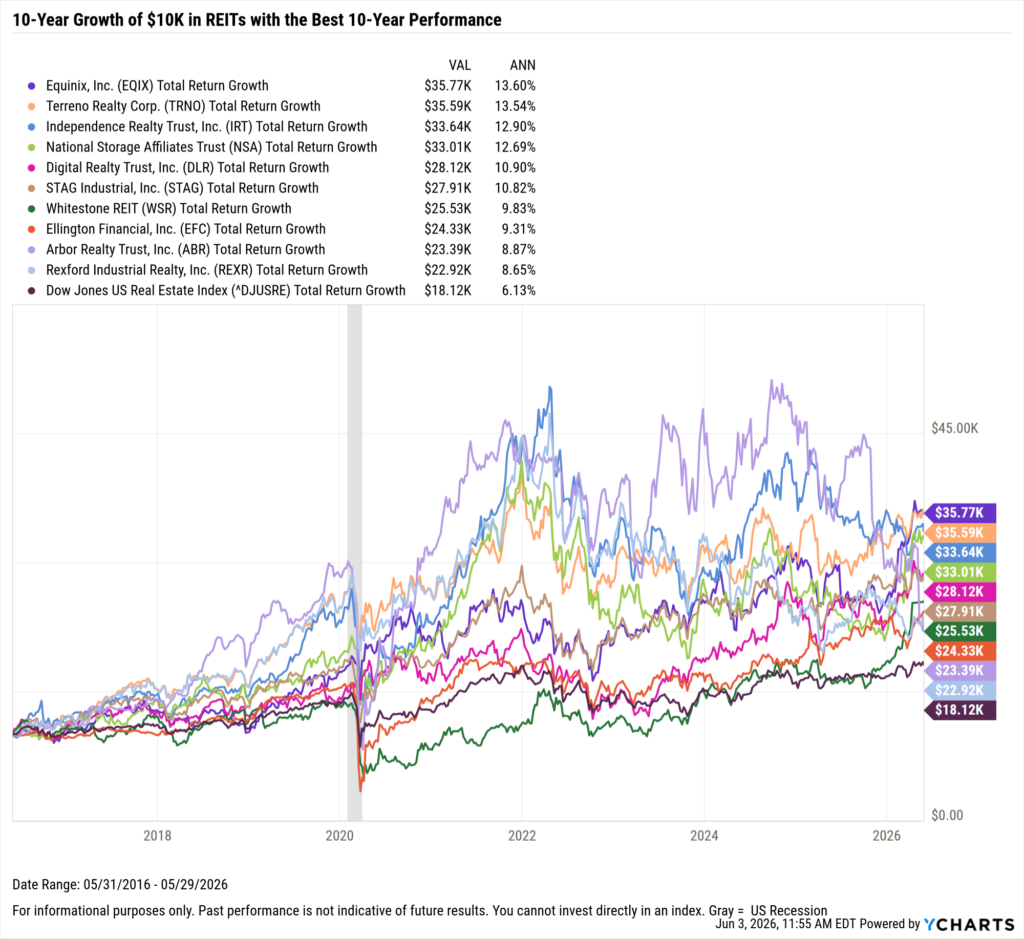
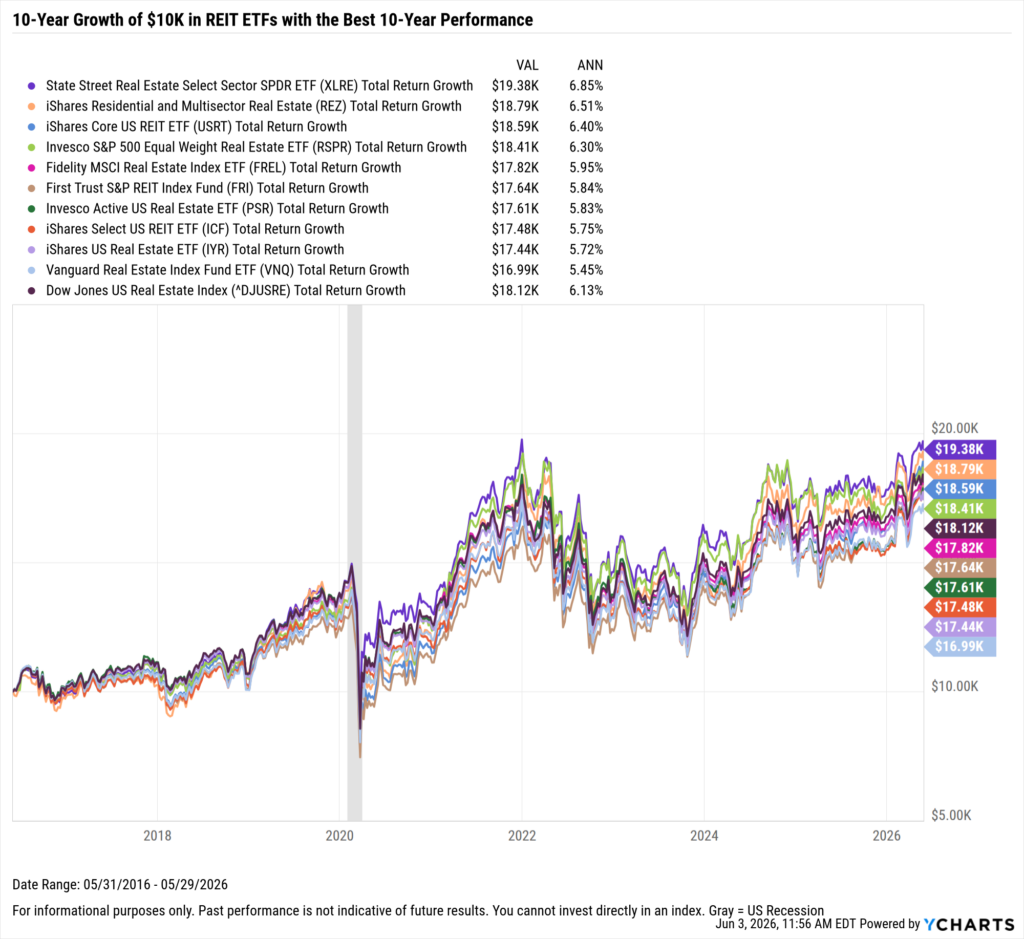
What was the Growth of $10,000 in the Best REITs Over the Last 10 Years?
If you invested $10,000 10 years ago into any of the ten best-performing REITs over the last 10 years, your balance today would be no less than $24K.
The best-performing REIT in the last 10 years was Equinix (EQIX). A $10,000 investment into EQIX 10 years ago would be nearly $36,000 today ion a total return basis. Right behind it was Terreno Realty Corp (TRNO); investing $10,000 into TRNO back in 2016 would’ve also turned into nearly $36K.
Download Visual | Modify in YCharts
On the other hand, if you invested $10,000 10 years ago into any of the ten best-performing REIT ETFs over the last 10 years, your balance today would be at least $17K, while diversifying across a broader pool of underlying investments than with a typical REIT.
The best-performing REIT ETF in the last 10 years was the Real Estate Select Sector SPDR Fund (XLRE). A $10,000 investment in XLRE 10 years ago would be worth nearly $20,000 today. The second best-performing REIT ETF was the iShares Residential and Multisector Real Estate ETF (REZ); investing $10,000 in REZ back in 2016 would also have turned into nearly $18,790.
XLRE, REZ, USRT, and RSPR were the only four REIT ETFs that outperformed the Dow Jones US Real Estate Index over the last 10 years.
Download Visual | Modify in YCharts
Whenever you’re ready, there are 3 ways YCharts can help you:
Interested in doing further REIT or REIT ETF research with YCharts?
Email us at hello@ycharts.com or call (866) 965-7552. You’ll get a response from one of our Chicago-based team members.
Want to test out YCharts for free?
Start a no-risk 7-Day Free Trial.
3. Sign up to receive a copy of our latest research, “Which Asset Classes Perform Best As Inflation is Driven Lower.”
Disclaimer
©2026 YCharts, Inc. All Rights Reserved. YCharts, Inc. (“YCharts”) is not registered with the U.S. Securities and Exchange Commission (or with the securities regulatory authority or body of any state or any other jurisdiction) as an investment adviser, broker-dealer or in any other capacity, and does not purport to provide investment advice or make investment recommendations. This report has been generated through application of the analytical tools and data provided through ycharts.com and is intended solely to assist you or your investment or other adviser(s) in conducting investment research. You should not construe this report as an offer to buy or sell, as a solicitation of an offer to buy or sell, or as a recommendation to buy, sell, hold or trade, any security or other financial instrument. For further information regarding your use of this report, please go to: ycharts.com/about/disclosure
Next Article
Best Performing Mutual Funds of the Last 10 Years: A Financial Advisor’s PerspectiveRead More →