5 Ways Advisors Allocated to Bond Funds Ahead of Rate Cuts

Heading into September’s FOMC, markets were nearly unanimous in their expectations.
By mid-August, CME’s FedWatch tool showed a 90–95% probability of a 25 basis point cut. When Jerome Powell confirmed on September 17th that the Fed would move the upper bound from 4.50% to 4.25%, investors were hardly surprised.
August fund flows reinforce that point.
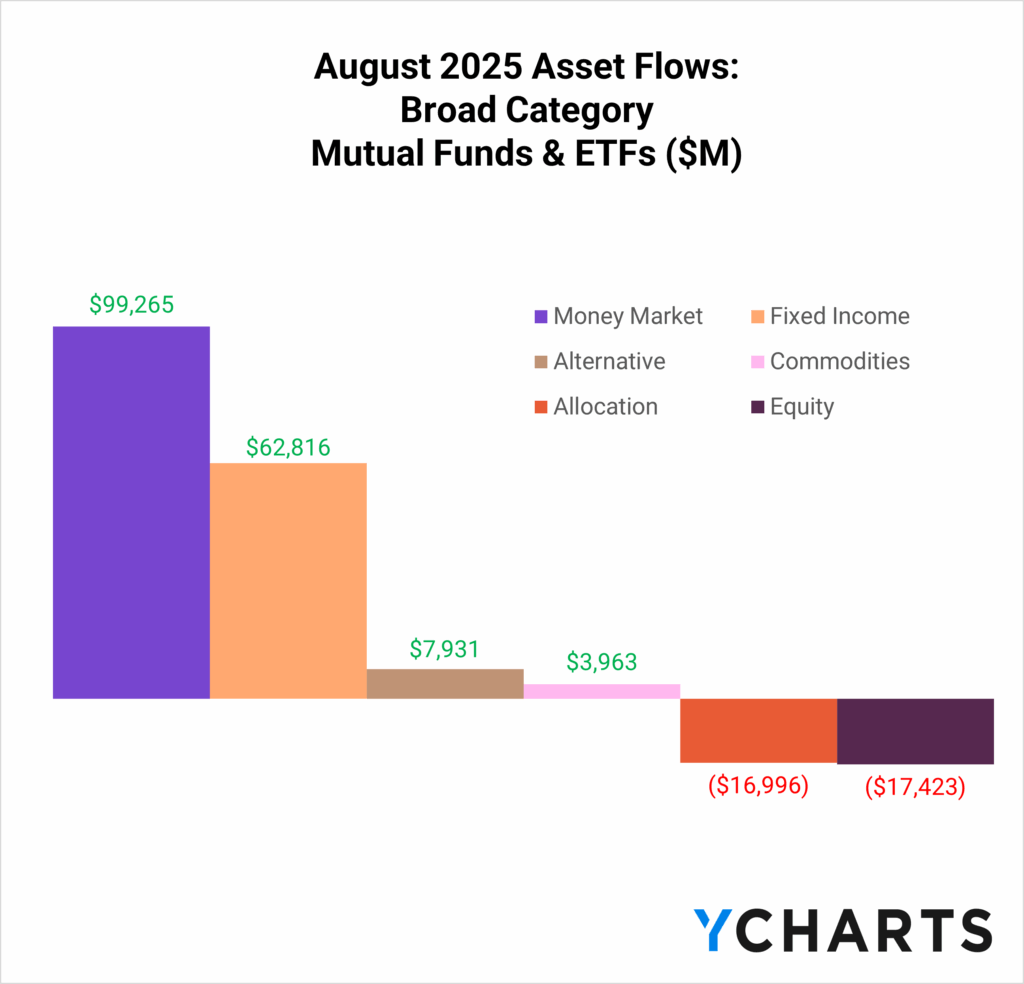
Investors poured nearly $63 billion in net-new assets into fixed income funds in August. (Review a 10-year lookback on the top-performing bond mutual funds and ETFs to understand which strategies have endured across cycles.)
Subscribe to the Fund Flow Report
Sign up for our free monthly Fund Flow Report to stay updated on how assets are moving in and out of these strategies:
Bucking contemporary trends, both mutual funds and ETFs benefited, underscoring that anticipation of easing policy was strong enough to pull money into every vehicle type. By front-running, investors not only locked in higher yields before they declined but also positioned portfolios for potential price appreciation as rates moved lower.
While the correlation is strongest at the short end of the curve, the expectation of lower overnight rates rippled through the entire fixed income spectrum, from cash-like strategies to multi-sector and core bond funds.
Now, let’s turn to the standout funds driving inflows across August’s leading peer groups.
Core Bond: Back to the Benchmark
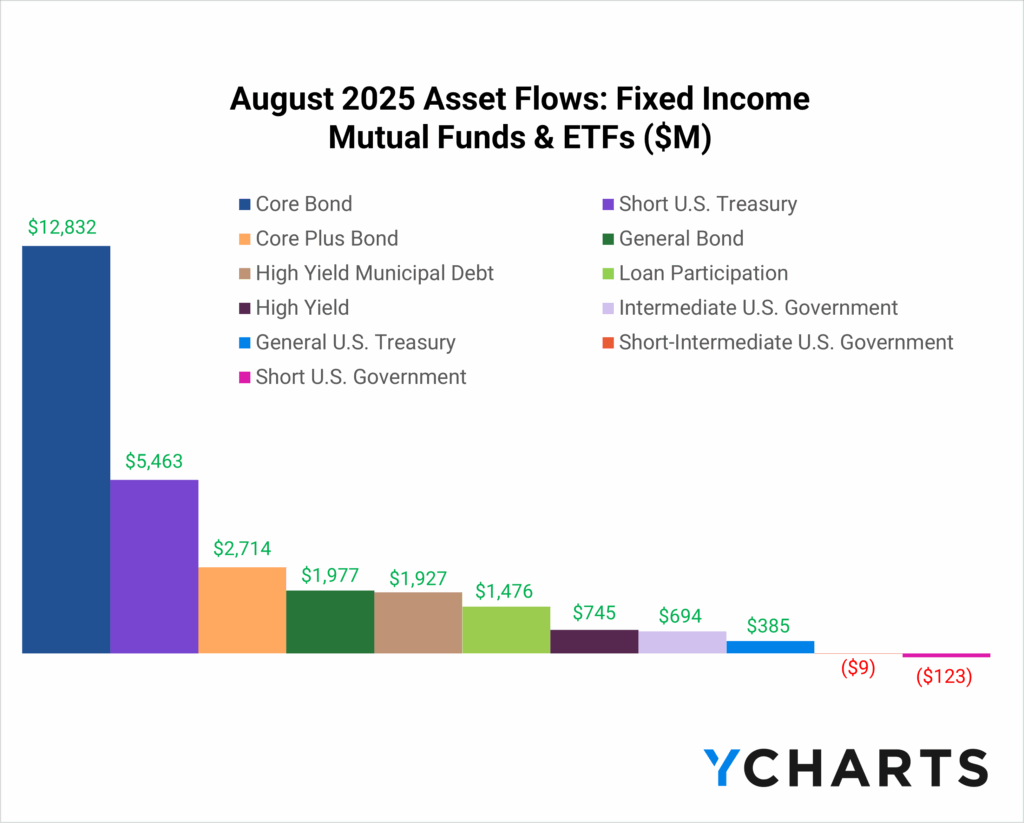
The Core Bond category saw the most inflows across fixed income peer groups in August, attracting $12.6 billion in inflows and bringing year-to-date gains to more than $41.7 billion. With a total addressable market approaching $1.9 trillion, the category proved foundational for advisors repositioning portfolios ahead of rate cuts.
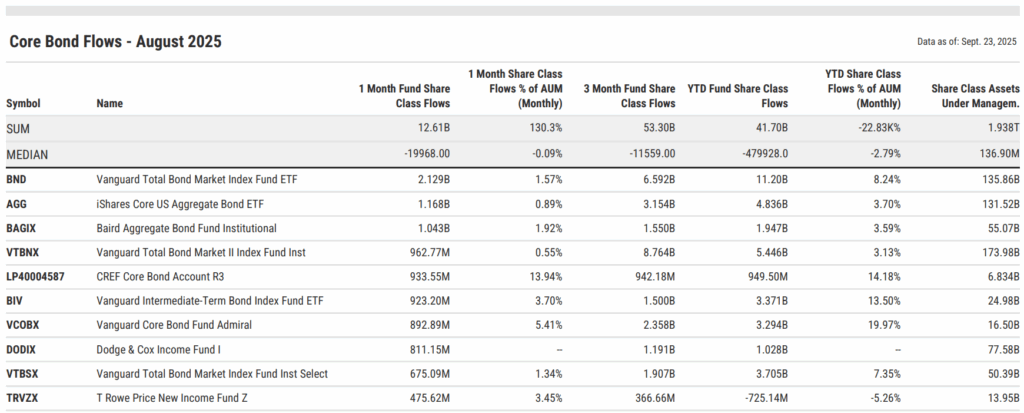
The Vanguard Total Bond Market ETF (BND) led the way with $2.1 billion in August inflows and more than $11.2 billion YTD, equal to 8.2% of its assets. The iShares Core U.S. Aggregate Bond ETF (AGG) followed with $1.2 billion for the month and $4.8 billion YTD, representing 3.7% of its AUM. The Baird Aggregate Bond Fund (BAGIX) added $1 billion in August and nearly $1.9 billion YTD, or 3.6% of its base.
Start a Free Trial to See the Full Table | Modify in YCharts
Elsewhere in the category, Vanguard funds were prominently represented. The Vanguard Total Bond Market II Index Fund (VTBNX) brought in $963 million in August and $5.4 billion year-to-date. The Vanguard Intermediate-Term Bond Index ETF (BIV) followed with $923 million in August, pushing YTD inflows to nearly $3.4 billion, equal to more than 13.5% of its assets. And the Vanguard Core Bond Fund (VCOBX) added $893 million for the month and $3.3 billion YTD, equal to 20% of its base.
Rounding out the top five, the CREF Core Bond Account R3 (LP40004587) collected $933 million in August and over $950 million YTD.
Advisors leaned into benchmark-oriented exposures to capture duration benefits as yields fall, reaffirming the role of core bonds as the ballast in balanced portfolios.
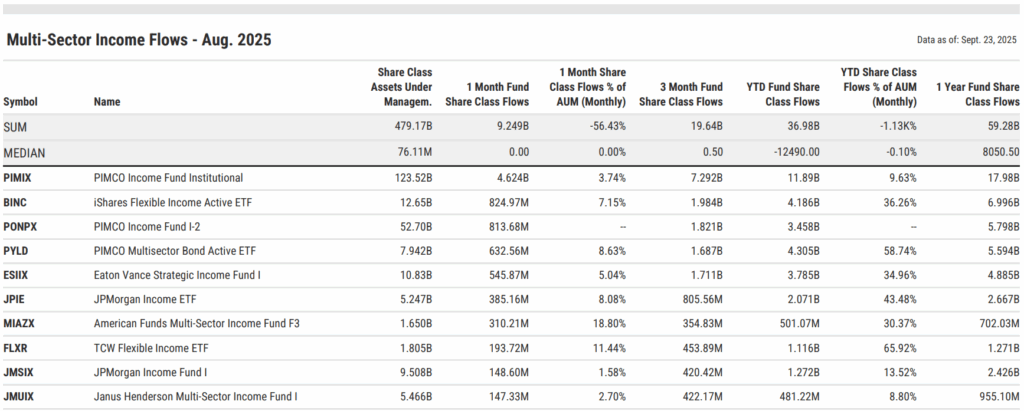
Multi-Sector Income: Flexibility to Play Offense
Multi-Sector Income funds were the second-strongest fixed income peer group in August, attracting $9.3 billion and bringing year-to-date inflows to more than $36 billion. With a total addressable market of roughly $460 billion, the category remains a critical allocation for advisors seeking flexible strategies that can balance income generation with active risk management.
PIMCO continues to define the category, with its flagship Income Fund and related vehicles capturing the lion’s share of inflows. The PIMCO Income Fund (PIMIX) led all strategies with $4.6 billion in August inflows and nearly $11.9 billion YTD, equal to 9.6% of its assets. The iShares Flexible Income ETF (BINC) followed with $825 million for the month and $4.2 billion YTD, representing inflows equal to more than a third of its AUM.
The PIMCO Income Fund I-2 (PONPX) added $814 million in August and $3.5 billion YTD, while the PIMCO Multisector Bond Active ETF (PYLD) brought in $633 million in August and $4.3 billion YTD, or nearly 59% of its base.
Start a Free Trial to See the Full Table | Modify in YCharts
Other notable contributors included the Eaton Vance Strategic Income Fund (ESIIX), which added $546 million for the month and $3.8 billion YTD (35% of assets). The American Funds Multi-Sector Income Fund (MIAZX) also stood out with $310 million in August inflows, equal to nearly 19% of its base.
And the TCW Flexible Income ETF (FLXR) added $194 million in August and $1.1 billion YTD, or 66% of its AUM.
Taken together, these flows highlight the appeal of flexibility. Advisors are gravitating toward multi-sector approaches that can rotate across credit, securitized assets, and global bonds, which may be well-positioned to sustain income while capturing upside from falling rates.
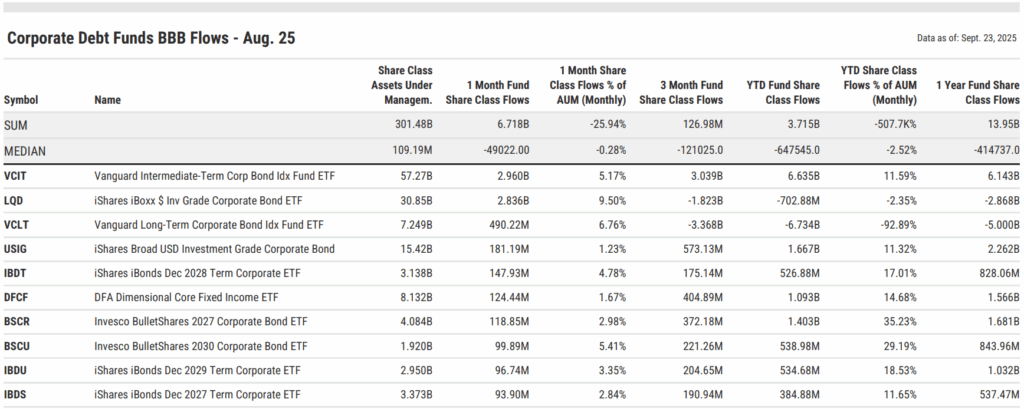
Corporate Debt (BBB-Rated): Selective Credit Risk
BBB-rated corporate bond funds drew $6.7 billion in August inflows, lifting year-to-date totals to nearly $3.7 billion, helping offset outflows from earlier in the year. With a total addressable market of more than $300 billion, the peer group has become a favored tool for advisors seeking incremental yield without venturing into high yield.
Vanguard’s Intermediate-Term Corporate Bond ETF (VCIT) led the way with $3 billion in August inflows and $6.6 billion YTD, equal to 11.6% of its assets. The iShares iBoxx $ Investment Grade Corporate Bond ETF (LQD) followed closely with $2.8 billion for the month, though YTD flows remain negative at –$702 million, underscoring the sharp reversal of demand in August.
Similarly, the Vanguard Long-Term Corporate Bond ETF (VCLT) added $490 million in August, though its YTD flows remain in the red at –$6.7 billion.
Start a Free Trial to See the Full Table | Modify in YCharts
Beyond the category’s largest ETFs, inflows were spread across more targeted exposures.
The iShares Broad USD Investment Grade Corporate Bond ETF (USIG) drew $181 million in August and $1.7 billion YTD, while the iShares iBonds Dec 2028 Term Corporate ETF (IBDT) added $148 million for the month and $527 million YTD.
The DFA Dimensional Core Fixed Income ETF (DFCF) also stood out with $124 million in August inflows and more than $1 billion YTD, or 15% of its assets.
August’s results highlight a bifurcation within BBB-rated corporates: flagship ETFs like VCIT and LQD absorbed the bulk of advisor allocations, while niche maturity-dated strategies and active ETFs scaled alongside them.
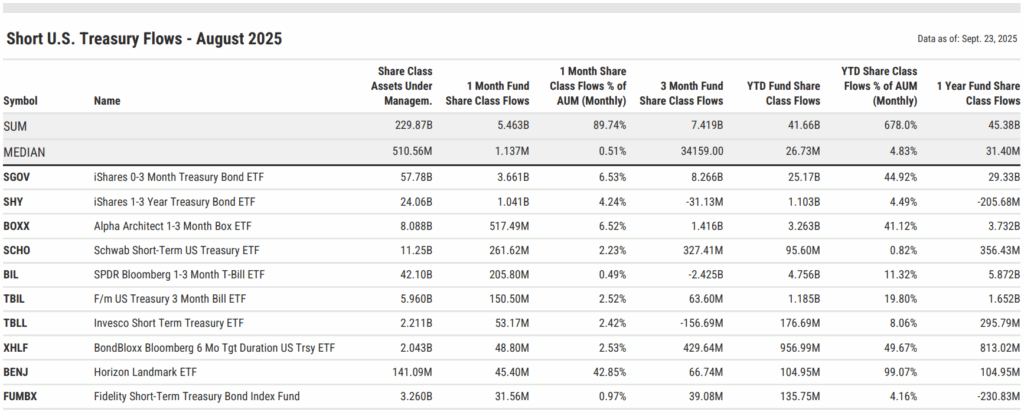
Short-Term Treasuries: Cash Management
Short U.S. Treasury funds added $5.5 billion in August inflows, bringing year-to-date gains to more than $41.6 billion across the $230 billion category. Advisors continue to rely on the peer group as the core of their cash-management strategy, using short and ultra-short government securities to preserve liquidity while they prepared portfolios for rate cuts.
The iShares 0–3 Month Treasury Bond ETF (SGOV) dominated flows with $3.7 billion in August inflows and $25.2 billion YTD, equal to nearly 45% of its assets. The iShares 1–3 Year Treasury Bond ETF (SHY) followed with $1 billion for the month.
The Alpha Architect 1–3 Month Box ETF (BOXX) added $517 million in August and $3.3 billion YTD, over 40% of its base, while the Schwab Short-Term U.S. Treasury ETF (SCHO) gathered $262 million in August.
Start a Free Trial to See the Full Table | Modify in YCharts
Other notable contributors included the SPDR Bloomberg 1–3 Month T-Bill ETF (BIL), which pulled in $206 million in August and $4.8 billion YTD, and the F/m US Treasury 3 Month Bill ETF (TBIL), which added $151 million for the month and $1.2 billion YTD.
Smaller but fast-growing entrants such as the BondBloxx Bloomberg 6-Month Target Duration Treasury ETF (XHLF) gathered $49 million in August and nearly $1 billion YTD.
These flows highlight the central role of short-term Treasuries in positioning for policy easing, as their yields move nearly in step with the Fed’s overnight rate.
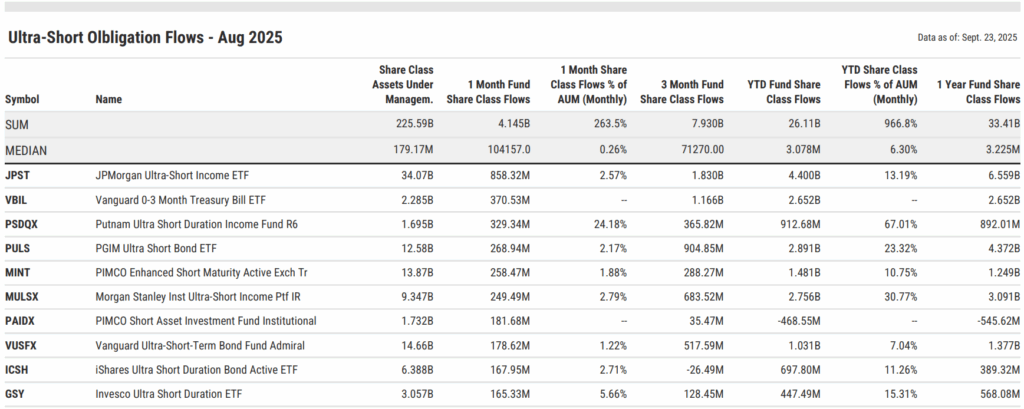
Ultra-Short Obligations: Parking Cash With Yield
Ultra-Short Obligations funds drew $4.2 billion in August inflows, lifting year-to-date gains to more than $26 billion across the $225 billion category. The peer group has become the “waiting room” for capital, offering higher yields than money markets while keeping duration risk minimal—a balance that has proven especially attractive as investors positioned for the Fed’s cutting cycle.
JPMorgan Ultra-Short Income ETF (JPST) led the way with $858 million in August inflows and $4.4 billion YTD, equal to more than 13% of its assets. Vanguard’s recently launched 0–3 Month Treasury Bill ETF (VBIL) followed with $371 million for the month and $2.7 billion since its inception in February, while the Putnam Ultra Short Duration Income Fund (PSDQX) added $329 million in August and $913 million YTD, representing inflows equal to more than 67% of its base.
Start a Free Trial to See the Full Table | Modify in YCharts
Other notable contributors included the PGIM Ultra Short Bond ETF (PULS), which gathered $269 million in August and $2.9 billion YTD, and the PIMCO Enhanced Short Maturity Active ETF (MINT), which added $258 million in August and $1.5 billion YTD.
The Morgan Stanley Institutional Ultra-Short Income Portfolio (MULSX) also stood out with $249 million in August inflows and $2.8 billion YTD, nearly 31% of its assets.
These flows underscore the role of ultra-short obligations as a yield-enhanced liquidity sleeve, allowing investors to capture carry in the near term while preserving the flexibility to redeploy capital as the Fed’s cutting cycle unfolds.
In August, Advisors Positioned Before the Cut
August’s fund flows made clear that advisors were positioning portfolios for a lower-rate world. They locked in yesterday’s yields while setting the stage for expected price appreciation in the future.
The result is nearly $63 billion in net-new fixed income allocations in a single month, spanning ETFs and mutual funds. Advisors front-ran the Fed, and in doing so, they demonstrated how portfolios can be built to balance liquidity, carry, and rate sensitivity simultaneously.
Subscribe to the Fund Flow Report for ongoing insights into which peer groups and funds are winning advisor allocations each month.
Whenever you’re ready, here’s how YCharts can help you:
Sign up for a copy of our Fund Flows Report:
Sign up for our free monthly Fund Flow Report:Curious what’s included in YCharts’ recently launched bond data and how to access it?
Visit the FAQ page for coverage details and to request the add-on.
Ready to try YCharts for yourself?
Start a no-risk 7-day free trial.
Disclaimer
©2025 YCharts, Inc. All Rights Reserved. YCharts, Inc. (“YCharts”) is not registered with the U.S. Securities and Exchange Commission (or with the securities regulatory authority or body of any state or any other jurisdiction) as an investment adviser, broker-dealer or in any other capacity, and does not purport to provide investment advice or make investment recommendations. This report has been generated through application of the analytical tools and data provided through ycharts.com and is intended solely to assist you or your investment or other adviser(s) in conducting investment research. You should not construe this report as an offer to buy or sell, as a solicitation of an offer to buy or sell, or as a recommendation to buy, sell, hold or trade, any security or other financial instrument. For further information regarding your use of this report, please go to: ycharts.com/about/disclosure
Next Article
How Financial Stocks Navigate Falling Rate CyclesRead More →