A Closer Look at April 2024 Fund Flows: Defined Outcome and Fixed Income ETFs Take Center Stage

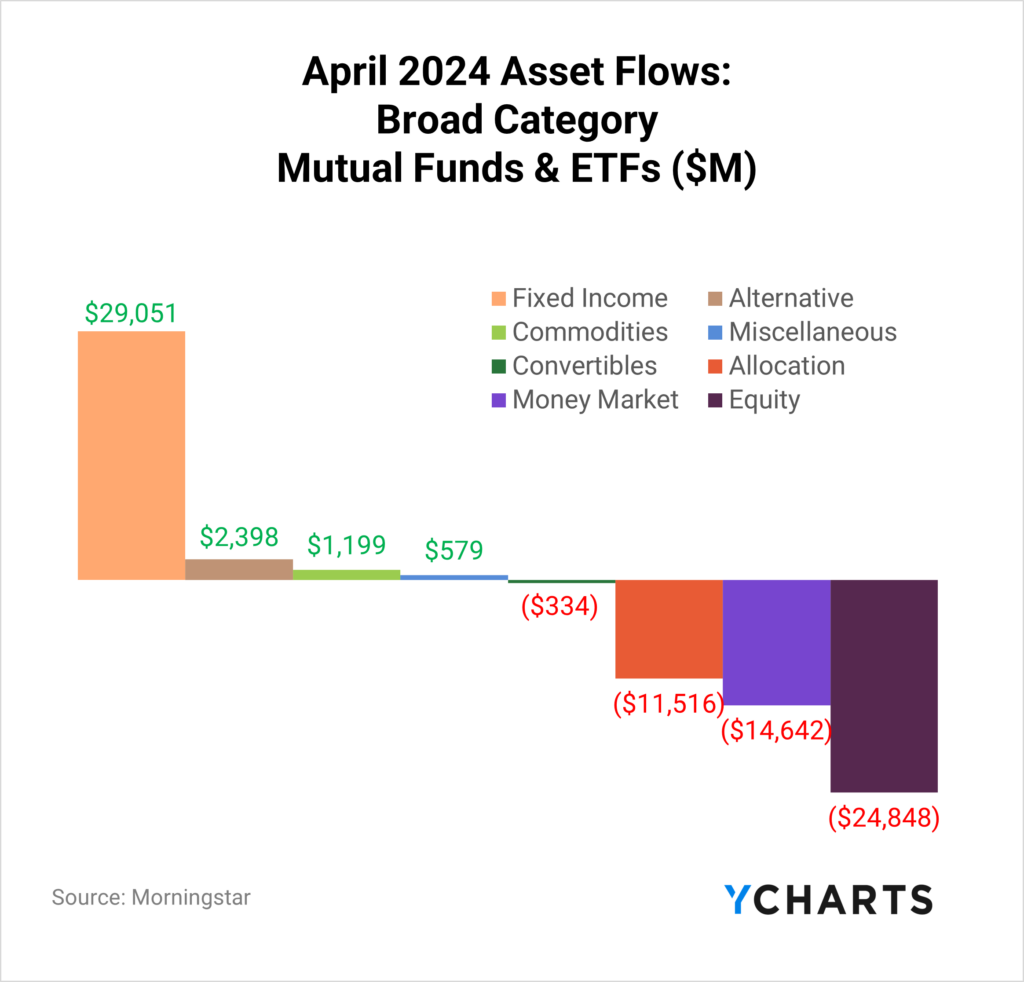
For the second consecutive month, fixed-income funds have been the leader in fund flows, while money market funds witnessed outflows. In April, fixed-income mutual funds and ETFs brought in $29.1B, while money market funds saw a $14.6B departure after $92B exited money market funds in March.
Equity funds also had a net negative month, registering almost $25B in negative flows, despite equity ETFs raking in $18B in April.
Clients, sign up to get the full Fund Flow Report sent directly to your inbox.
For a more nuanced look at monthly flows, sign up for a copy of our Fund Flows Report and Visual Deck (clients only):Active ETFs vs Passive ETFs
According to a 2023 survey by the Money Management Institute, 42% of asset managers currently support active ETFs, and an additional 33% plan to do so soon. Moreover, among those asset managers who already offer active ETFs, 75% plan to increase their support for this type of investment vehicle.
One reason behind this trend is the growing demand for active ETFs from wealth managers, with 89% already using these vehicles. Of those currently using active ETFs, 42% have expressed their intention to increase their focus on this investment option.
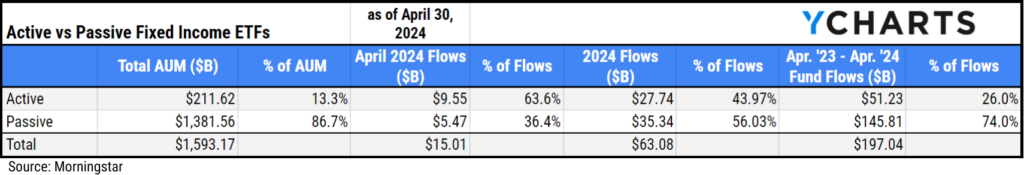
Of the $15B that went into Fixed Income ETFs in April, $9.6B (or 64%) came from active strategies. Furthermore, from April 2023 until April 2024, $51.2B went into active fixed income ETFs, representing 26% of those flows during that time despite only making 13% of fixed income ETF AUM.
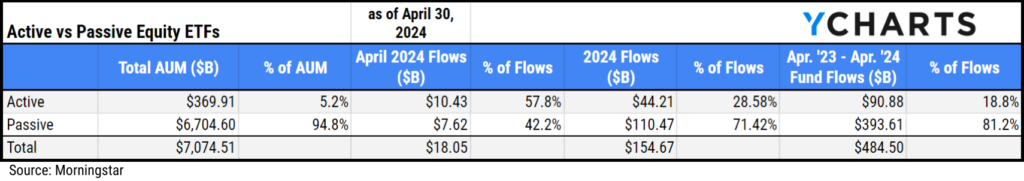
Active equity ETFs accounted for 58% of all equity ETF inflows in April, 29% of flows in 2024, and 19% from April 2023 through April 2024, despite making up 5% of AUM.
ETF Topic of the Moment: Defined Outcome ETFs Start the Year Strong
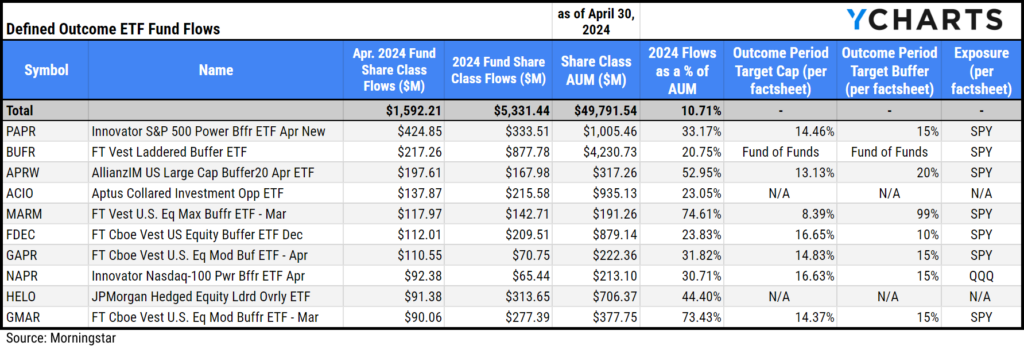
About $50B in AUM is allocated across the 294 ETFs using options to provide defined outcomes to investors. The category continues to garner momentum, with $5.3B (over 10% of the category’s AUM) in inflows year to date and $1.6B going into these strategies in April.
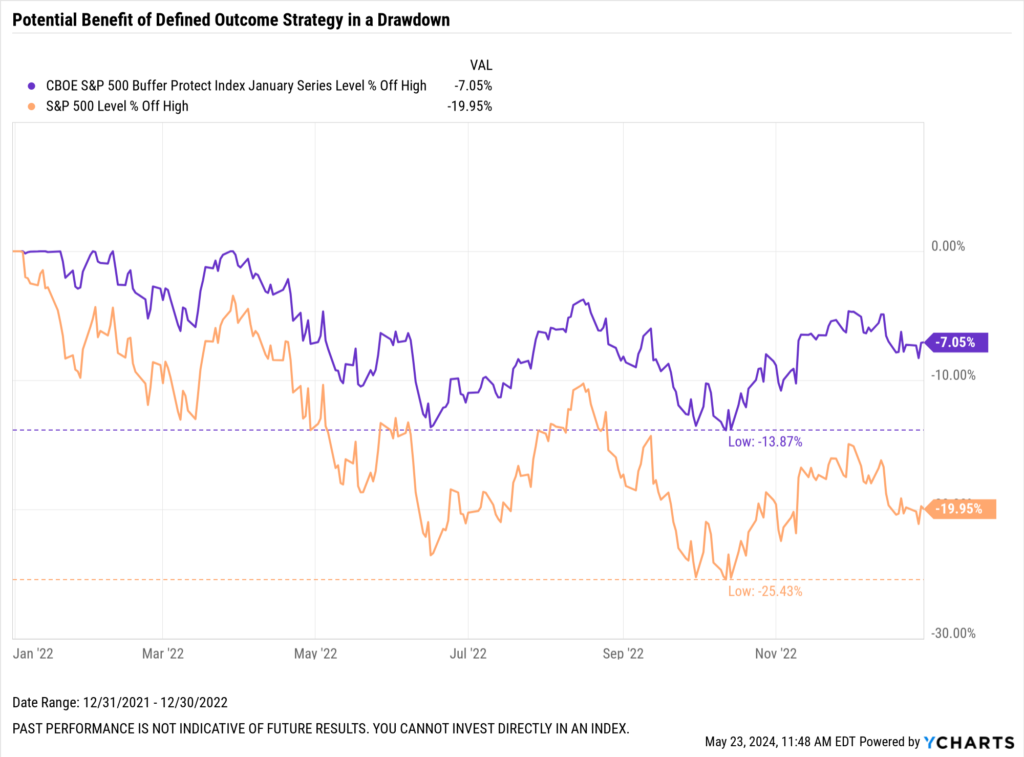
April is important for several of these ETFs because it marks the beginning of an “outcome period” for these strategies. For example, between April 1, 2024, and March 31, 2025, these strategies may offer investors a potential 15% downside buffer to their S&P 500 exposure in exchange for capping their upside potential at 15%, providing risk mitigation for anxious investors.
Investors could’ve benefitted from this strategy like this is in 2022, when the S&P 500 experienced a 25% drawdown, while the CBOE S&P 500 Buffer Protect Index January Series never fell more than 15%.
Download Visual | Modify in YCharts
Several ETF issuers implement these strategies on various indices, with a range of aggressive to conservative caps and buffers. The FT Vest Laddered Buffer ETF (BUFR) is the largest, with $4.2B in AUM, and reeled in $217M in April.
Some of the other most popular defined outcome ETFs in April 2024 were Innovator S&P 500 Power Buffer ETF Apr New (PAPR) and AllianzIM US Large Cap Buffer20 Apr ETF (APRW), which attracted $425M and $198M, respectively.
Download Visual | Modify as a Comp Table in YCharts
Inflows and Outflows for Equity ETFs in April 2024
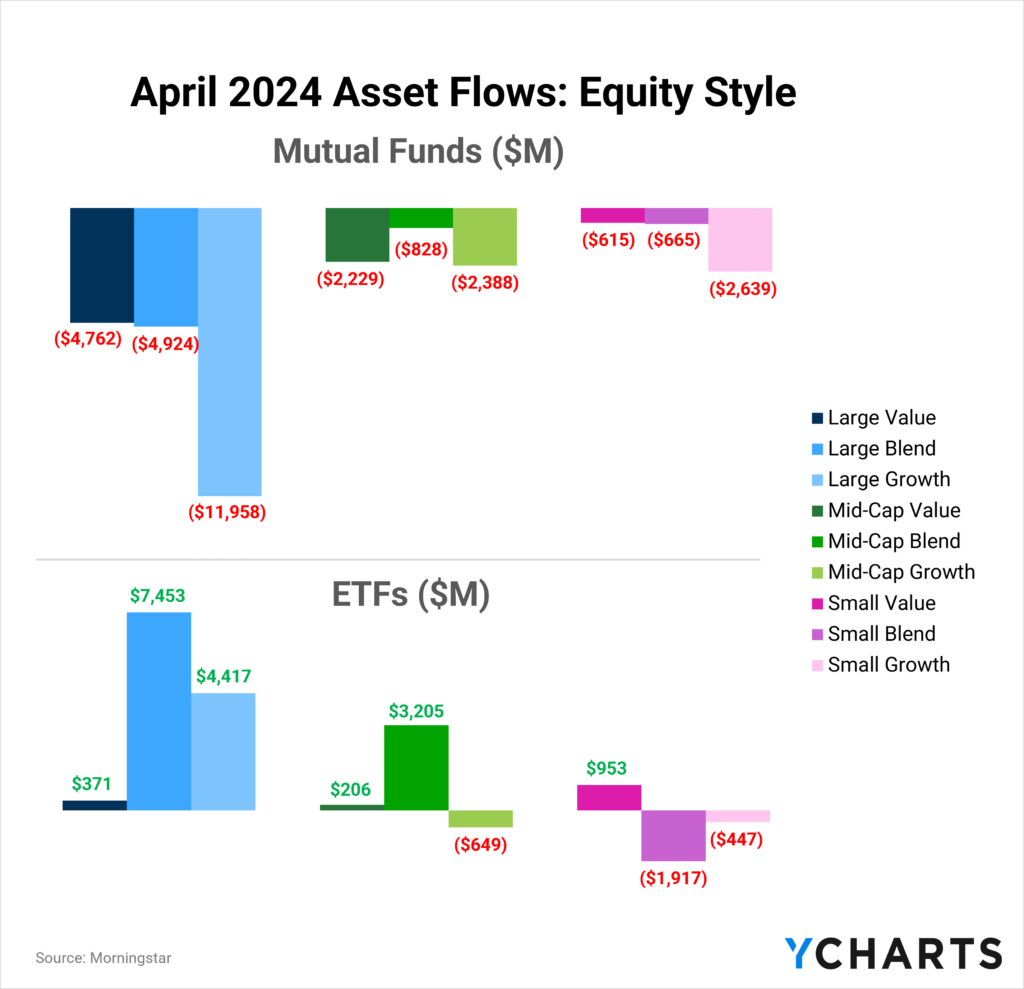
Six of the nine equity style boxes had net positive ETF flows in April, with Mid-Cap Growth, Small Blend, and Small Growth as the only laggards. However, the inflows across the other style boxes weren’t enough to overcome the exodus from mutual funds, leading to a net negative April for equity funds as a whole.
Here are some of April’s most popular and unpopular ETF categories and strategies:
Inflows in Large Blend ETFs
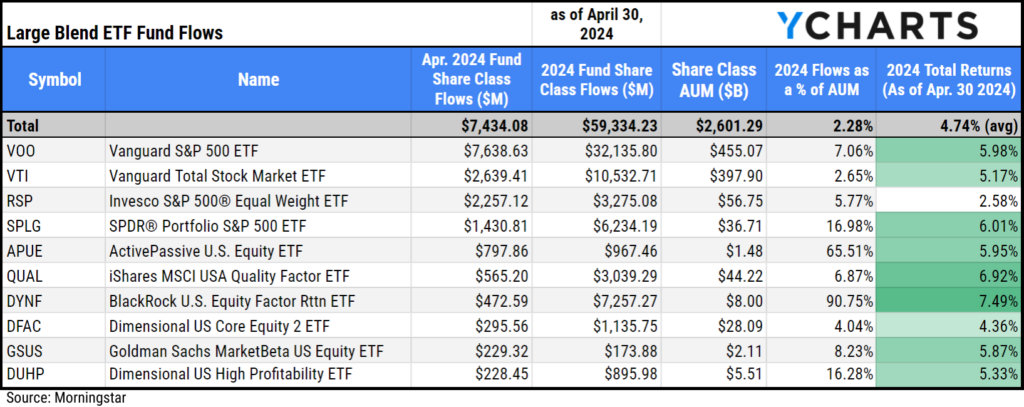
Large Blend ETFs brought in $7.4B in April, which has attracted $59.3B in 2024, 2.3% of its $2.6T AUM.
The funds that attracted the most assets in April were Vanguard S&P 500 ETF (VOO), Vanguard Total Stock Market ETF (VTI), and Invesco S&P 500® Equal Weight ETF (RSP) with $7.6B, $2.6B, and $2.3B in inflows, respectively.
Download Visual | Modify as a Comp Table in YCharts
It is worth noting that upon an initial glance at the table above, one might wonder how the three top funds in the category were able to accumulate over $12B in inflows while the category as a whole only has $7.4B in net inflows. This is due to a $10.4B outflow from SPDR® S&P 500 ETF Trust (SPY); unlike IVV or VOO, SPY can be used disproportionately as a trading tool.
Inflows in Large Growth ETFs
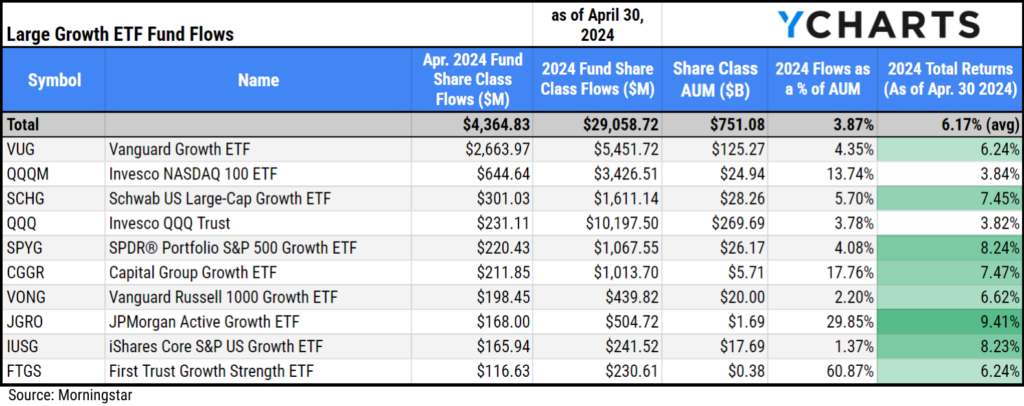
Large Growth ETFs brought in $4.4B in April. The category has attracted $29.1B so far in 2024, which is 3.9% of its $751.1B AUM.
The fund that attracted the most assets in April was Vanguard Growth ETF (VUG), bringing in $2.7B, followed by Invesco NASDAQ 100 ETF (QQQM), which attracted $645M, and Schwab US Large-Cap Growth ETF™ (SCHG), which saw $301M in inflows.
Download Visual | Modify as a Comp Table in YCharts
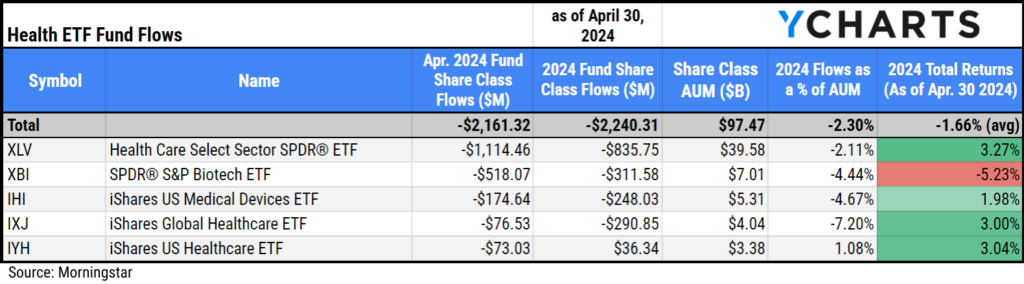
Outflows in Health ETFs
Health ETFs shed $2.2B in April. Over the past 12 months, funds in the sector have seen almost $9B depart. Despite those outflows, Health ETFs contain $97.5B in AUM. Below is a table of the Health ETFs that saw the most outflows in April.
Download Visual | Modify as a Comp Table in YCharts
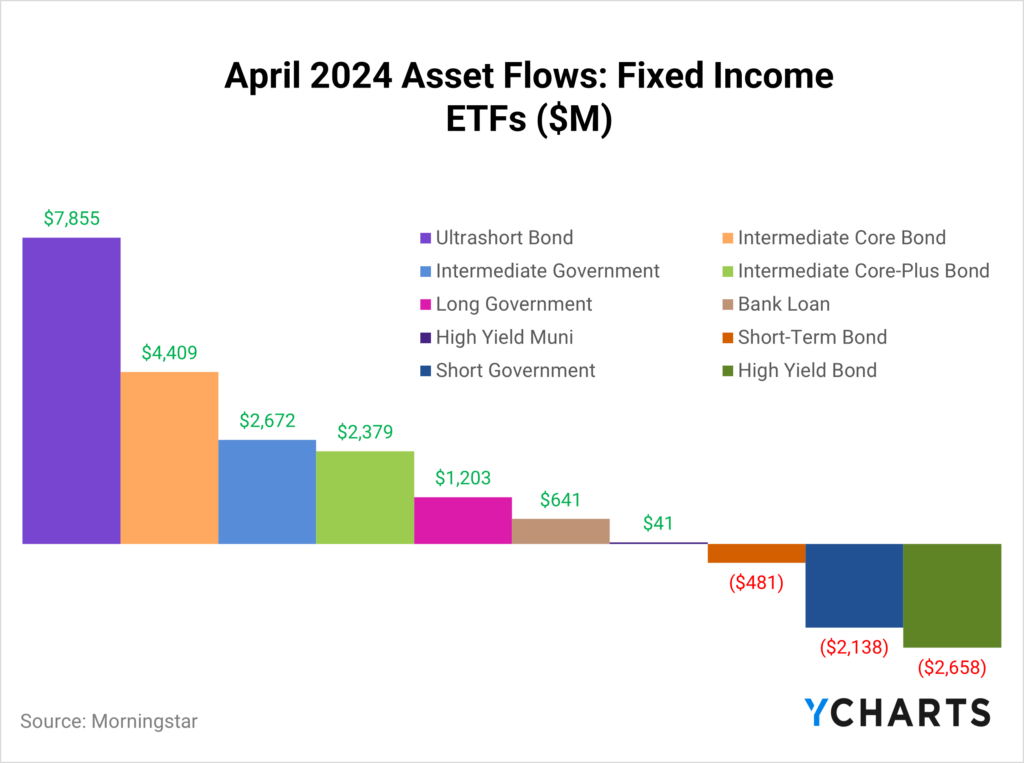
April 2024 Inflows and Outflows for Fixed Income ETFs
Fixed Income funds outpaced all other categories in fund flows, attracting $29.1B in April. Fixed Income ETFs played a pivotal role in the big month, with nearly $15B in cumulative flows coming from ultrashort, intermediate core, and intermediate government bond ETFs.
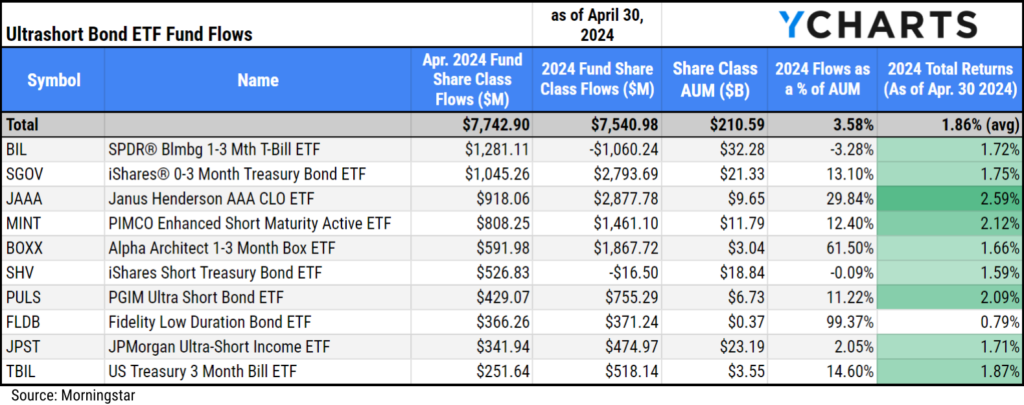
Inflows in Ultrashort Bond ETFs
Ultrashort Bond ETFs brought in $7.7B in April, offsetting some of the outflows the category saw at the beginning of the year. These strategies have attracted $7.5B in 2024, 3.6% of the category’s $210.6B AUM.
The most popular strategies in April were SPDR® Blmbg 1-3 Mth T-Bill ETF (BIL), iShares® 0-3 Month Treasury Bond ETF (SGOV), and Janus Henderson AAA CLO ETF (JAAA), which brought in $1.3B, $1.1B, and $918M, respectively.
Download Visual | Modify as a Comp Table in YCharts
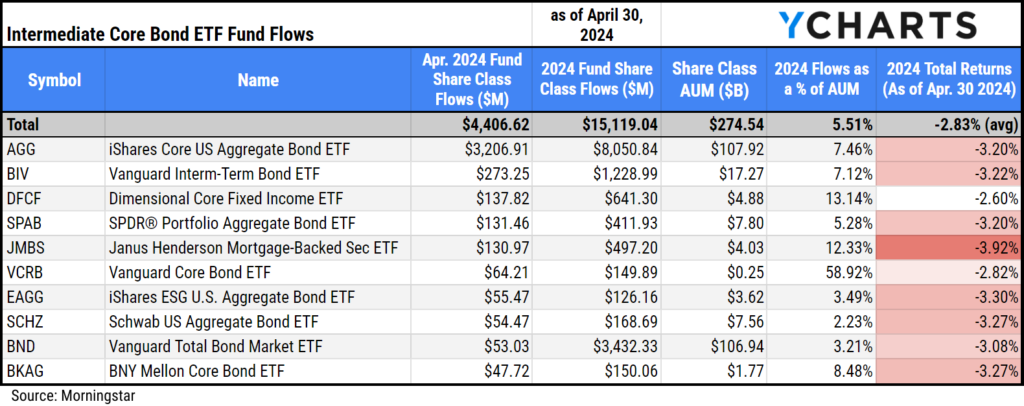
Inflows in Intermediate Core Bond ETFs
Intermediate Core Bond ETFs brought in $4.4B in April and have attracted $15.1B in 2024, representing 5.5% of the category’s $274.5B AUM.
The most popular strategies in April were iShares Core US Aggregate Bond ETF (AGG), Vanguard Interm-Term Bond ETF (BIV), and Dimensional Core Fixed Income ETF (DFCF), which brought in $3.2B, $273.3M, and $137.8M, respectively.
Download Visual | Modify as a Comp Table in YCharts
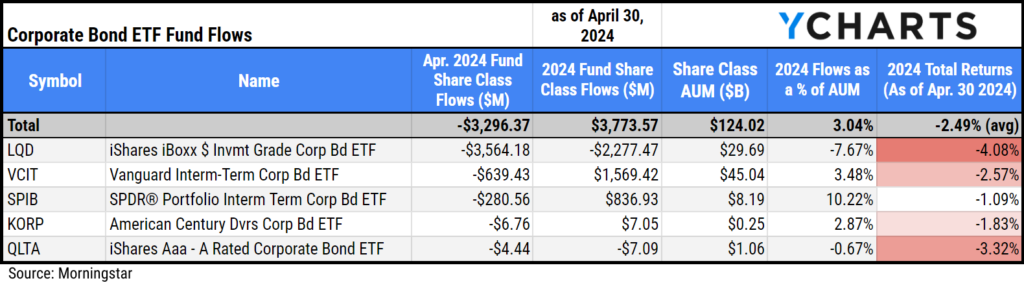
Outflows in Corporate Bond ETFs
Corporate Bond ETFs saw $3.3B leave the category in April. Despite those outflows, there’s still $124B in AUM in Corporate Bond ETFs. Below is a table of the funds that saw the biggest outflows in the category in April.
Download Visual | Modify as a Comp Table in YCharts
Data used in this article is sourced from Morningstar data.
Whenever you’re ready, there are three ways YCharts can help you:
Have questions about how YCharts can help you grow AUM and prepare for meetings?
Email us at hello@ycharts.com or call (866) 965-7552. You’ll get a response from one of our Chicago-based team members.
Unlock access to our Fund Flows Report and Visual Deck by becoming a client.
Dive into YCharts with a no-obligation 7-Day Free Trial now.
Sign up for a copy of our Fund Flows Report and Visual Deck (clients only):
Disclaimer
©2024 YCharts, Inc. All Rights Reserved. YCharts, Inc. (“YCharts”) is not registered with the U.S. Securities and Exchange Commission (or with the securities regulatory authority or body of any state or any other jurisdiction) as an investment adviser, broker-dealer or in any other capacity, and does not purport to provide investment advice or make investment recommendations. This report has been generated through application of the analytical tools and data provided through ycharts.com and is intended solely to assist you or your investment or other adviser(s) in conducting investment research. You should not construe this report as an offer to buy or sell, as a solicitation of an offer to buy or sell, or as a recommendation to buy, sell, hold or trade, any security or other financial instrument. For further information regarding your use of this report, please go to: ycharts.com/about/disclosure
Next Article
Introducing YCharts' Tearsheet Builder: Customizable Reports for Advisors and WholesalersRead More →