A Closer Look at Q1 2024 Fund Flows: Rise of Active ETFs and Decline in Money Markets

Q1 2024 was a continuation of the fund flow trends we saw in 2023, and based on some of the data we saw in January and February, the broad category winners were as expected.
Before we fully dive into Q1’s flows, this quarter’s Fund Flow Webinar was joined by Lara Crigger, Editor-in-Chief at VettaFi, and Dave Lubnik, SVP of Institutional Sales at YCharts, who provided more insights about how money moved in Q1. Watch the replay below:
It was a tremendous quarter for Fixed Income ETFs and mutual funds, with over $151B pouring into the strategies. Equity funds also outpaced money market funds, attracting $53.6B in Q1. However, with rates still high, investors parked over $18B in Money Market funds as they remained attractive.
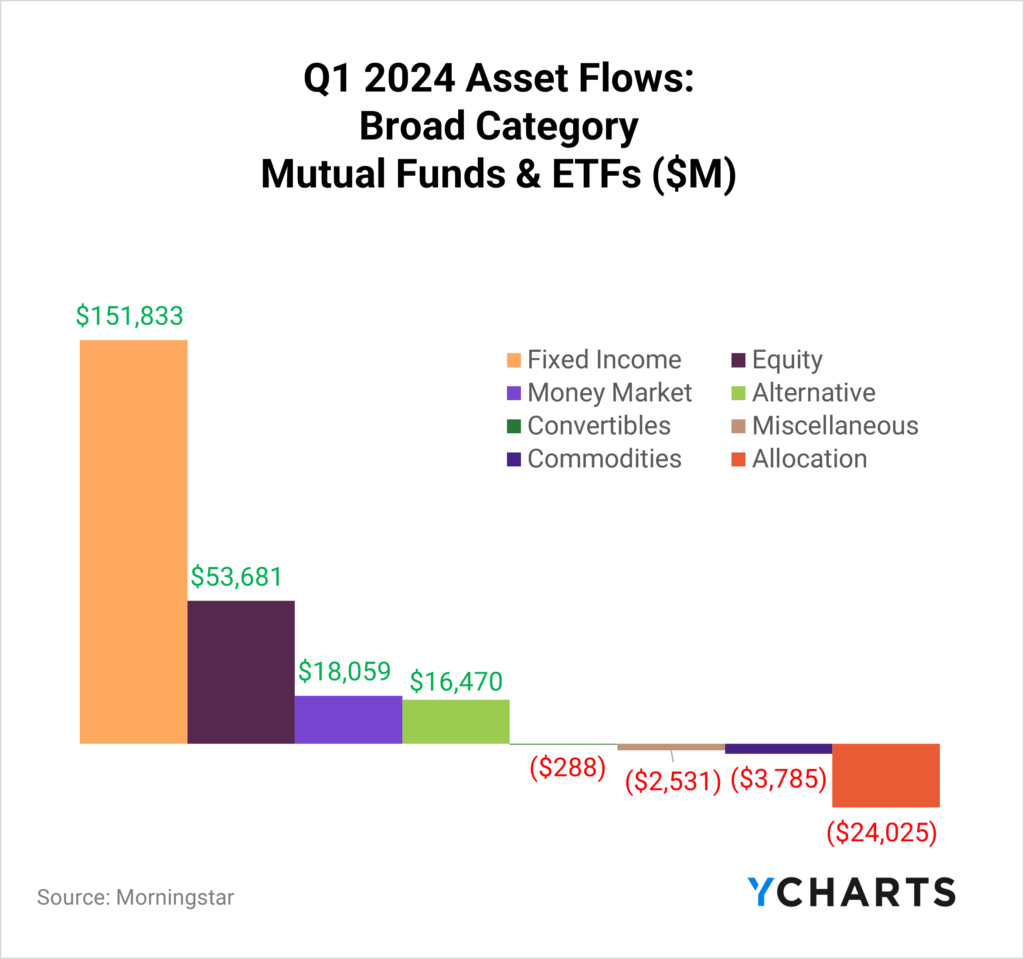
But all that momentum into money market funds stopped in the last month of Q1, with over $92B departing from money markets in March.
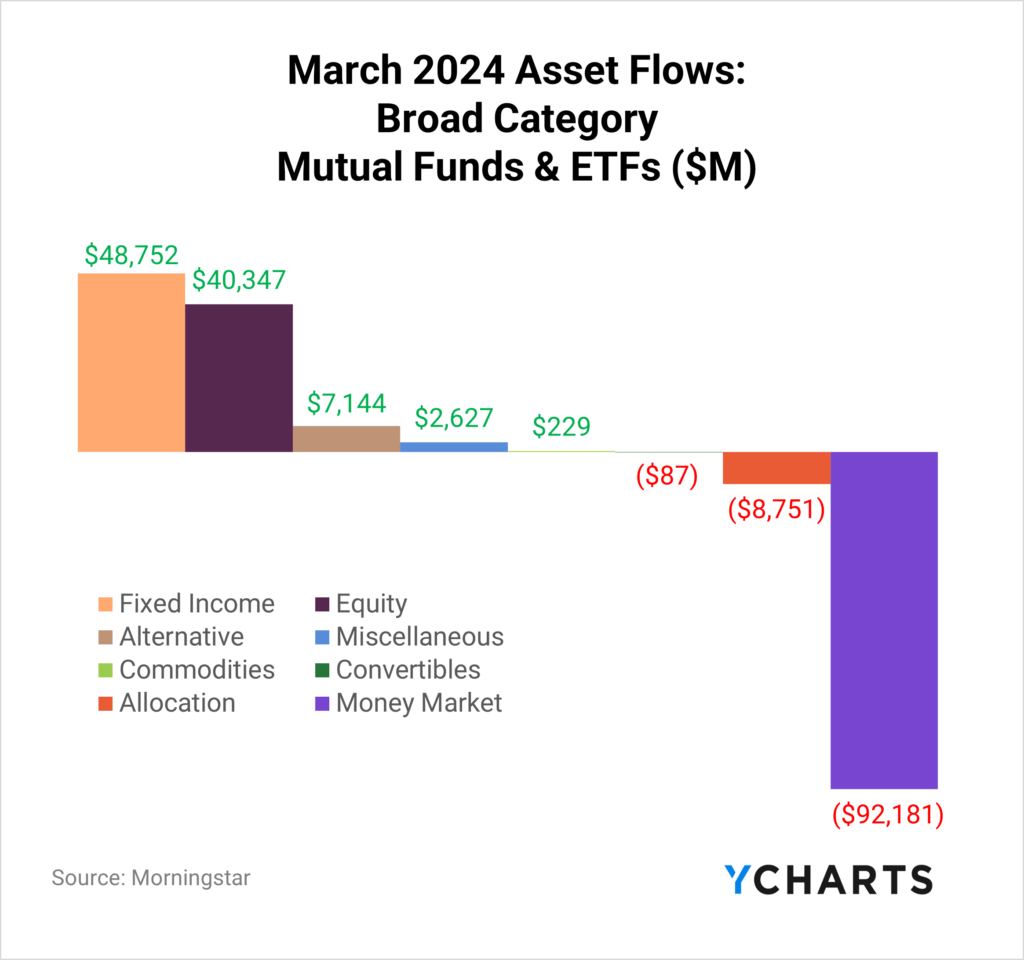
Could this be the opportunity that asset managers were waiting for? Are advisors now looking for opportunities to put this influx of assets to work? And what strategies were the big winners of the nearly $90B that went into Fixed Income and Equity funds in March?
Read on to see how money moved in and out of strategies in more specific categories.
Clients, sign up for YCharts’ full Fund Flow Report sent directly to your inbox.
For a more nuanced look at monthly flows, sign up for a copy of our Fund Flows Report and Visual Deck (clients only):Active ETFs vs Passive ETFs
Based on a 2023 survey conducted by the Money Management Institute, 42% of asset managers currently support active ETFs, while an additional 33% plan to do so soon. Moreover, among those asset managers who already offer active ETFs, 75% have plans to increase their support for this type of investment vehicle.
One reason behind this trend is the growing demand for active ETFs from wealth managers, with 89% already using these vehicles. Of those currently using active ETFs, 42% have expressed their intention to increase their focus on this investment option.
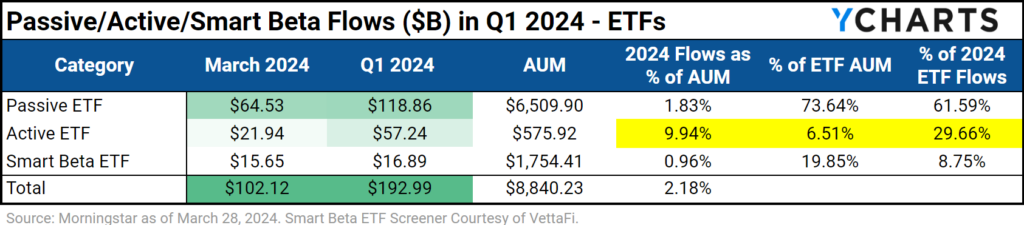
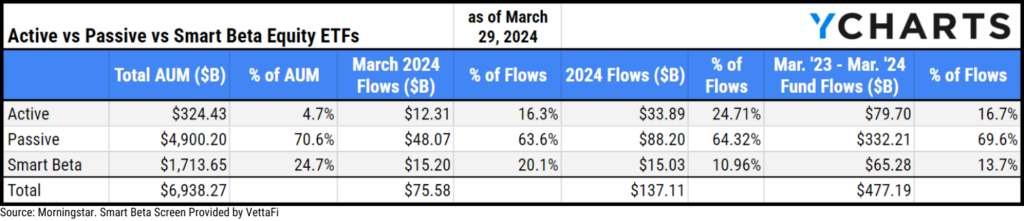
In Q1, the demand for these strategies came to fruition, with almost 30% of ETF flows going into active funds in Q1 despite making up less than 7% of ETF AUM.
Download Visual | Get in Touch to Access the Smart Beta Screen
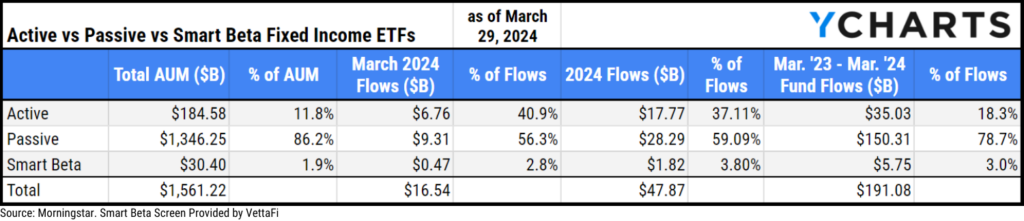
Of the $47.9B that went into Fixed Income ETFs in Q1, $17.8B (or 37%) came from active strategies despite only making up 12% of Fixed Income ETF AUM (as of March 29th). Furthermore, from March 2023 until March 2024, $35B went into active fixed-income ETFs, representing 18% of the $191B that went into fixed-income strategies.
Download Visual | Get in Touch to Access the Smart Beta Screen
In equity ETFs, where despite making up 5% of AUM, active equity ETFs accounted for 25% of inflows in Q1 2024 and 17% of flows from March 2023 through March 2024.
Download Visual | Get in Touch to Access the Smart Beta Screen
ETF Asset Manager Leaderboards as of Q1 2024
The ETF industry continued to evolve in Q1. New participants emerged due to new rules regarding mutual funds to ETF conversions, opportunities for active strategies, and the race to dominate the Bitcoin ETF space.
Below, you’ll find how ETF asset managers are stacking up. We split the groups by $1T and $100B asset milestones.
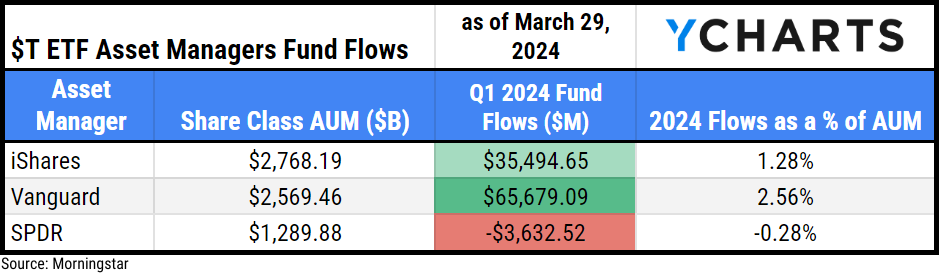
As of the end of March 2024, three firms had over $1T in assets: iShares, Vanguard, and SPDR.
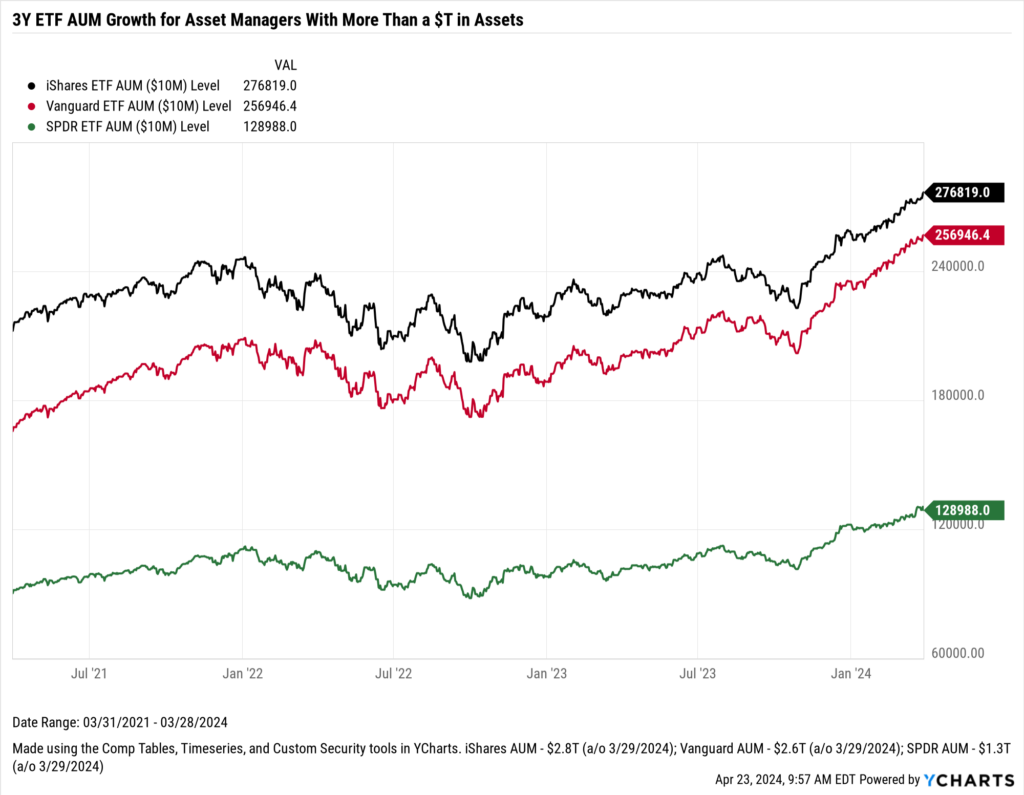
iShares leads the way with $2.8T in assets, with Vanguard closely behind with $2.6T. Vanguard brought in $65.7B in Q1 and was the biggest grower, based on 2024 flows as a percentage of AUM.
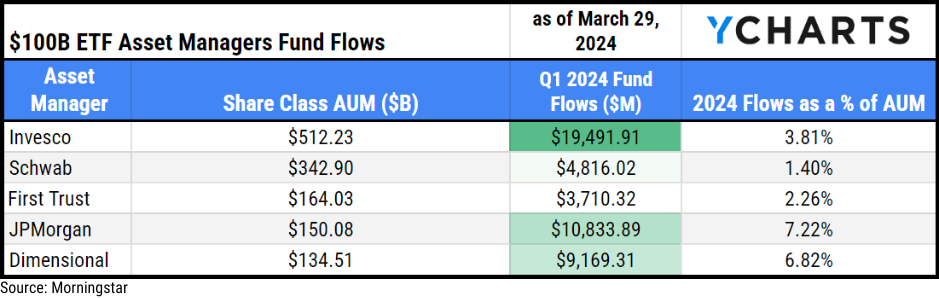
As of the end of March 2024, five firms had over $100B but less than $1T in assets: Invesco, Schwab, First Trust, JPMorgan, and Dimensional.
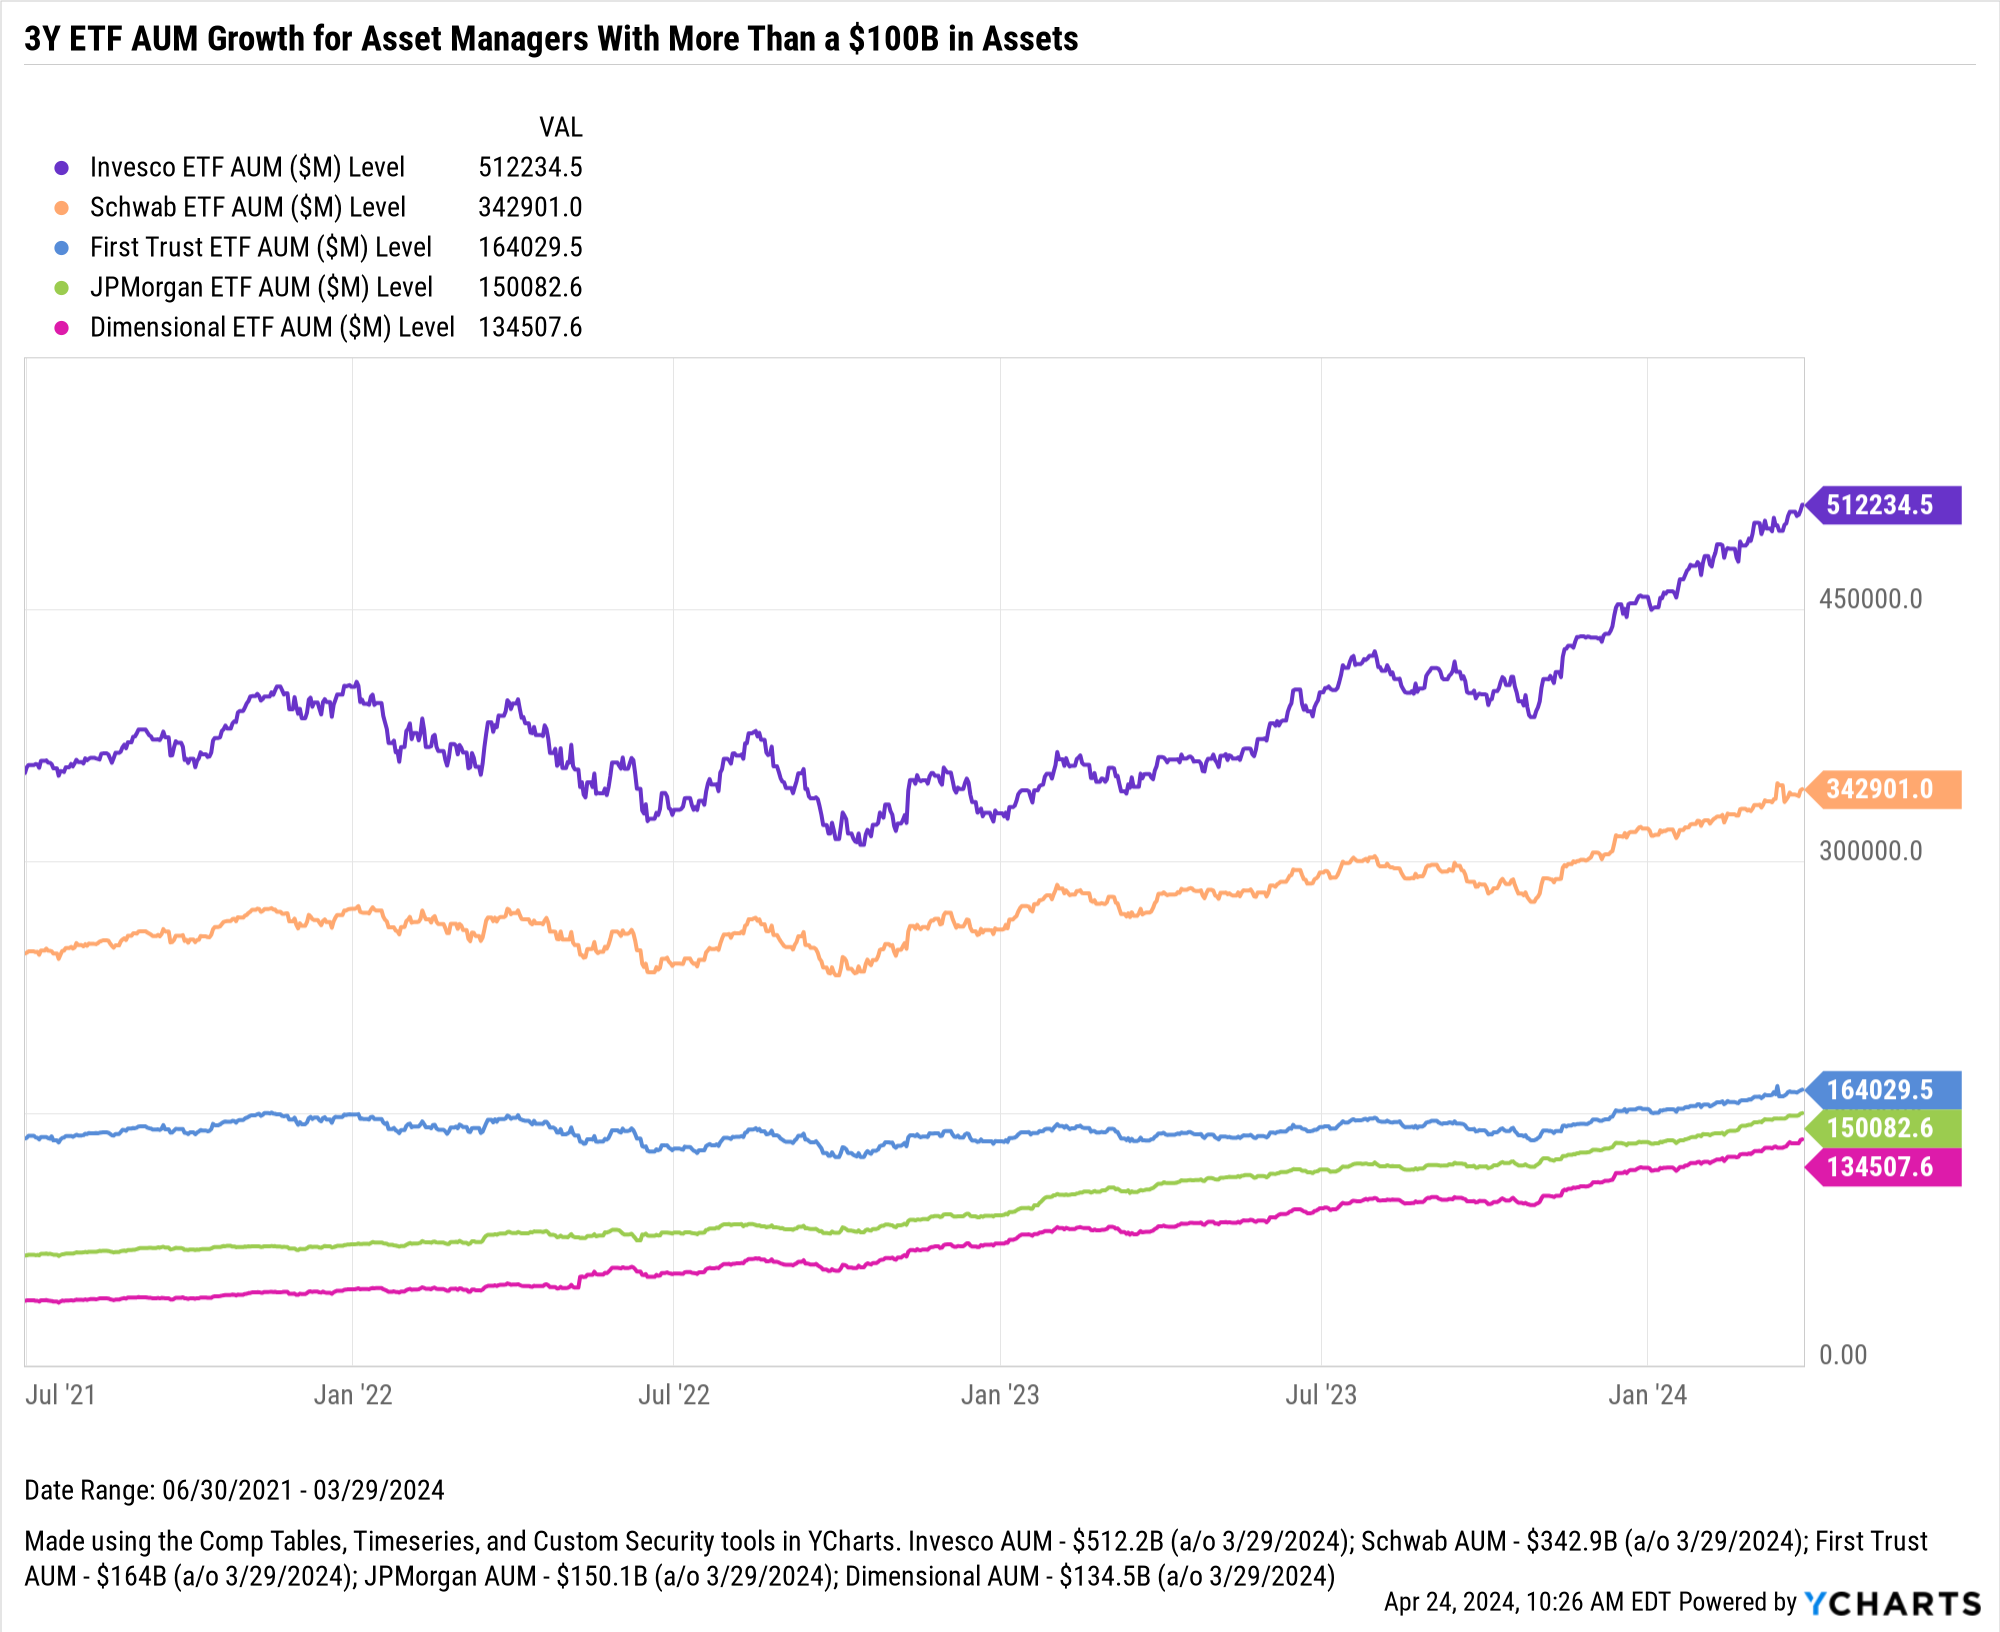
Of those firms, Invesco led the way with $512B in assets and brought in $19.5B in Q1, which is the most compared to their peers. JPMorgan was the biggest grower, based on 2024 flows as a percentage of their AUM.
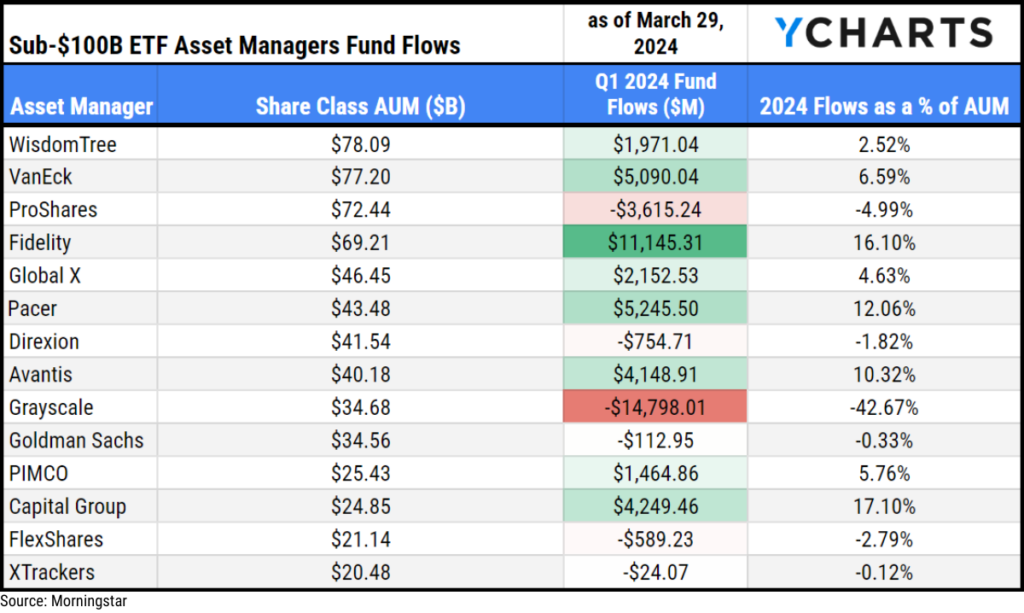
The 14 ETF asset managers with less than $100B total assets milestone and more than $20b are WisdomTree, VanEck, ProShares, Fidelity, Global X, Direxion, Pacer, Avantis, Goldman Sachs, PIMCO, Grayscale, Capital Group, FlexShares, and XTrackers.
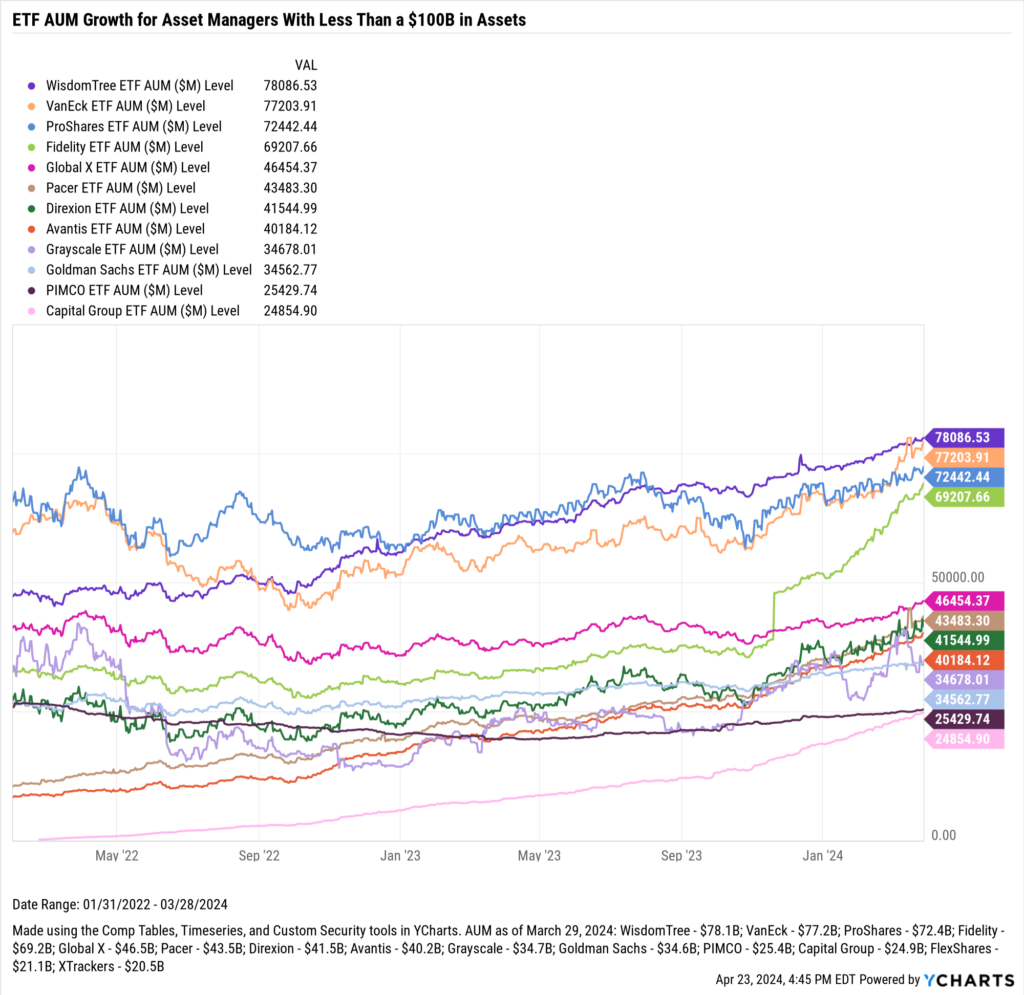
WisdomTree leads the way of those firms with $78B in assets, with VanEck closely behind with $77B. Fidelity brought in $11.1B, the most in Q1, and Capital Group was the biggest grower, based on 2024 flows as a percentage of AUM.
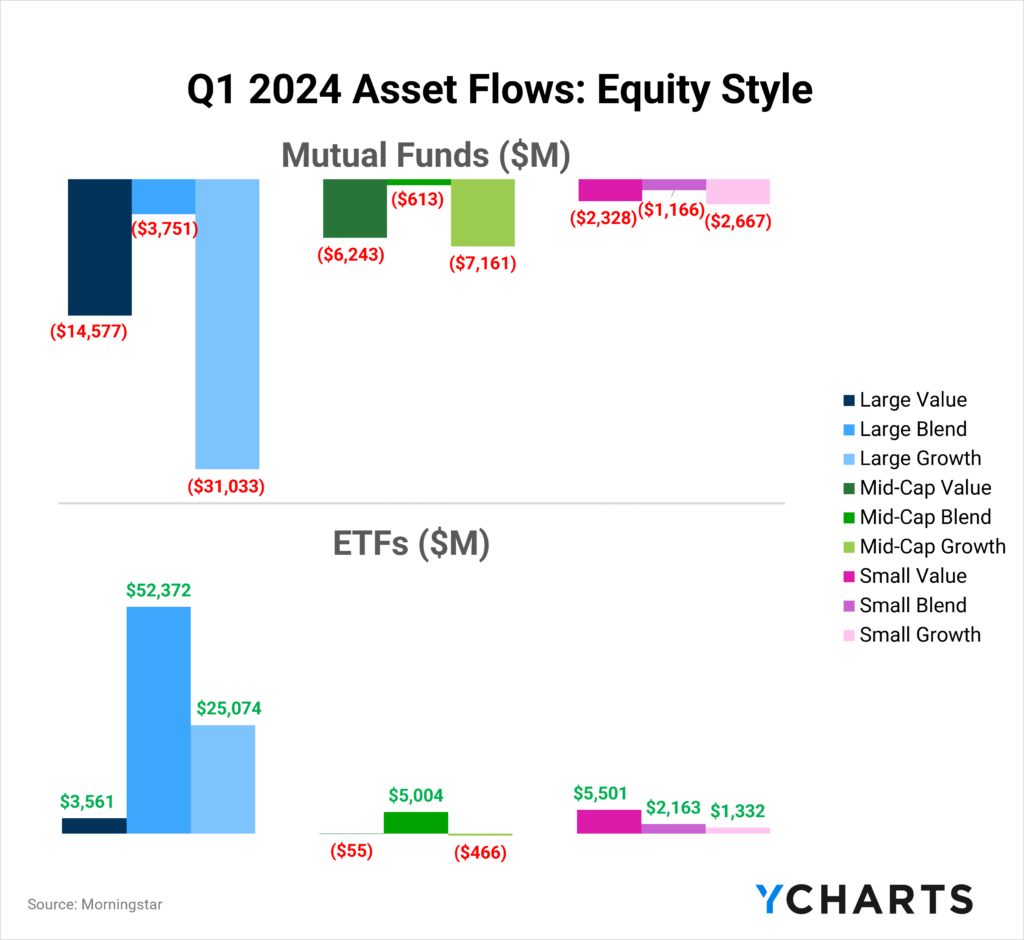
Inflows and Outflows for Equity ETFs and Mutual Funds in Q1 2024
All equity ETF styles saw positive inflows in Q1 2024 except for mid-cap growth and value. There were substantial outflows from Large Growth and Value mutual funds, but ETF inflows softened the impact of those departures, leading to net positive flows for equity strategies in the first quarter of 2024.
Here are some of Q1’s most popular and unpopular ETF and mutual fund categories and individual strategies:
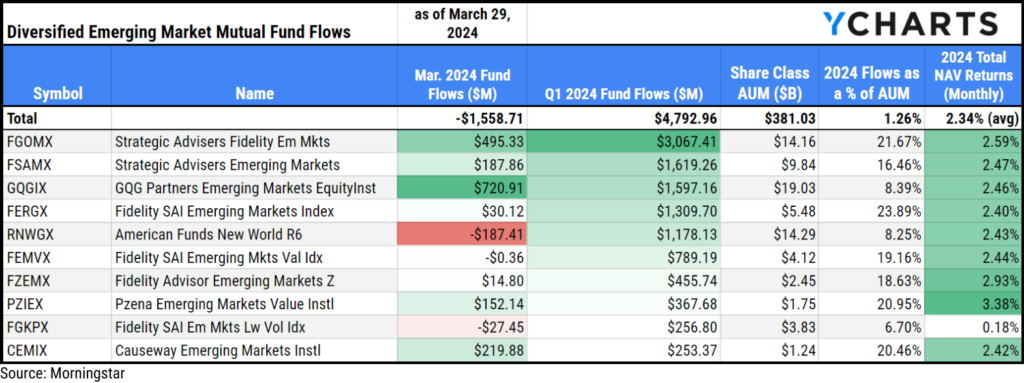
Inflows in Diversified Emerging Market Mutual Funds
Diversified Emerging Market funds were among the few equity mutual fund categories that saw positive flows in Q1. These funds brought in $4.8B over the year’s first three months, or 1.3% of the $381B across share classes in the category (as of March 29, 2024).
The fund that attracted the most assets was Strategic Advisers Fidelity Emerging Markets (FGOMX), with $3.1B year-to-date, which is 21.7% of its $14.2B share class AUM.
Despite facing $224.7M in outflows across share classes in the first quarter of 2024, Global Small and Mid-Cap mutual funds were March’s most popular equity category. These strategies attracted a net $137M across share classes, with American Funds SMALLCAP World R6 (RLLGX) leading the way with $302.9M in new assets in March.
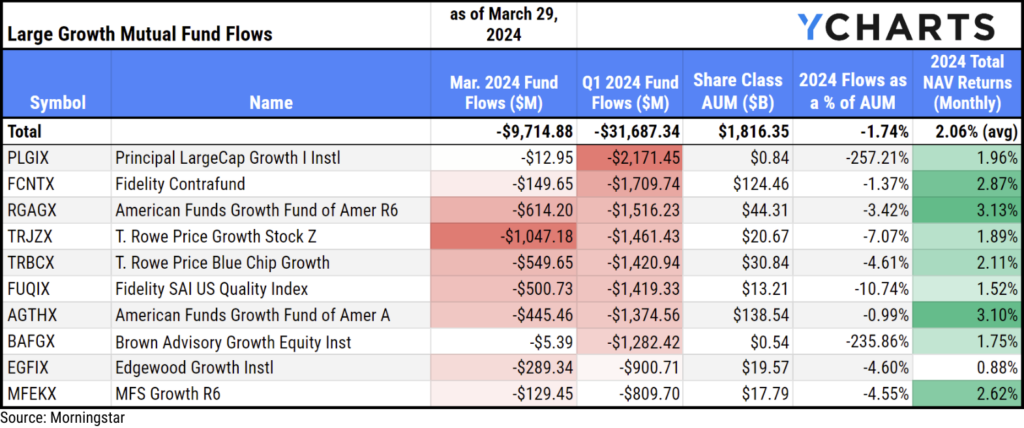
Outflows in Large Growth Mutual Funds
Throughout Q1, the Large Growth mutual funds category witnessed a significant outflow of $31.7B. March was a microcosm of the last year for large growth mutual funds, with $9.7B departing the strategies across share classes. Over the past 12 months, investors have withdrawn more than $100B from these funds, likely opting for tax-advantaged ETFs or seeking safety in money market funds.
Despite those outflows, there’s still almost $2T across share classes in Large Growth mutual funds. Below is a table of the funds that saw the most outflows in the category in Q1 2024.
Inflows in Large Blend ETFs
Large Blend ETFs brought in $32.4B in March. The Large Blend category has attracted $52.4B in 2024, which is 2% of the category’s $2.5T AUM.
The fund that attracted the most assets in Q1 was Vanguard S&P 500 ETF (VOO), bringing in $24.5B, or 5.6% of its $435.7B share class AUM.
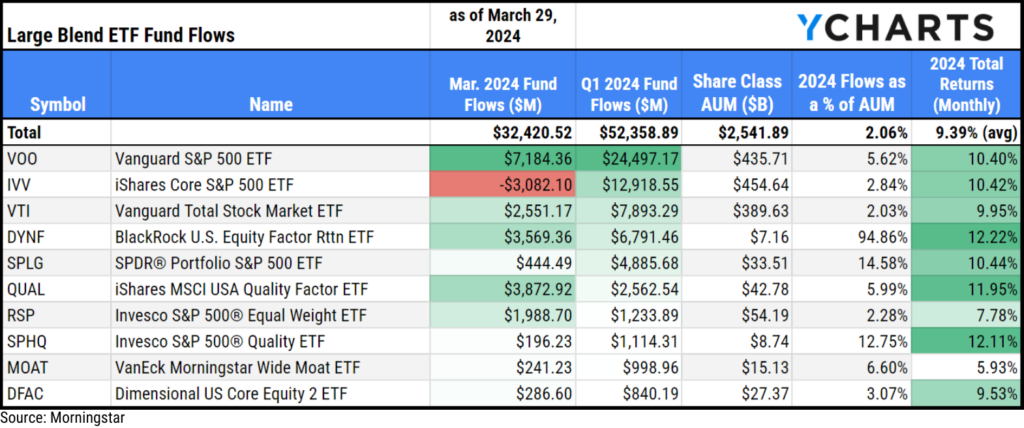
It is worth noting that upon an initial glance at the table above, one might wonder how the three top funds in the category were able to accumulate over $43B in inflows while the category as a whole only has $52.4B in net inflows. This is due to a $9.7B outflow from SPDR® S&P 500 ETF Trust (SPY); unlike IVV or VOO, SPY can be used disproportionately as a trading tool.
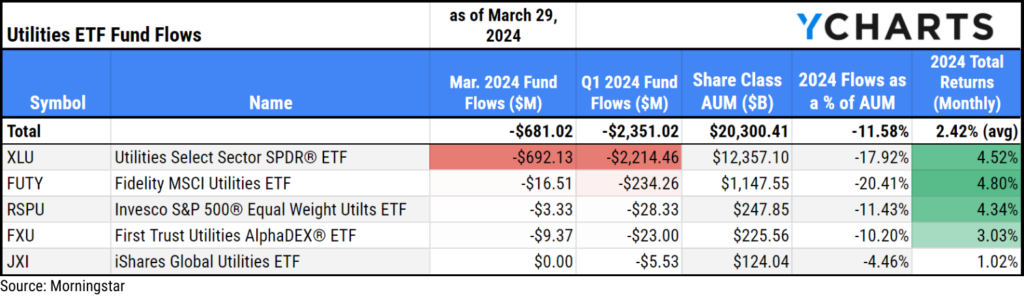
Outflows in Utilities ETF
Utilities ETFs shed $681M in March. Funds in the sector have seen $2.4B depart since the start of the year. Despite those outflows, Utilities ETFs contain $20.3B in AUM as of March 29, 2024. Below is a table of the Utilities ETFs that saw the most outflows in Q1 2024.
Q1 2024 Inflows and Outflows for Fixed Income Funds
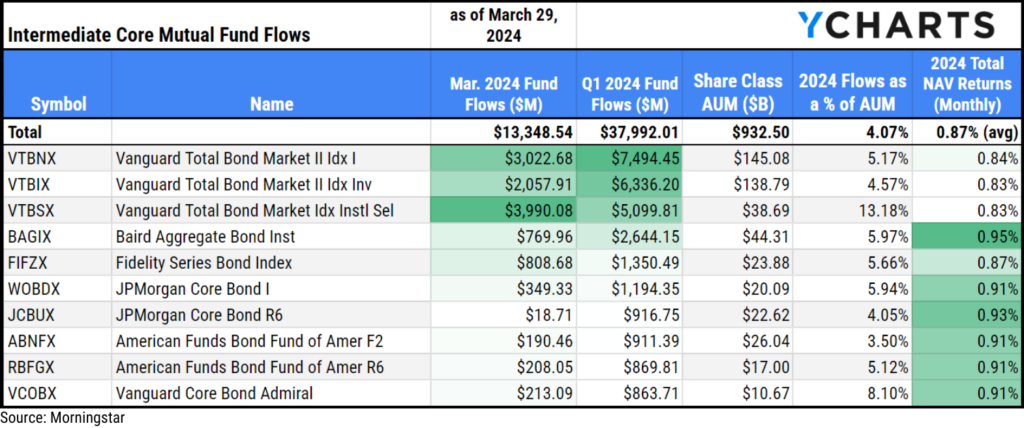
Inflows in Intermediate Core Bond Mutual Funds
Fixed Income funds significantly outpaced all other categories in fund flows, attracting $151.8B in Q1. The fixed income category that benefitted the most was Intermediate Core Bond Mutual Funds, bringing in $13.3B in March. March’s inflows brought cumulative flows in Q1 to $38B, punctuating a solid start to 2024. The category’s $38B inflows year-to-date account for 4.1% of the category’s $932.5B AUM across share classes.
The fund that attracted the most assets in Q1 was Vanguard Total Bond Market II Index I (VTBNX), with $7.5B, 5.2% of its $145.1B Share Class AUM.
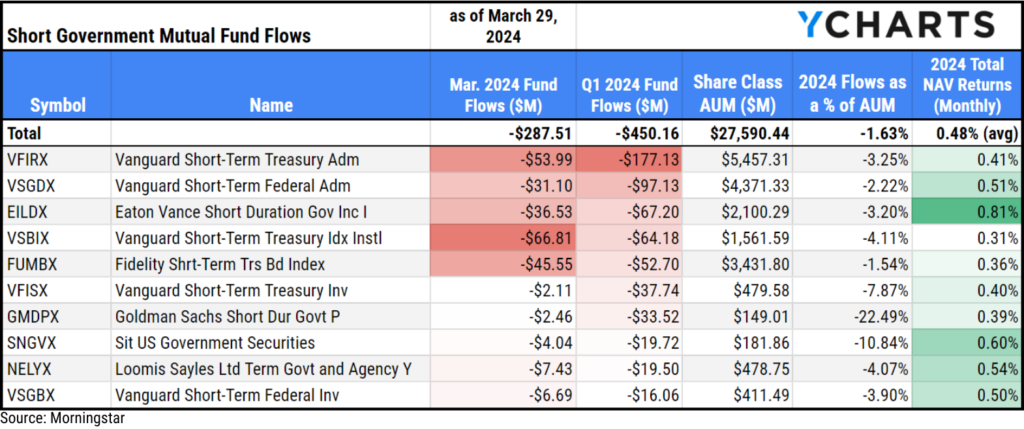
Outflows in Short Government Bond Mutual Funds
Many fixed-income ETFs and mutual funds experienced inflows. However, shorter-term strategies suffered consistent outflows. This may suggest that investors shifted towards bond funds with longer maturities to secure yields in anticipation of rate cuts.
Short Government Bond Mutual Funds witnessed over $450M across share classes leave the category in Q1. Despite those outflows, there’s still $27.6B in AUM in Short Government Bond mutual funds.
Below is a table of the funds that saw the largest outflows in the category in February.
Q1 2024 ETF Fixed Income Fund Flows
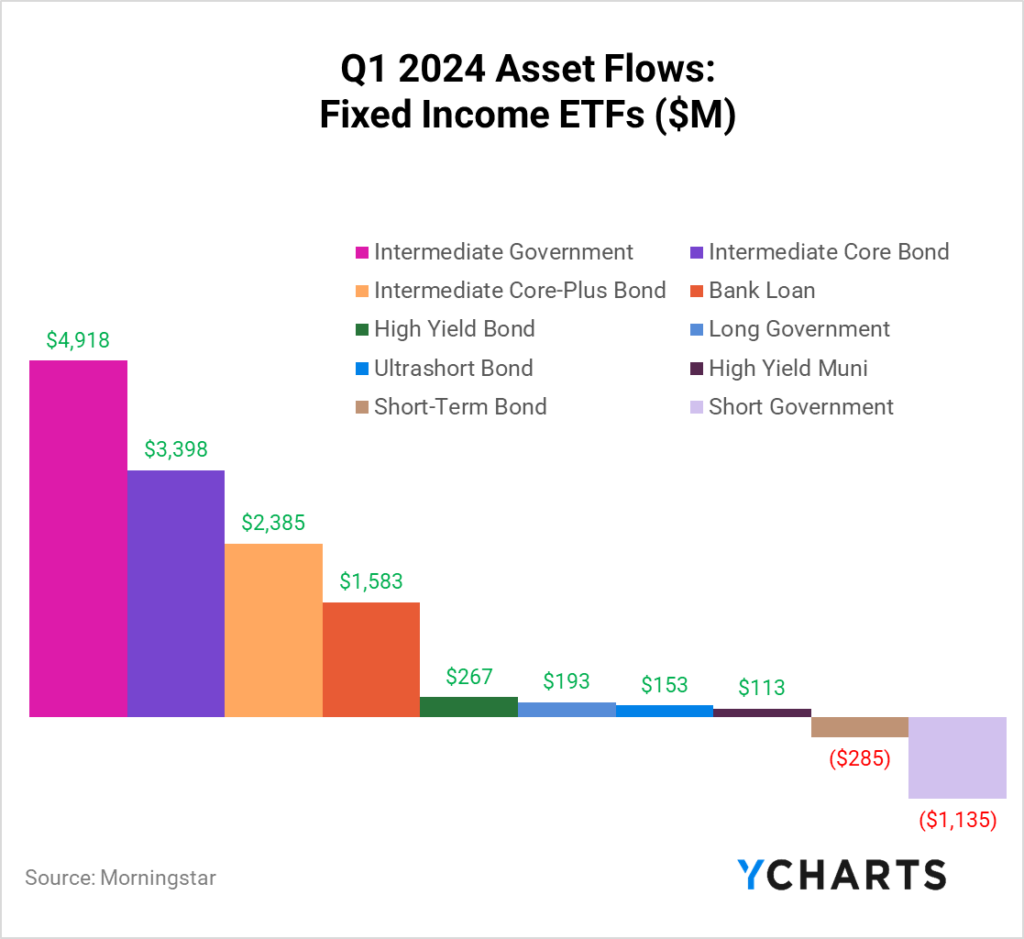
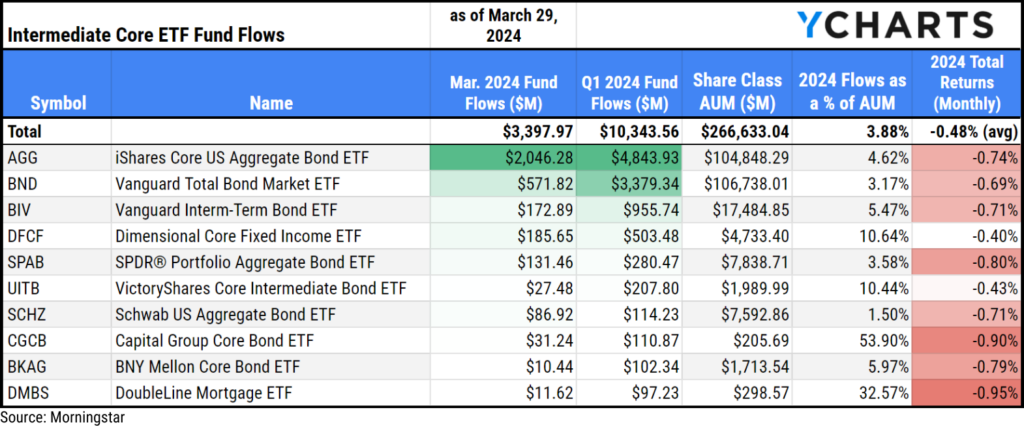
Inflows in Intermediate Core Bond ETFs
Intermediate Core Bond ETFs brought in $3.4B in March and attracted $10.3B in Q1 2024, representing 3.9% of the category’s $266.6B AUM.
The most popular strategies were the two biggest funds in the category. iShares Core US Aggregate Bond ETF (AGG) brought in $4.8B in Q1, which is 4.6% of its $104.9 AUM, and the Vanguard Total Bond Market ETF (BND) attracted $3.4B, which is 3.2% of its $106.7B AUM.
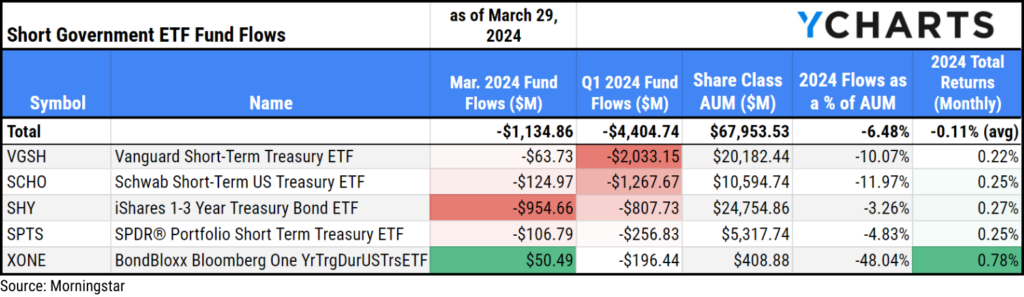
Outflows in Short Government ETFs
Short Government ETFs saw $4.4B leave the category in Q1. Despite those outflows, there’s still $68B in AUM in Short Government ETFs. Below is a table of the funds that saw the biggest outflows in the category in the first quarter of 2024.
New ETF Launches in Q1 2024
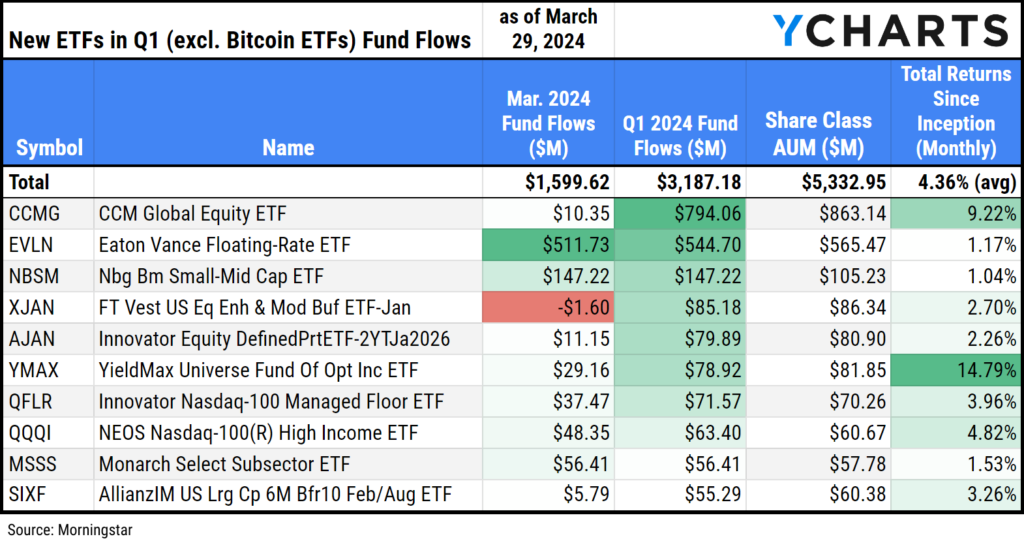
Before entirely putting Q1 in the rearview, we want to acknowledge the 144 new ETFs that began trading between January 1, 2024, through March 28, 2024, attracting over $30B in flows.
The nine new bitcoin ETFs dominated the headlines and brought in $26.9B, almost 90% of flows into ETFs launched in Q1 2024. You can track the flows into Bitcoin ETFs here.
Outside of the bitcoin ETFs, CCM Global Equity ETF (CCMG), Eaton Vance Floating-Rate ETF (EVLN), and Neuberger Berman Small-Mid Cap ETF (NBSM) led the way for the rookie funds pulling in $794M, $545M, and $147M respectively. If you want to see a list of ETFs, excluding the bitcoin ETFs, that started tracking performance in Q1, you can find it here.
Download Visual | Modify in Comp Tables in YCharts
And the complete list of all ETFs that started trading in Q1 is here.
Data used in this article is sourced from Morningstar data.
Whenever you’re ready, there are three ways YCharts can help you:
Have questions about how YCharts can help you grow AUM and prepare for meetings?
Email us at hello@ycharts.com or call (866) 965-7552. You’ll get a response from one of our Chicago-based team members.
Unlock access to our Fund Flows Report and Visual Deck by becoming a client.
Dive into YCharts with a no-obligation 7-Day Free Trial now.
Sign up for a copy of our Fund Flows Report and Visual Deck (clients only):
Disclaimer
©2024 YCharts, Inc. All Rights Reserved. YCharts, Inc. (“YCharts”) is not registered with the U.S. Securities and Exchange Commission (or with the securities regulatory authority or body of any state or any other jurisdiction) as an investment adviser, broker-dealer or in any other capacity, and does not purport to provide investment advice or make investment recommendations. This report has been generated through
Next Article
Economic Update: Reviewing Q1 2024Read More →