A Closer Look at February Fund Flows: Fixed Income, Semiconductor Funds Flourish

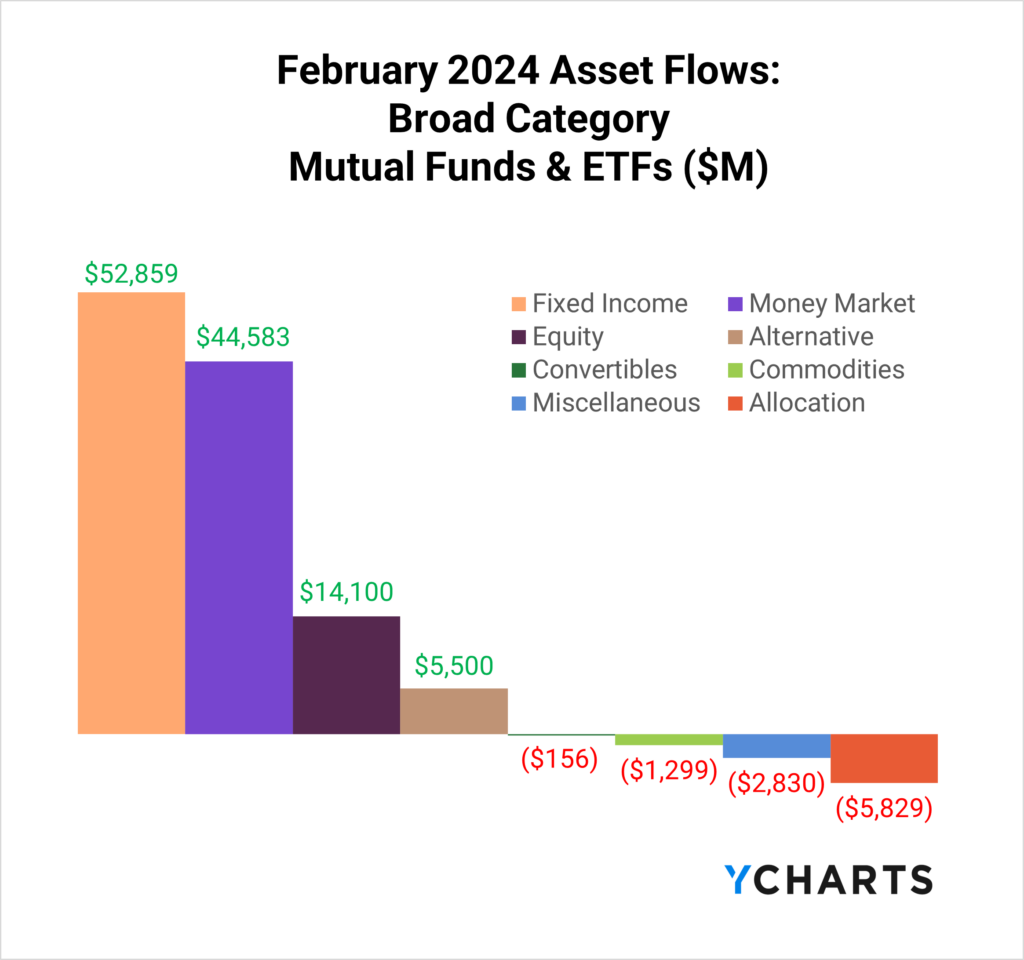
February 2024 was a big month for Fixed Income funds–overtaking the still-strong Money Market funds in inflows–with $52.9B pouring into the strategies. Equity funds rebounded from a tough January with $14.1B in inflows. The story of the year so far impacted broad category flows as the launch of new bitcoin ETFs energized Alternatives.
Read on to see how money moved in and out of strategies in more specific categories. Clients: sign up to get YCharts’ full Fund Flow Report sent directly to your inbox.
For a more nuanced look at monthly flows, sign up for a copy of our Fund Flows Report and Visual Deck (clients only):Active ETFs vs Passive ETFs
Based on a 2023 survey conducted by the Money Management Institute, 42% of asset managers currently support active ETFs, while an additional 33% plan to do so soon. Moreover, among those asset managers who already offer active ETFs, 75% have plans to increase their support for this type of investment vehicle.
One reason behind this trend is the growing demand for active ETFs from wealth managers, with 89% already using these vehicles. Of those currently using active ETFs, 42% have expressed their intention to increase their focus on this investment option.
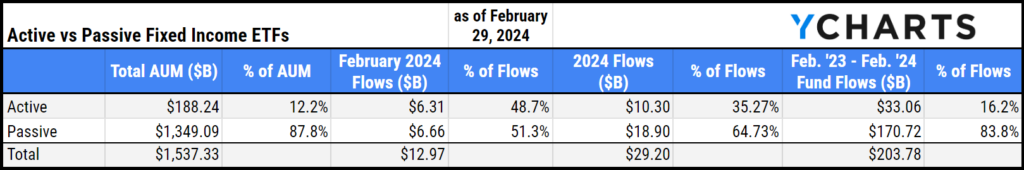
Of the $13B that went into Fixed Income ETFs in February, $6.3B (or 48.7%) came from active strategies despite only making up 12% of Fixed Income ETF AUM (as of February 29th). Furthermore, from February 2023 until February 2024, $33.1B went into active fixed-income ETFs. Active represents 16% of the $203.8B that went into fixed-income strategies overall.
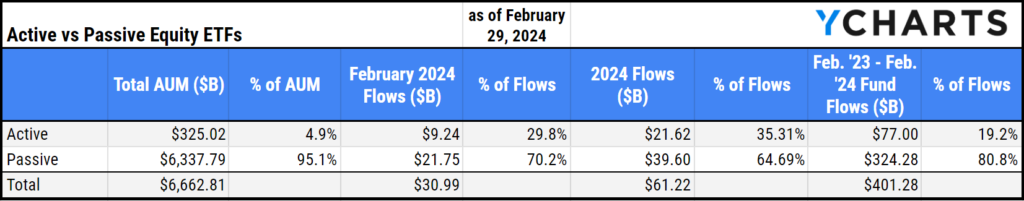
This dynamic is even more staggering in equity ETFs, where despite making up 5% of AUM, active equity ETFs accounted for 30% of inflows in February and 19% of flows from February 2023 through February 2024.
ETF Topics of the Moment: Semiconductor ETFs Continue to Attract Assets
While Bitcoin and Bitcoin ETFs continue to attract investor attention, other ETF themes saw significant inflows in February and deserve some recognition. One of those major themes was semiconductors.
Semiconductor ETFs (excluding leveraged or inversed ETFs) brought in $635M in February and $4.4B over the past year. Investors have likely been trying to find more diversified ways to gain exposure to the “picks and shovels” of the AI momentum in the stock market.
The biggest benefactor of these flows has been VanEck Semiconductor ETF (SMH), reeling in $925M in February (and $2.9B over the past year). Not to mention, it has also produced 21% YTD returns as of February 29, 2024.

Download Visual | Modify Comp Table in YCharts
Leveraged & Inversed ETFs
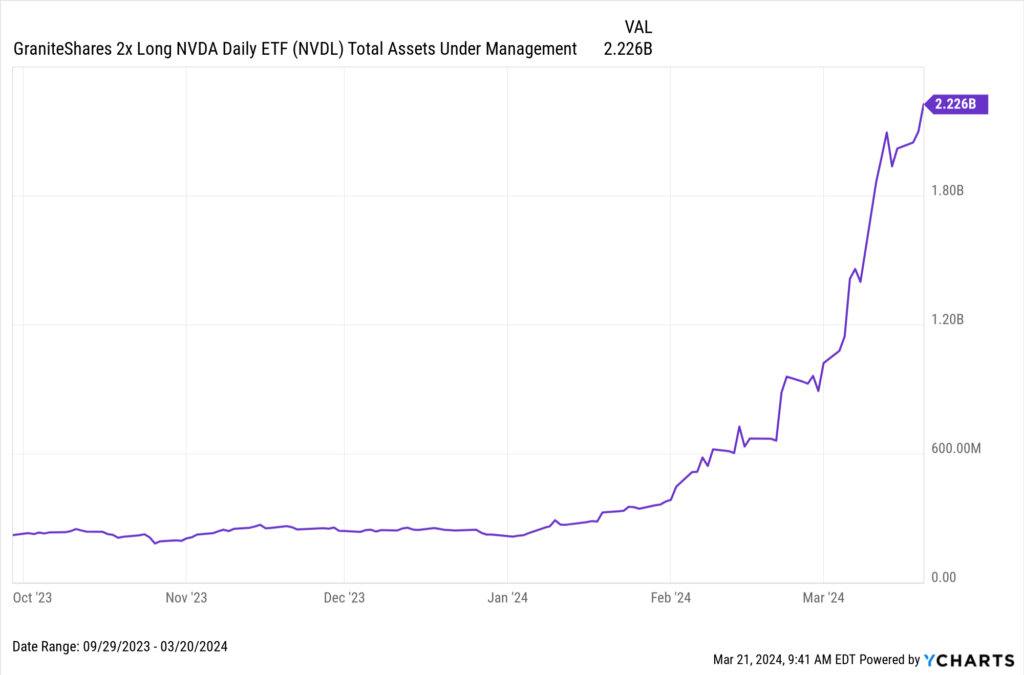
Traditional and thematic ETFs provide a decent indication of investor sentiment. However, leveraged and inverse ETFs can paint a more accurate indication based on the risk an investor would be taking to be in one of these funds.
This is most evident in GraniteShares 2x Long NVDA Daily ETF (NVDL)’s acceleration to $2 billion in AUM when the fund had less than $250 million in assets six months ago. This can help show investors’ bullish sentiment about NVIDIA (NVDA).
Download Visual | View & Modify in YCharts
Other inverse and leveraged funds that have had some positive momentum and attracted funds year to date include ProShares UltraPro Short QQQ (SQQQ), Direxion Daily 20+ Yr Treasury Bull 3X ETF (TMF), and Direxion Daily FTSE China Bull 3X ETF (YINN), have brought in $766M, $753M, and $364M, respectively, through the end of February.
February Inflows and Outflows for Equity Funds
With the exception of mid-cap growth and value, all equity ETF styles saw positive inflows in February 2024. Large and Small Blend mutual funds had modest inflows, but for the most part, ETF inflows softened the impact of mutual fund outflows.
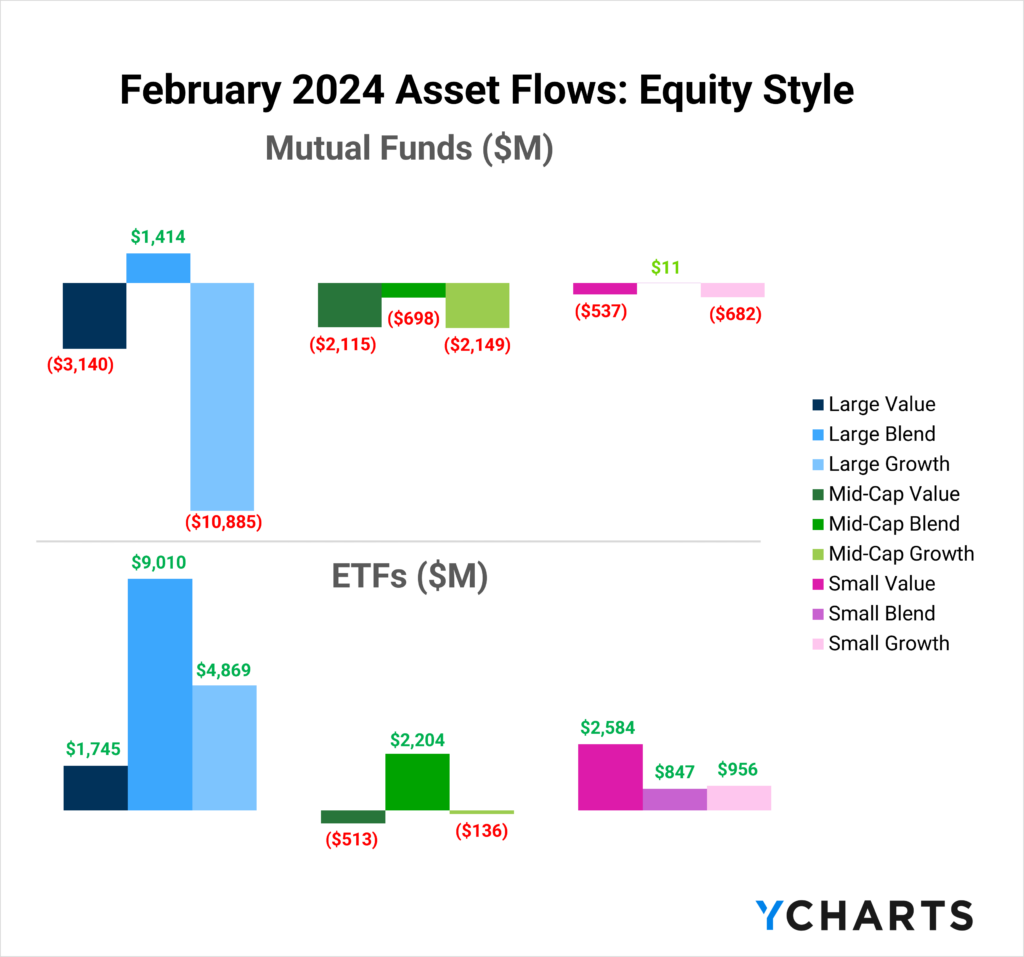
Here are some of February’s most popular and unpopular ETF and mutual fund categories and individual strategies:
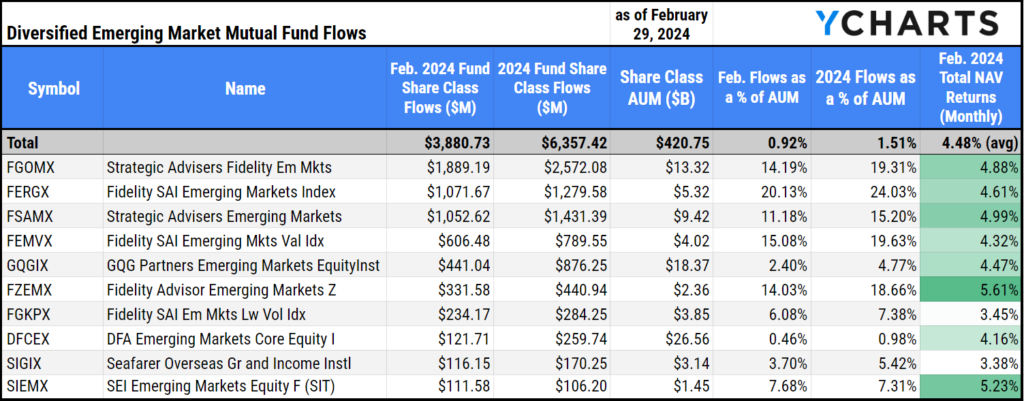
Inflows in Diversified Emerging Market Mutual Funds
Continuing January’s trend, Diversified Emerging Markets was once again one of the few equity mutual fund categories to see positive flows. These funds brought in $3.9B in February. These strategies have attracted $6.4B through two months of the year, or 1.5% of the $421B across share classes in the category.
The fund that attracted the most assets was Strategic Advisers Fidelity Emerging Markets (FGOMX), with $1.9B. FGOMX has attracted $2.6B year-to-date, which is 14% of its $13.3B share class AUM.
Download Visual | Modify Comp Table in YCharts
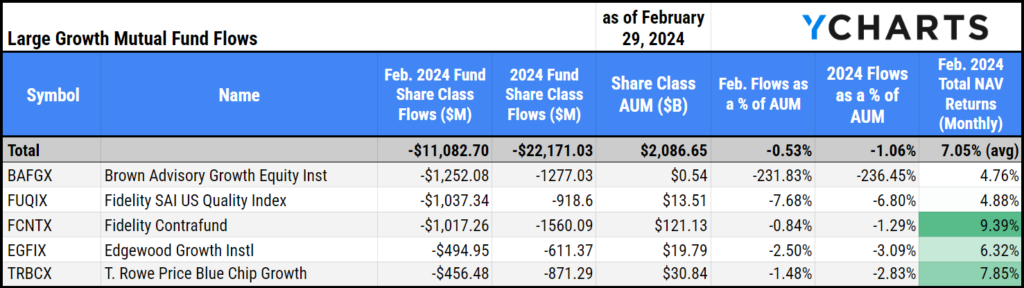
Outflows in Large Growth Mutual Funds
In February, the Large Growth mutual funds category witnessed a significant outflow of $11.1B, marking a continued trend of outflows. Over the past 12 months, investors have withdrawn more than $100B from these funds, likely opting for tax-advantaged ETFs or seeking safety in money market funds.
Despite those outflows, there’s still $2T across share classes in Large Growth mutual funds. Below is a table of the funds that saw the most outflows in the category in February.
Download Visual | Modify Comp Table in YCharts
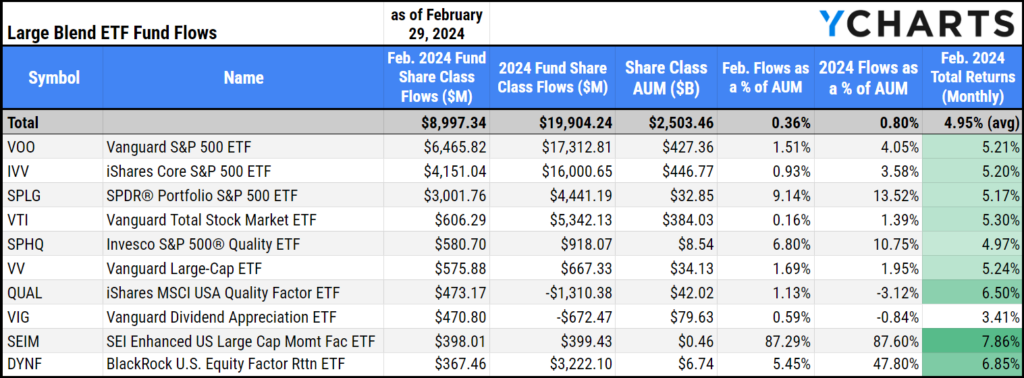
Inflows in Large Blend ETFs
Large Blend ETFs brought in $9B in February. The Large Blend category has attracted $19.9B so far in 2024, which is less than 1% of the category’s $2.5T AUM.
The fund that attracted the most assets was Vanguard S&P 500 ETF (VOO), bringing in $6.5B, or 1.5% of its $427B share class AUM.
Download Visual | Modify Comp Table in YCharts
It is worth noting that upon an initial glance at the table above, one might wonder how the three top funds in the category were able to accumulate over $13B in inflows while the category as a whole only has $9B in net inflows. This is due to a $8.2B outflow from SPDR® S&P 500 ETF Trust (SPY); unlike IVV or VOO, SPY can be used disproportionately as a trading tool.
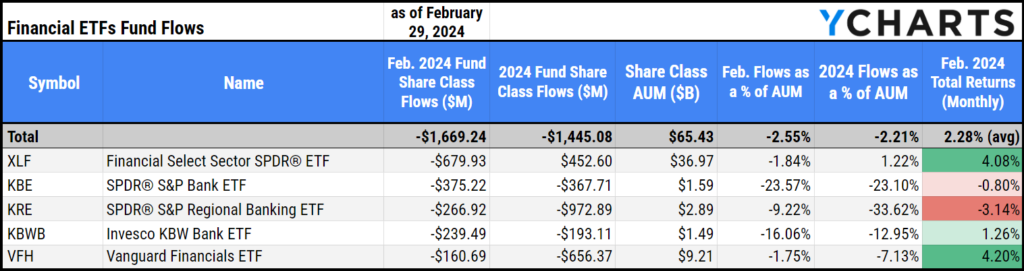
Outflows in Financial ETFs
After a slight recovery in January, Financial ETFs shed $1.7B in February. Funds in the sector have seen $3.2B depart over the past 12 months. Despite those outflows, Financial ETFs contain $65B in AUM. Below is a table of the Financial ETFs that saw the most outflows in February.
Download Visual | Modify Comp Table in YCharts
February Inflows and Outflows for Fixed Income Funds
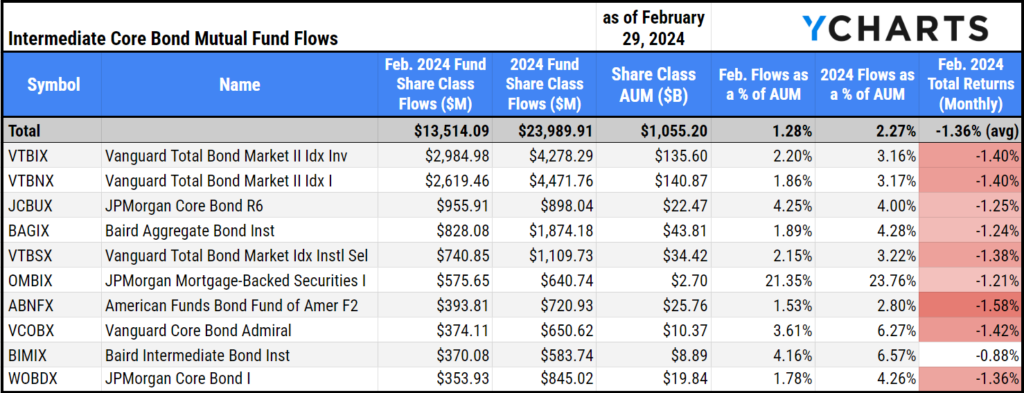
Inflows in Intermediate Core Bond Mutual Funds
Fixed Income funds outpaced all other categories in fund flows, attracting $52.9B in February. The fixed income category that benefitted the most was Intermediate Core Bond Mutual Funds, continuing a strong start to 2024 by bringing in $13.5B in February. The category’s $24B inflows year-to-date account for 1.3% of the category’s $1.1T AUM across share classes.
The fund that attracted the most assets was Vanguard Total Bond Market II Index Investor (VTBIX), with $3B, which is 2% of its $135.6B Share Class AUM.
Download Visual | Modify Comp Table in YCharts
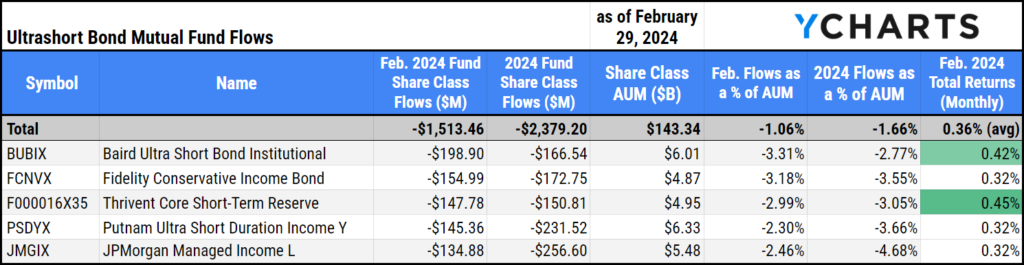
Outflows in Ultrashort Bond Mutual Funds
Many fixed-income ETFs and mutual funds experienced inflows. However, shorter-term strategies suffered consistent outflows. This may suggest that investors shifted towards bond funds with longer maturities to secure yields in anticipation of rate cuts.
Ultrashort Bond Mutual Funds saw $1.5B leave the category. Despite those outflows, there’s still $143.3B in AUM in Ultrashort Bond mutual funds.
Below is a table of the funds that saw the largest outflows in the category in February.
Download Visual | Modify Comp Table in YCharts
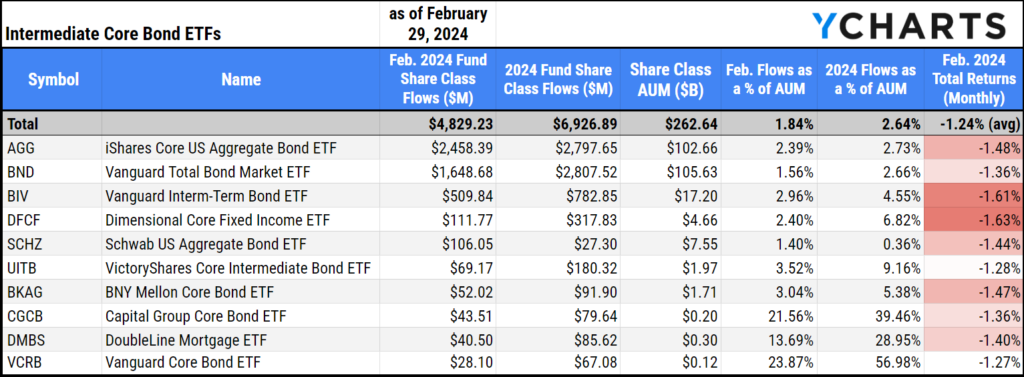
Inflows in Intermediate Core Bond ETFs
Intermediate Core Bond ETFs brought in $4.8B in February and have now attracted $6.9B so far in 2024, representing 1.8% of the category’s $262B AUM.
The most popular strategies were the two biggest funds in the category. iShares Core US Aggregate Bond ETF (AGG) brought in $2.5B, which is 2.4% of its $102B AUM, and the Vanguard Total Bond Market ETF (BND) attracted $1.7B, which is 1.6% of its $105B AUM.
Download Visual | Modify Comp Table in YCharts
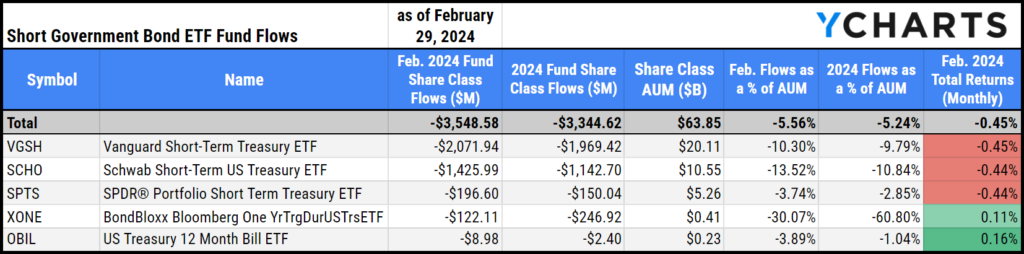
Outflows in Short Government ETFs
Short Government ETFs saw $3.6B leave the category in February. Despite those outflows, there’s still $63.9B in AUM in Short Government ETFs. Below is a table of the funds that saw the biggest outflows in the category in January.
Download Visual | Modify Comp Table in YCharts
Data used in this article is sourced from Morningstar.
Whenever you’re ready, there are three ways YCharts can help you:
Have questions about how YCharts can help you grow AUM and prepare for meetings?
Email us at hello@ycharts.com or call (866) 965-7552. You’ll get a response from one of our Chicago-based team members.
Sign up for a copy of our Fund Flows Report and Visual Deck (clients only):
Unlock access to our Fund Flows Report and Visual Deck by becoming a client.
Dive into YCharts with a no-obligation 7-Day Free Trial now.
Disclaimer
©2024 YCharts, Inc. All Rights Reserved. YCharts, Inc. (“YCharts”) is not registered with the U.S. Securities and Exchange Commission (or with the securities regulatory authority or body of any state or any other jurisdiction) as an investment adviser, broker-dealer or in any other capacity, and does not purport to provide investment advice or make investment recommendations. This report has been generated through
Next Article
Navigating the New Era of Bitcoin ETFs with YChartsRead More →