Navigating the New Era of Bitcoin ETFs with YCharts
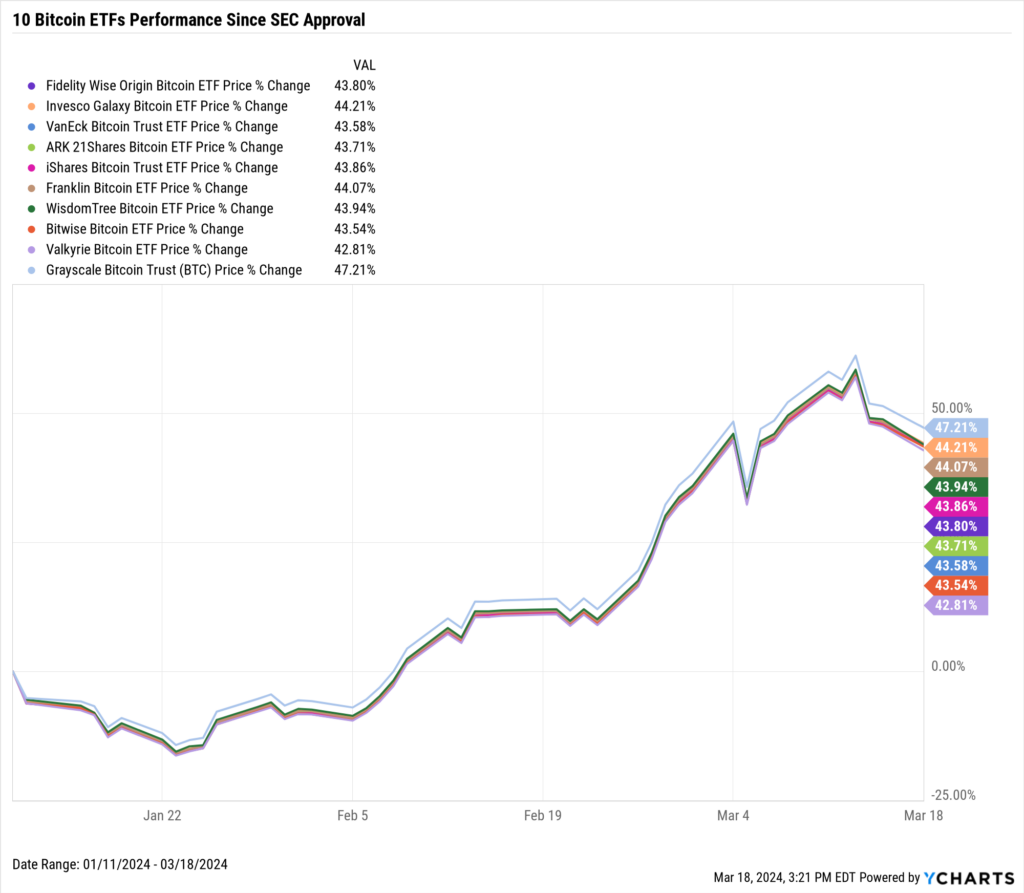
The Securities and Exchange Commission (SEC)’s January 11th ruling, which gave 10 spot-price Bitcoin ETFs the go-ahead, drastically increased Bitcoin’s accessibility for everyday investors. The approval also created a landmark moment for fund providers.
Since then, the race has been on for firms like Invesco, ARK, VanEck, Fidelity, iShares, and more to differentiate their ETF product and convince advisors that their ETF is where they should be putting clients’ assets.
Download Visual | View & Modify in YCharts
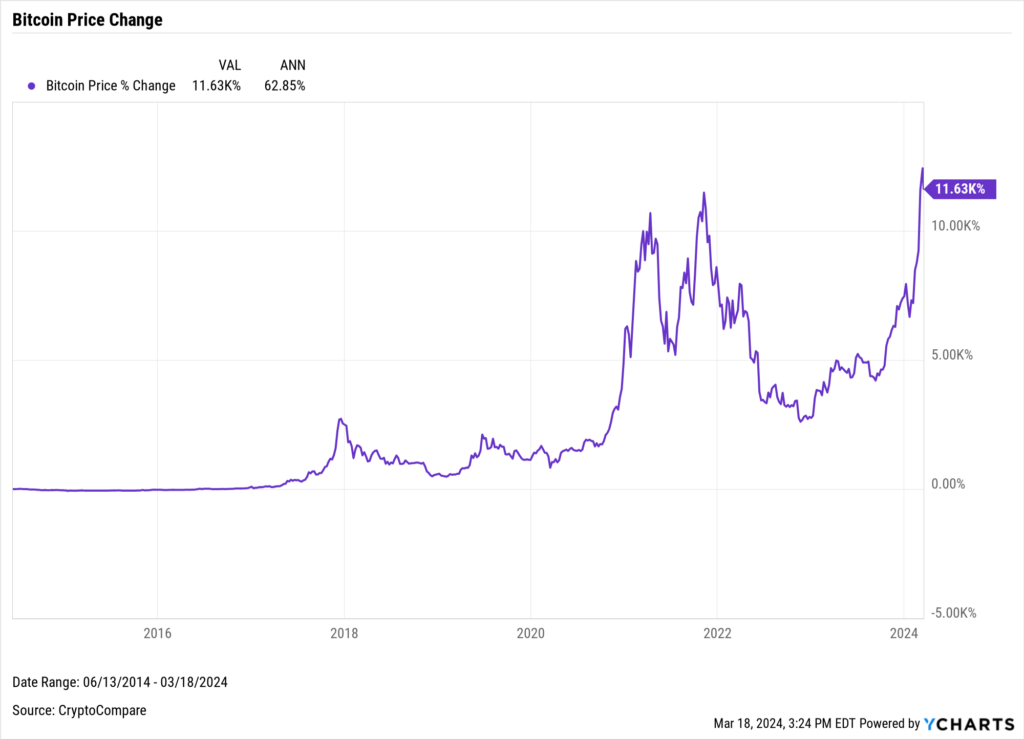
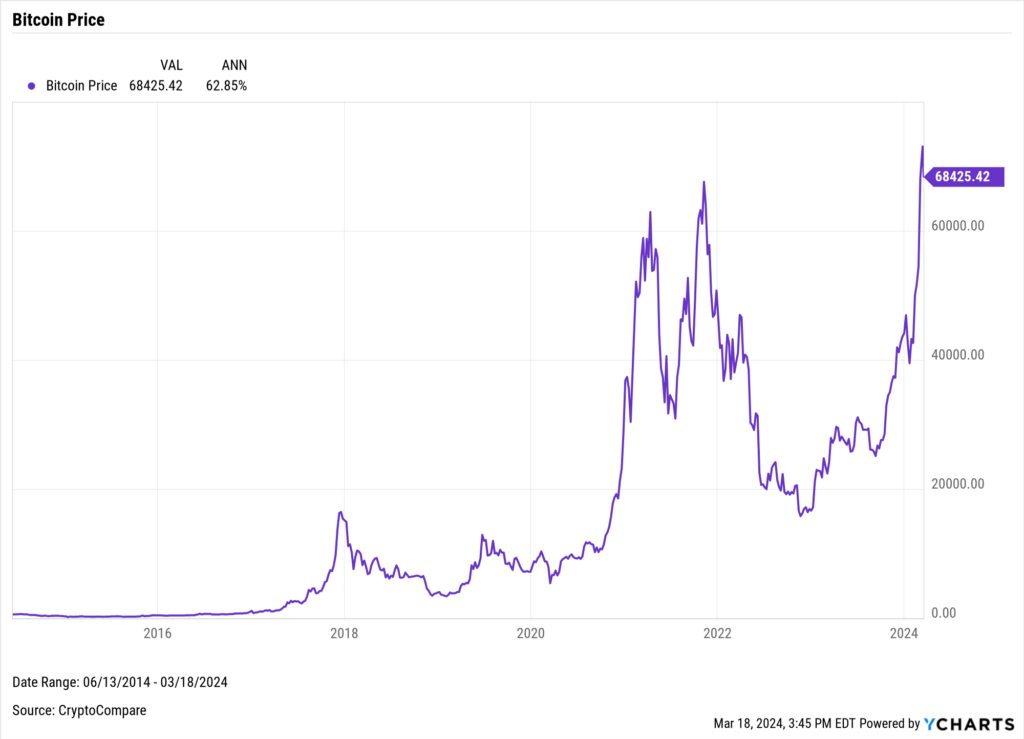
Bitcoin’s price has increased by 11.6K% over the last decade. However, for most of its existence, Bitcoin has had significant barriers that kept it from being easily accessible to the general public. The SEC ruling changed that.
Download Visual | View & Modify in YCharts
Bitcoin’s Price Surge Post-ETF Introduction
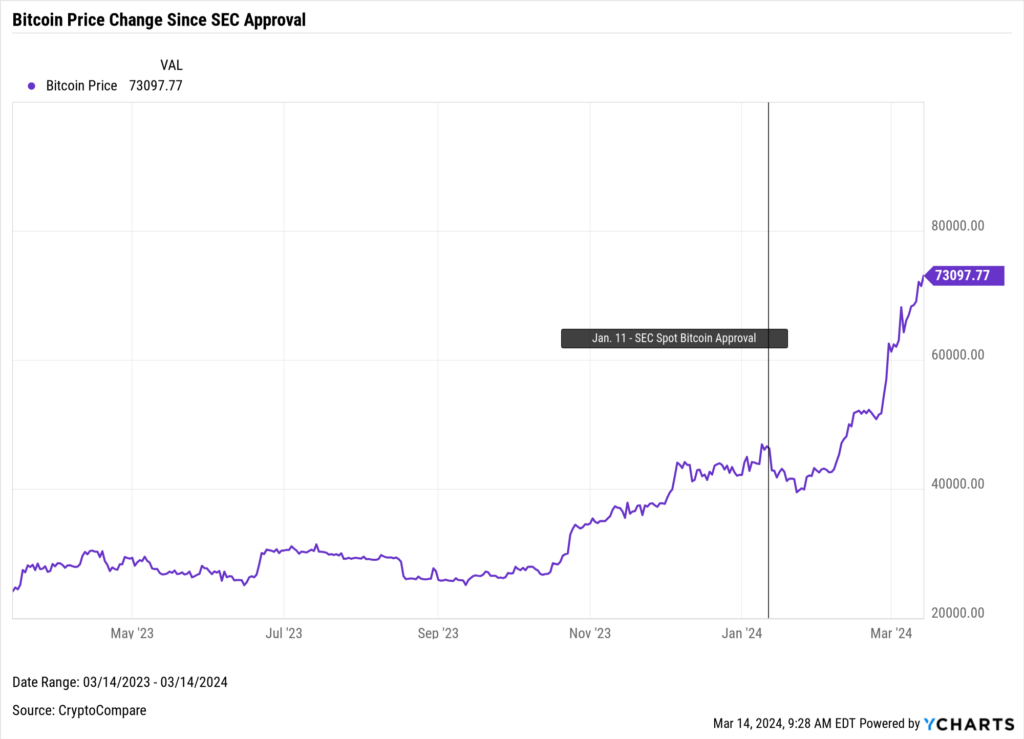
In our LinkedIn newsletter, we previously asked whether the introduction of spot Bitcoin ETFs would increase Bitcoin’s price. At present, the answer to that question seems to be a resounding yes.
Following the SEC’s decision on January 11, Bitcoin’s value soared to an all-time high of $73,097 on March 14, marking a 57% increase from its January 11th value of $46,105.
Download Visual | View & Modify in YCharts
It hasn’t just been the price change that’s been impressive, either. According to January fund flows, Bitcoin ETFs had more AUM than Silver ETFs ($15.9B). Since then, that gap has only widened. Now, despite being less than three months old, Bitcoin ETFs ($57.8B) are closing in on Gold ETFs ($98.6B).
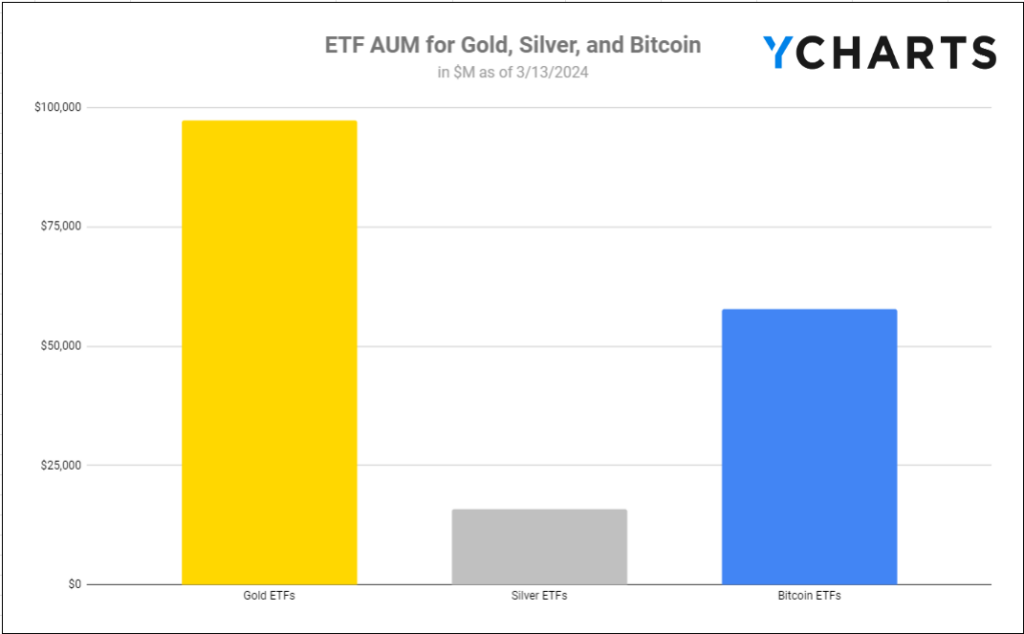
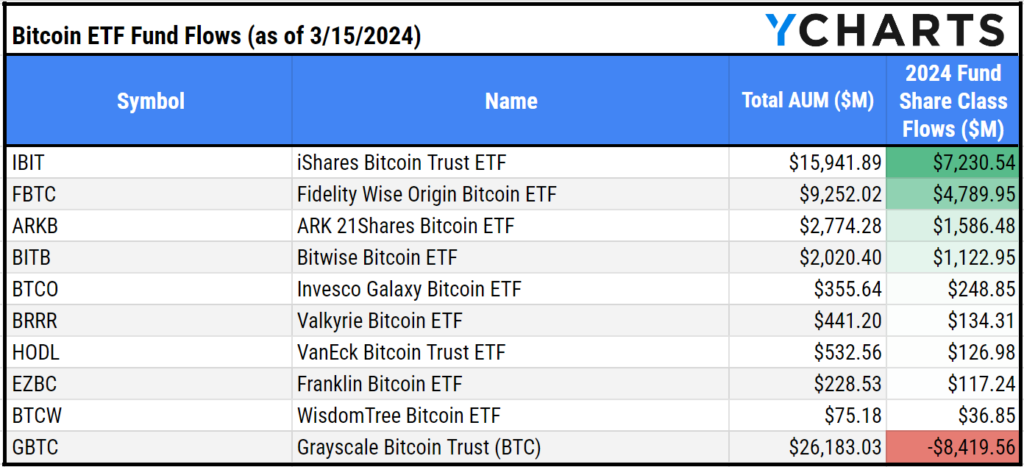
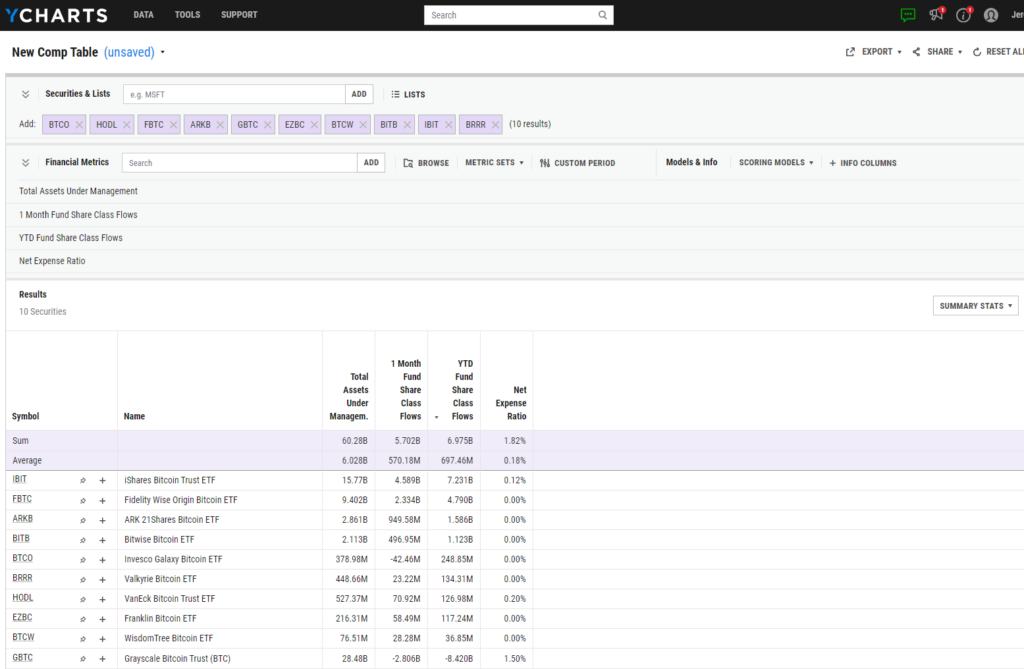
The flows into these products have been primarily driven by iShares Bitcoin Trust ETF (IBIT), Fidelity Wise Origin Bitcoin ETF (FBTC), ARK 21Shares Bitcoin ETF (ARKB), and Bitwise Bitcoin ETF (BITB), which have all surpassed $2 billion in AUM.
IBIT became the fastest ETF in history to reach $10B in AUM after just 7 weeks. Now, FBTC looks like it’s next in line to become the 168th ETF to reach the deca-billion milestone.
Download Visual | Modify Comp Table in YCharts
With a Bitcoin halving on the horizon and firms like Merrill Lynch and Wells Fargo adding these strategies to their brokerage platforms, the momentum in these ETFs could just be getting started.
For investors and advisors first being introduced to Bitcoin, halving is where the number of generated Bitcoin rewarded to miners is reduced by half. This effectively slows the amount of new supply being brought into the market until the next halving event, which will occur roughly four years later.
The next Bitcoin halving event is expected to occur in April 2024, when rewards to miners are scheduled to decrease from 6.25 BTC to 3.125 BTC.
After the most recent halving events in July 2016 and May 2020, the price of Bitcoin increased by 352% and 298%, respectively, 12 months later.
Bitcoin ETFs’ Parallels To Gold and Other First-Time ETFs
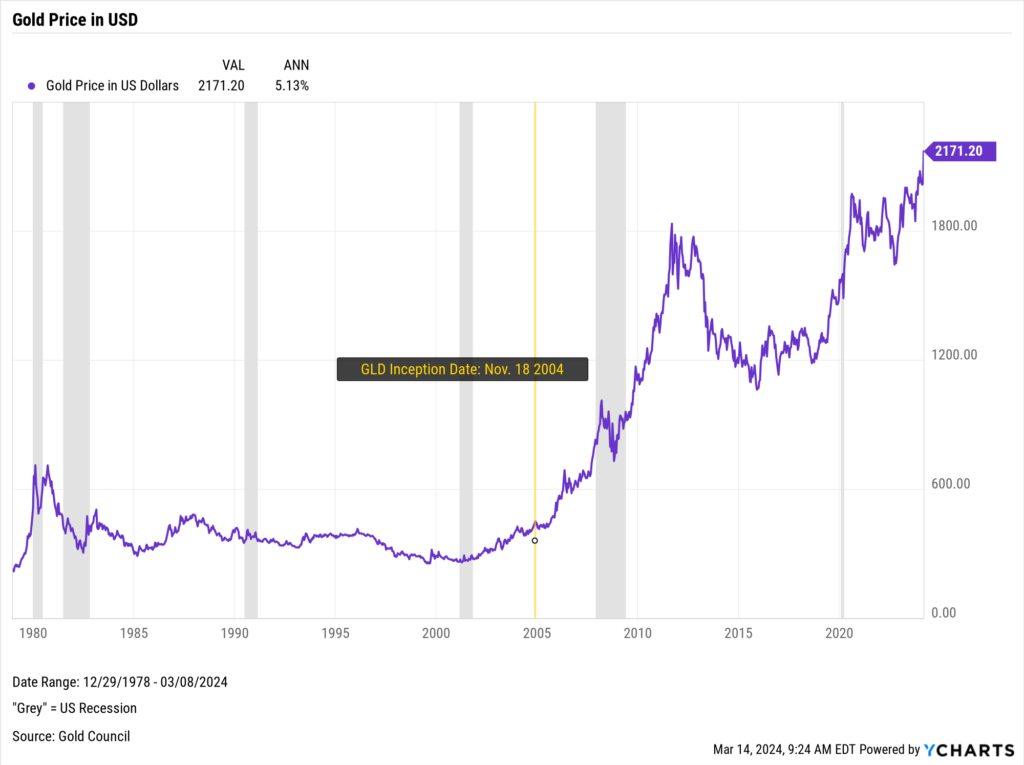
This talk of mining is one reason why, as Bitcoin has gained more mainstream notoriety in recent years, it has occasionally been positioned as “digital gold” due to its limited supply. Only 21 million Bitcoin will ever be “mined” (19.7 million have already been “mined”). Since the comparison is so well known, let’s take a look at what happened to gold when the biggest spot-gold ETF –SPDR® Gold Shares (GLD) – launched in 2004.
Download Visual | View & Modify in YCharts
Since the launch of GLD, gold’s price has increased by 391.2% (8.6% annualized) over 19 years. Today, there are 35 precious metal exchange-traded products (excluding leveraged & inverse funds, including miners) with a combined $125.51B in AUM.
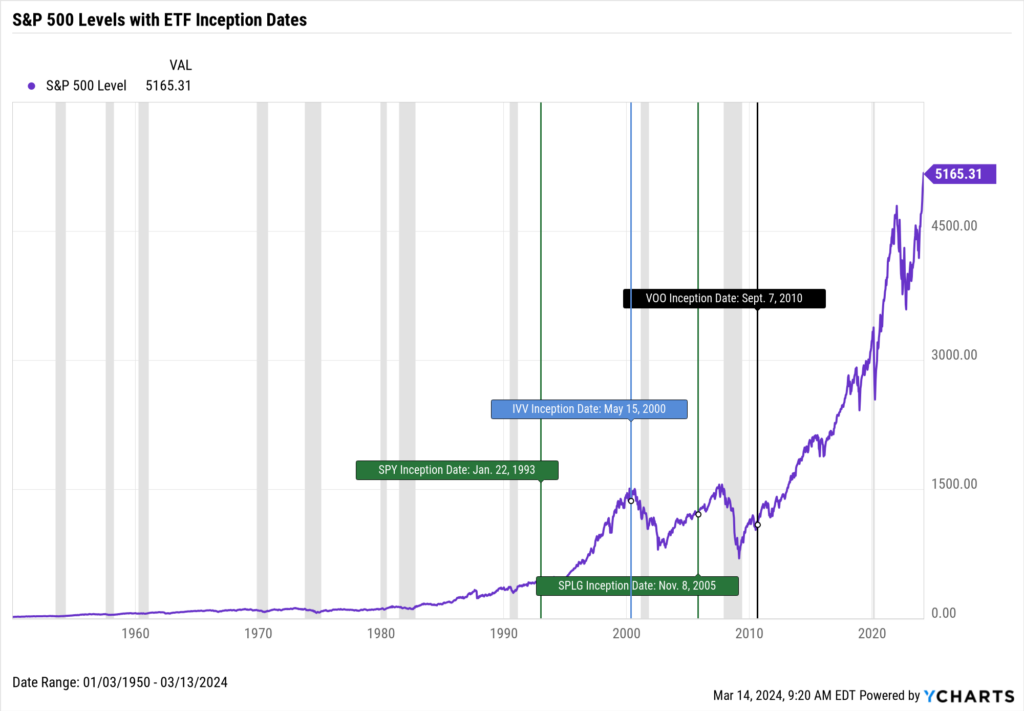
This trend isn’t just limited to commodities. There was a much more staggered launch of ETFs in the equity space, but the accumulation of assets by these products in less than 20 years has been significant.
In 1993, SPDR® S&P 500 ETF Trust (SPY) was launched to track the S&P 500. Since then, the S&P’s price has gone from 436.11 to over 5,000 (a 1.08K% increase, 8.26% annualized). Between SPY, Vanguard S&P 500 ETF (VOO), iShares Core S&P 500 ETF (IVV), and SPDR® Portfolio S&P 500 ETF (SPLG), there’s over $2 trillion in managed assets.
Download Visual | View & Modify in YCharts
This is not to say that ETFs inherently boost the value of an asset class. However, due to increased accessibility and the assets previous spot ETFs have attracted, it’s evident that these vehicles do drive more interest to underlying assets from investors.
One issuer, in particular, ARK, thinks the introduction of spot bitcoin ETFs could substantially impact Bitcoin’s price. Their 2023 Big Ideas (page 65) suggested that the bullish case for Bitcoin’s price could be $1.48 million by 2030 from its current $68,425 price. A roughly 2063% increase.
Download Visual | View & Modify in YCharts
Another issuer, Invesco, in partnership with Galaxy, created a white paper dedicated to answering portfolio-centric questions like the correlation between Bitcoin and other assets, like the S&P 500 and Bloomberg AGG.
Their findings suggest that the correlation between Bitcoin and the two other assets is 27% and 11%, respectively, from August 31, 2018, through August 31, 2023.
Meanwhile, Fidelity has literature on cryptocurrency that covers the more personal aspects of wealth management, such as estate planning.
Whether these correlations or Bitcoin’s rapid price appreciation maintains its current trajectory is up to the market. For now, though, these 10 issuers will try to capture as much market share as possible, as there is pent-up high demand for one of the best-performing asset classes of the past ten years.
Future Prospects for Crypto ETFs
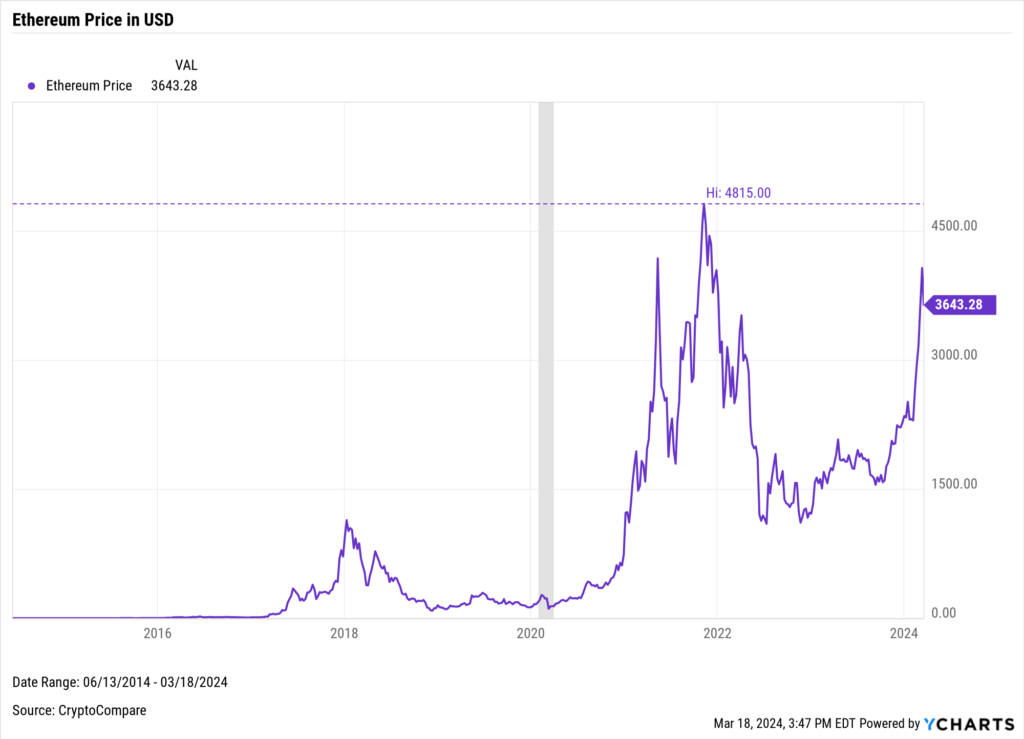
After the SEC approved spot-Bitcoin ETFs, many crypto-optimists saw the next logical step as a spot Ethereum ETF being the next ETF approved by the SEC. Ether (or ETH), the cryptocurrency that powers the Ethereum blockchain, is the second-largest cryptocurrency.
Right now, some of the same issuers of Bitcoin ETFs, including Fidelity, Blackrock, Invesco, and ARK are awaiting the SEC’s decision on a spot Ethereum ETF.
The momentum of a spot Bitcoin ETF has also sparked momentum in Ethereum’s value as well, rising 41% since the announcement.
Download Visual | View & Modify in YCharts
The momentum around Ethereum ETFs, has slowed a bit after the SEC delayed their decisions on the applications for these new products.
Using YCharts to Research and Educate Clients on Bitcoin ETFs
If you’re looking to compare Bitcoin ETFs or if you’re wondering which of these strategies are available on your platform, you can use Comp Tables or the Fund Screener in YCharts.
If you have clients who have an interest in allocating some of their assets to Bitcoin, you can use Model Portfolios and the Portfolio Optimizer in YCharts to create possible portfolios for your clients.
Once you’re satisfied with the allocation for that client’s risk tolerance, you can present the findings to a client using Report Builder in YCharts.
The SEC’s approval of spot-price Bitcoin ETFs democratized access to Bitcoin and fostered a competitive environment among fund providers. As the sector evolves, leveraging tools like YCharts to analyze, present, and stay informed on these developments will be crucial for investors and advisors, who understand the potential for both substantial growth and volatility with these new products.
Whenever you’re ready, there are 3 ways YCharts can help you:
Interested in doing further ETF research with YCharts?
Email us at hello@ycharts.com or call (866) 965-7552. You’ll get a response from one of our Chicago-based team members.
Want to test out YCharts for free?
Start a no-risk 7-Day Free Trial.
Interested in non-crypto ETFs? Download The Best Performing ETFs of 2023 for more comparative ETF analysis:
Get your copy of The Best Performing ETFs of 2023 here:Disclaimer
©2024 YCharts, Inc. All Rights Reserved. YCharts, Inc. (“YCharts”) is not registered with the U.S. Securities and Exchange Commission (or with the securities regulatory authority or body of any state or any other jurisdiction) as an investment adviser, broker-dealer or in any other capacity, and does not purport to provide investment advice or make investment recommendations. This report has been generated through application of the analytical tools and data provided through ycharts.com and is intended solely to assist you or your investment or other adviser(s) in conducting investment research. You should not construe this report as an offer to buy or sell, as a solicitation of an offer to buy or sell, or as a recommendation to buy, sell, hold or trade, any security or other financial instrument. For further information regarding your use of this report, please go to: ycharts.com/about/disclosure
Next Article
Why Frequent Advisor Communication Matters: Insights from YCharts' Latest SurveyRead More →