A Closer Look at July 2024 Fund Flows: Inflows into Fixed Income Funds and Recovery of Money Markets

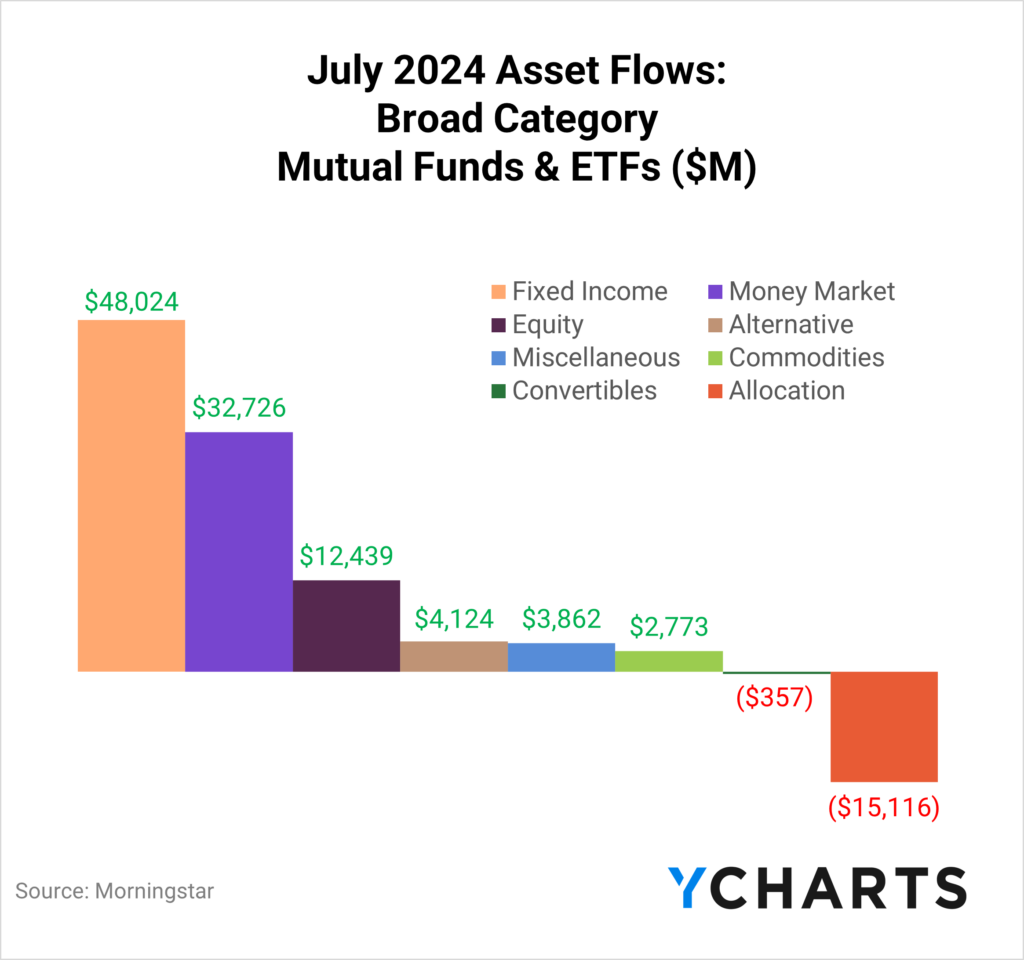
July was a big month for Fixed Income, Equity, and Money Market funds. Following a $26B exodus from Money Market funds in the second quarter, these funds experienced a substantial resurgence, drawing in $32.7B in July.
This recovery was only surpassed by the robust inflows into fixed-income funds, which led all categories with $48B. Fixed-income ETFs saw broad inflows across various durations and credit qualities. Speaking of ETFs, equity funds also enjoyed a strong month, capturing $12.4B in inflows, with the majority this influx driven by ETFs.
Read on to see how money moved in and out of strategies in more specific categories, as defined by our data providers.
Clients, sign up for YCharts’ full Fund Flow Report sent directly to your inbox.
For a more nuanced look at monthly flows, sign up for a copy of our Fund Flows Report and Visual Deck (clients only):Active ETFs vs Passive ETFs
According to a 2023 survey conducted by the Money Management Institute, 42% of asset managers currently support active ETFs, and an additional 33% plan to do so soon.
One reason behind this trend is the growing demand for active ETFs from wealth managers, with 89% already using these vehicles. Of those currently using active ETFs, 42% have expressed an intention to increase their focus on this investment option.
Throughout the first half of 2024, we’ve covered the surge in advisor demand for active ETFs, which persisted into July.
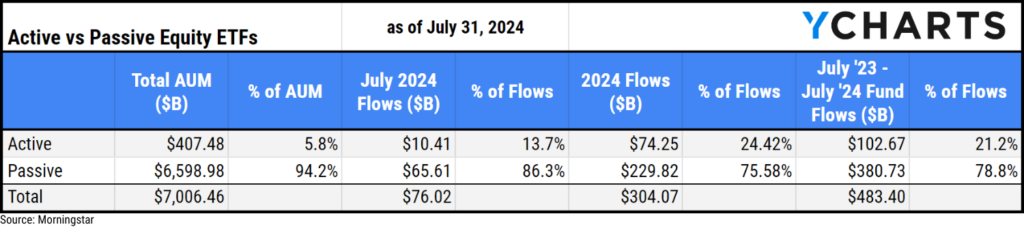
Within the equity ETFs, despite comprising only 6% of the total equity ETF AUM, active equity ETFs captured nearly a quarter of the year-to-date equity ETF inflows through the end of July. Furthermore, over the past year, these ETFs have accounted for more than one-fifth of all equity ETF flows, underscoring their growing popularity among investors.
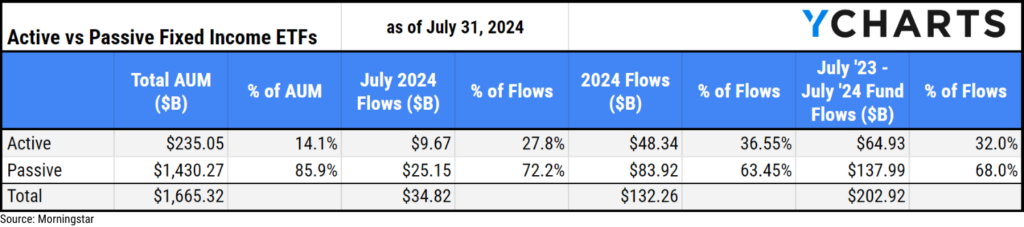
Of the $34.8B that went into Fixed Income ETFs in July, $9.7B (or 28%) came from active strategies. Although active strategies account for just 13% of the total Fixed Income ETF AUM, they have attracted 36.6% of the category’s year-to-date inflows as of July 31st.
Which ETFs are Beating the S&P 500?
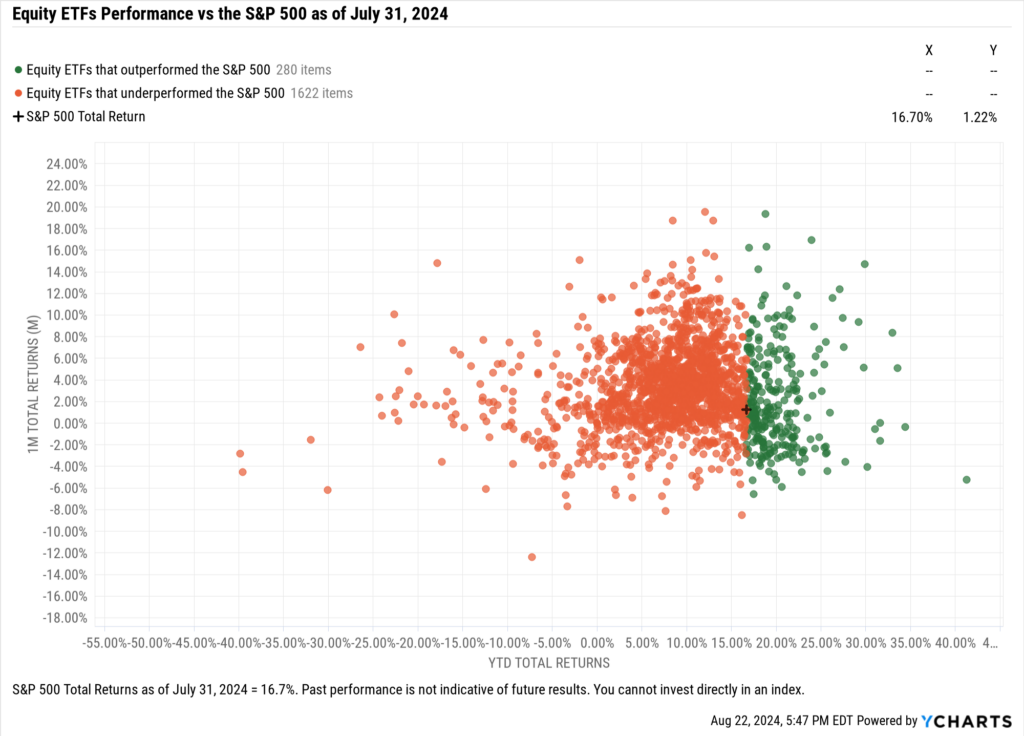
The S&P 500 posted a 16.7% total return through July 2024, a mark that only 280 (or 14.5%) equity ETFs surpassed in the period.
The lack of outperformers is largely due to the concentration of big technology names at the top of the index, where 3 names have powered a large percentage of its gains, and played an outsized role in the market drawdown in early August.
Regardless of how it achieved its performance, the high standards set by the S&P reinforces why, according to State Street’s 2024 ETF Impact survey, 98% of institutional investors use the S&P 500 as a benchmark for most or some investments.
Download Visual | Get in Touch to Access this Chart
Inflows and Outflows for Equity ETFs in July
In July, no mutual fund categories saw positive inflows, reflecting a continued investor shift away from this traditional investment vehicle. Conversely, ETFs saw significant inflows, especially in the Large and Small Blend categories. However, the mid-cap styles were the only ETFs to register net-negative outflows during the month.
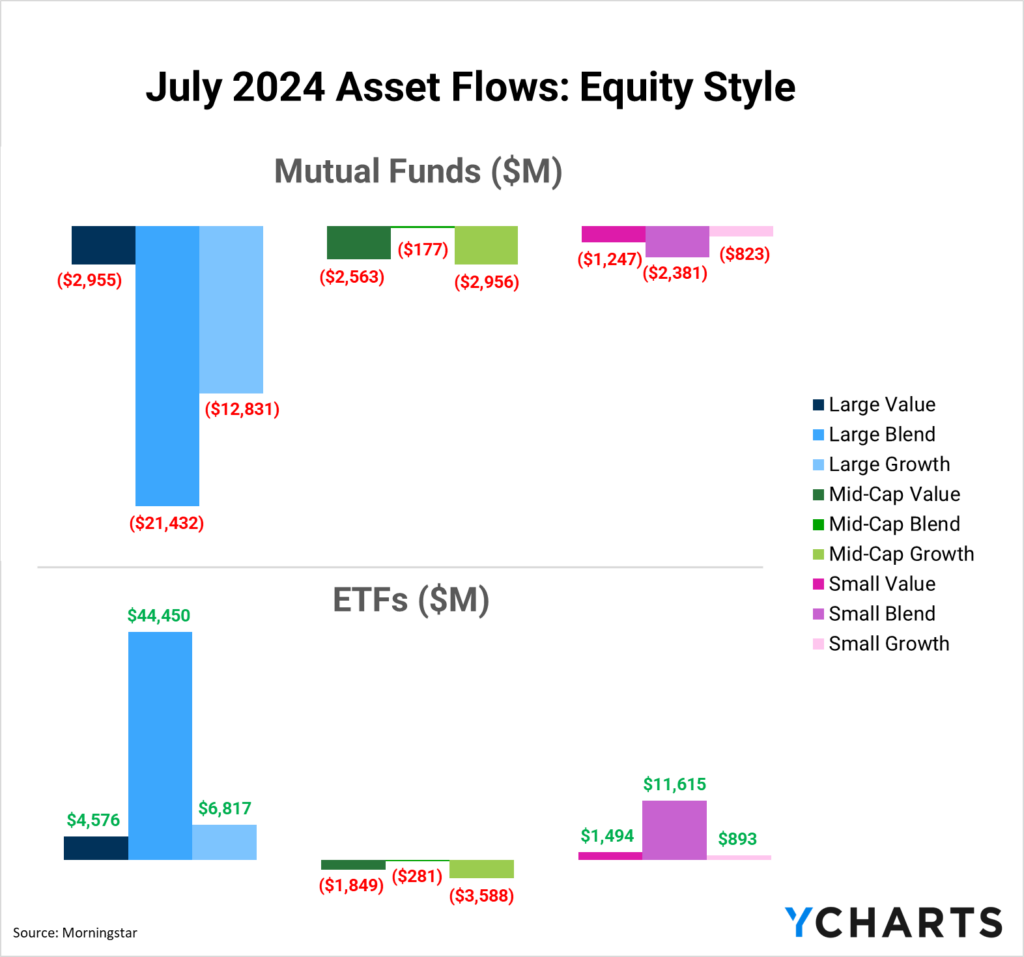
Inflows in Large Blend ETFs
Large Blend ETFs continued to dominate equity flows in July. So far, in 2024, they have amassed $136.6B in inflows, elevating the category’s total AUM to $2.8 trillion.
Among the category’s offerings, the fastest-growing funds—those at least a year old—based on YTD flows relative to AUM include the BlackRock U.S. Equity Factor Rotation ETF (DYNF), Unusual Whales Subversive Democracy Trading ETF (NANC), and SEI Enhanced US Large Cap Quality Factor ETF (SEIQ). Their YTD inflows constitute 90.6%, 86.9%, and 85.2% of their respective AUMs.
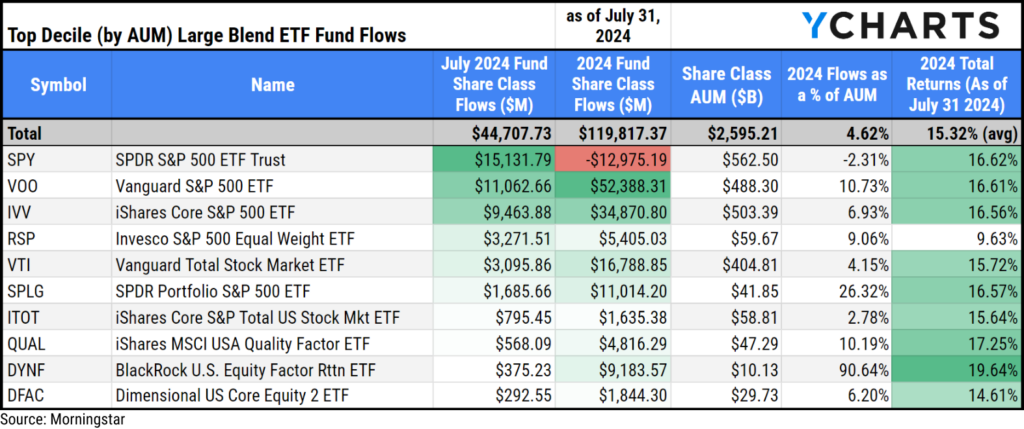
Biggest Large Blend ETFs Fund Flows
To provide a fresh perspective on the large blend ETF category, we have segmented the funds by AUM size, focusing first on the top decile, which comprises 28 ETFs. Among these, the SPDR® S&P 500® ETF Trust (SPY) led with $15.1B in July. However, SPY, often used as a trading vehicle, has experienced a net-negative flow for the year, with nearly $13 billion in outflows YTD.
Following closely, the Vanguard S&P 500 ETF (VOO) attracted $11.1B in July, and its impressive year-to-date inflows of $52.4B lead the category, representing 10.7% of its AUM. The iShares Core S&P 500 ETF (IVV) also performed well, with July inflows of $9.5B and year-to-date inflows totaling $34.9B, which constitute 6.9% of the fund’s AUM as of July 31, 2024.
Download Visual | Modify in YCharts
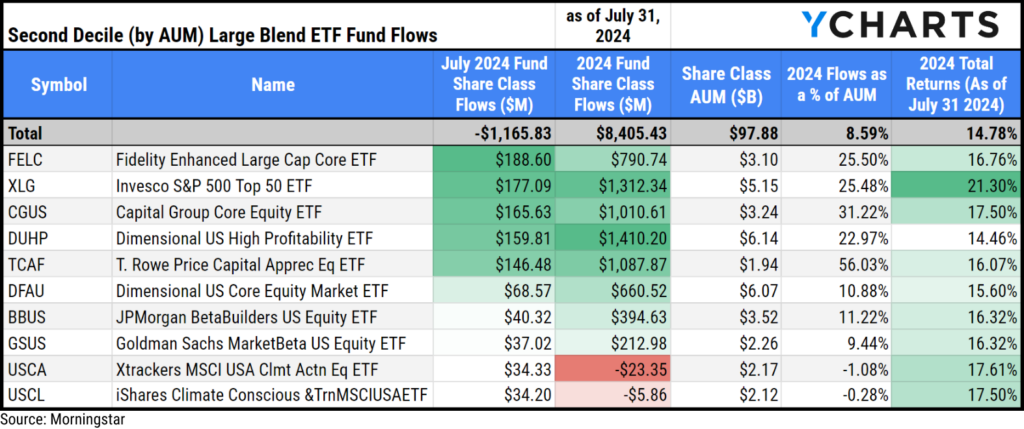
Second Biggest Large Blend ETFs Fund Flows
In the second decile (by AUM) of large blend ETFs, which comprises 28 funds, the Fidelity Enhanced Large Cap Core ETF (FELC) led the group with inflows of $188.6M in July. It was closely followed by the Invesco S&P 500® Top 50 ETF (XLG) and the Capital Group Core Equity ETF (CGUS), which brought in $177.1M and $165.6M, respectively.
The Eagle Capital Select Equity ETF (EAGL), which was converted from a separately managed account (SMA) earlier this year, technically leads this group in year-to-date flows with $1.9B. The Dimensional US High Profitability ETF (DUHP) follows with $1.4B in YTD inflows, representing 23% of its AUM. XLG has amassed $1.3B YTD, accounting for 25.5% of its AUM. The T. Rowe Price Capital Appreciation Equity ETF (TCAF) secured $1.1B in YTD inflows, which is 56% of its AUM. Rounding out the top five, CGUS brought in $1B YTD, constituting 31.2% of its AUM.
Download Visual | Modify in YCharts
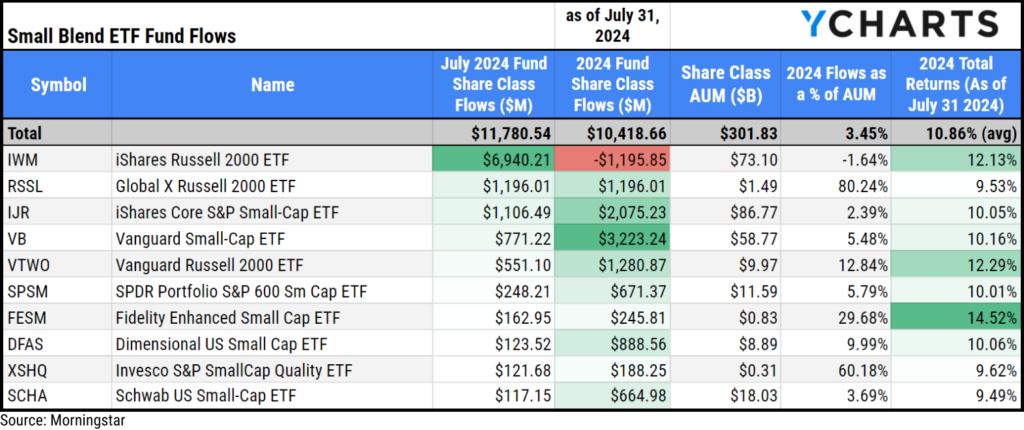
Inflows in Small Blend ETFs
In July, Small Blend ETFs attracted $11.8B in inflows, counterbalancing earlier outflows and bringing the category’s YTD net flows to $10.4B. These inflows have elevated the category’s total assets to over $285 billion.
The iShares Russell 2000 ETF (IWM) led the inflow surge, attracting $6.9 billion, representing 9.5% of the fund’s AUM. Despite July’s inflows, the fund has experienced a net outflow of $1.2 billion so far in 2024.
Other popular small-cap blend strategies included the Global X Russell 2000 ETF (RSSL), iShares Core S&P Small-Cap ETF (IJR), and Vanguard Small-Cap ETF (VB), which garnered $1.2B, $1.1B, and $771M, respectively, in July.
Download Visual | Modify in YCharts
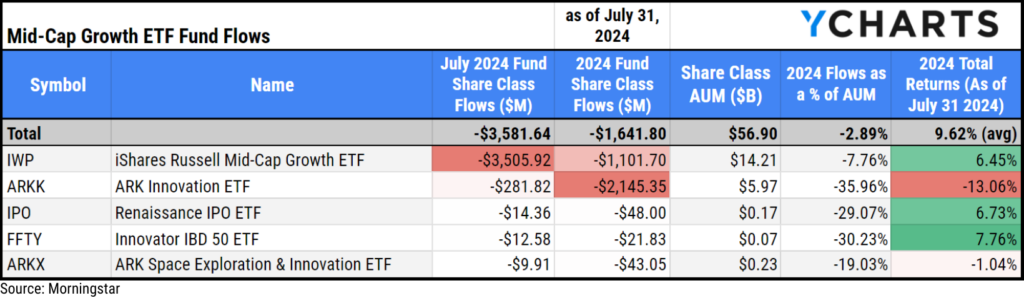
Outflows in Mid-Cap Growth
Mid-Cap Growth ETFs experienced outflows totaling $3.6B, reversing the inflows observed earlier in the year. This shift brought the category’s YTD net flows to a negative $1.6B. The iShares Russell Mid-Cap Growth ETF (IWP) was the primary driver of the negative momentum in July, accounting for $3.5B—or 98%—of the category’s total outflows for the month.
Here are the other Mid-Cap Growth ETFs that saw the most outflows in July:
Download Visual | Modify in YCharts
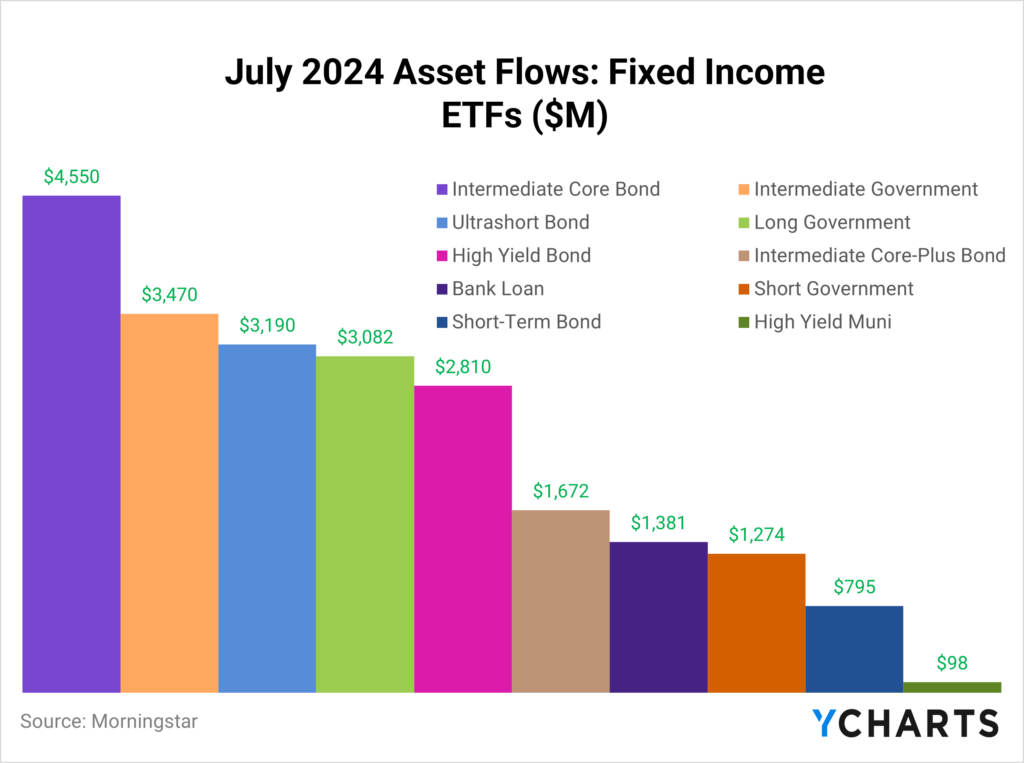
July 2024 ETF Fixed Income Fund Flows
July proved to be a good month for fixed-income ETFs across all credit qualities and durations, with each observed category registering positive inflows. Leading the charge were the Intermediate Core and Intermediate Government Bond ETF categories.
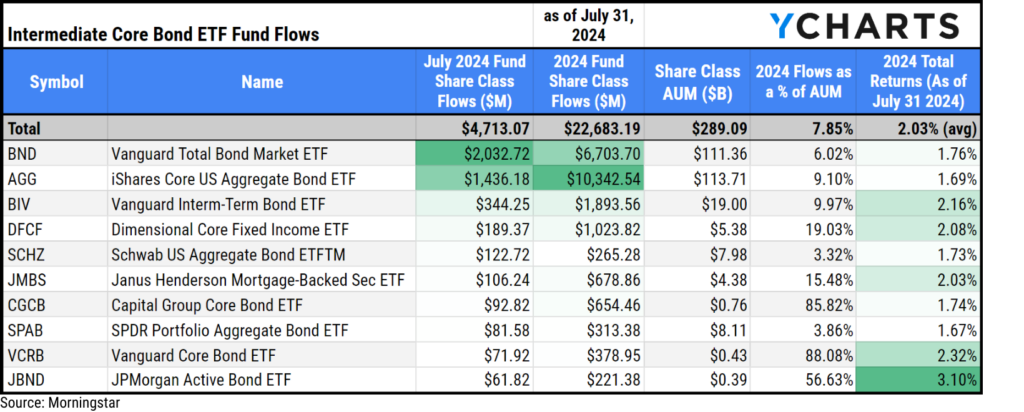
Inflows in Intermediate Core Bond ETFs
Intermediate Core Bond ETFs attracted $4.7B in July, further contributing to the $22.7B the category has accumulated in 2024. These inflows have propelled the category’s AUM to nearly $290B.
The two most popular strategies in July were the Vanguard Total Bond Market ETF (BND) and the iShares Core US Aggregate Bond ETF (AGG), attracting $2B and $1.4B, respectively. Together, they accounted for 74% of the category’s total inflows in July.
Download Visual | Modify in YCharts
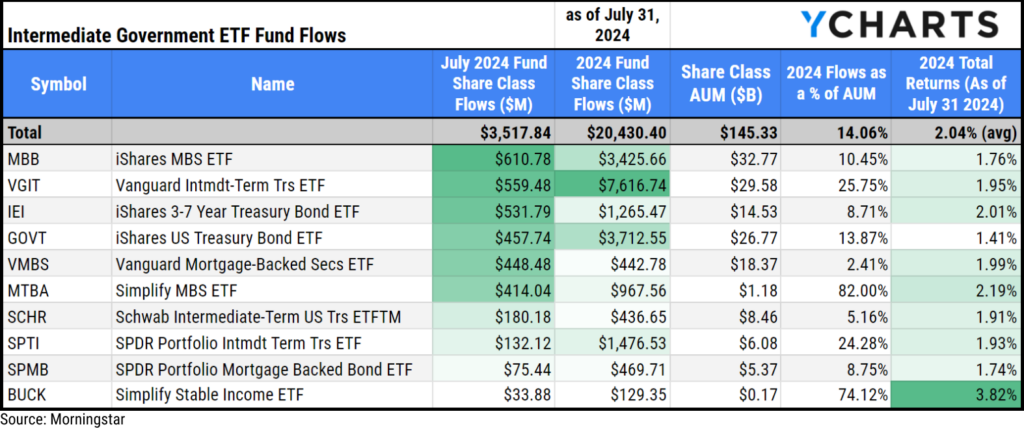
Inflows in Intermediate Government ETFs
Intermediate Government Bond ETFs secured $3.5B in inflows in July, making them the second most popular fixed-income ETF category for the month.
The distribution of inflows across the top funds was more even compared to the Intermediate Core category. The leading funds were the iShares MBS ETF (MBB), Vanguard Intermediate-Term Treasury ETF (VGIT), and iShares 3-7 Year Treasury Bond ETF (IEI), with inflows of $611M, $560M, and $532M, respectively.
Download Visual | Modify in YCharts
Whenever you’re ready, there are three ways YCharts can help you:
Have questions about how YCharts can help you grow AUM and prepare for meetings?
Email us at hello@ycharts.com or call (866) 965-7552. You’ll get a response from one of our Chicago-based team members.
Unlock access to our Fund Flows Report and Visual Deck by becoming a client.
Dive into YCharts with a no-obligation 7-Day Free Trial now.
Sign up for a copy of our Fund Flows Report and Visual Deck (clients only):
Disclaimer
©2024 YCharts, Inc. All Rights Reserved. YCharts, Inc. (“YCharts”) is not registered with the U.S. Securities and Exchange Commission (or with the securities regulatory authority or body of any state or any other jurisdiction) as an investment adviser, broker-dealer or in any other capacity, and does not purport to provide investment advice or make investment recommendations. This report has been generated through application of the analytical tools and data provided through ycharts.com and is intended solely to assist you or your investment or other adviser(s) in conducting investment research. You should not construe this report as an offer to buy or sell, as a solicitation of an offer to buy or sell, or as a recommendation to buy, sell, hold or trade, any security or other financial instrument. For further information regarding your use of this report, please go to: ycharts.com/about/disclosure
Next Article
Why "Time in the Market" Trumps "Timing the Market"Read More →